A whole-deck walkthrough of Almanac's 22-page October 2019 seed deck: page 9 counts 50 customers (companies, including trials).
50 Customers Today, 60K 'Paying Customers' Tomorrow: Almanac's Forecast Units
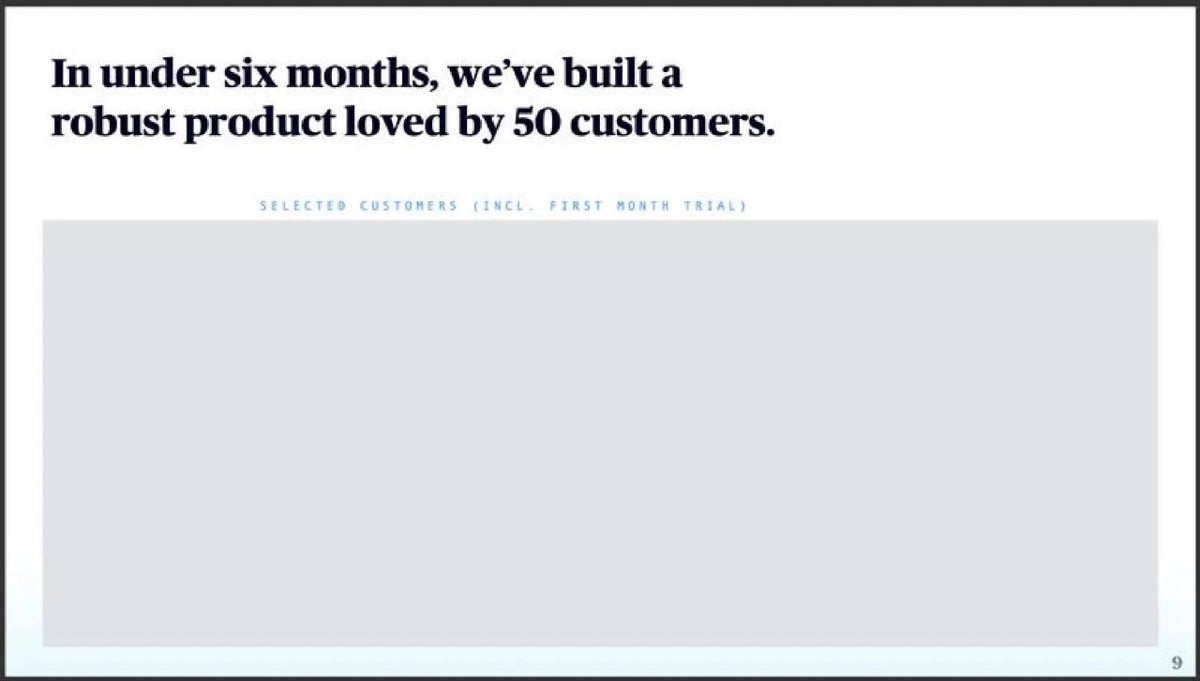
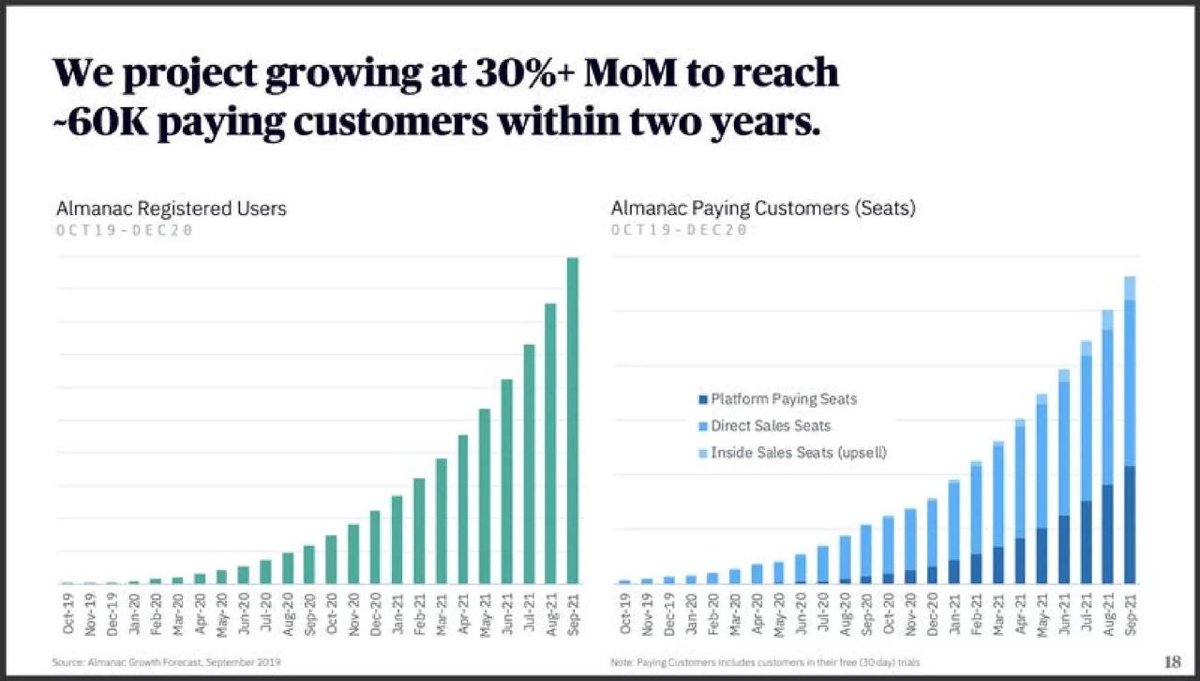
A forecast is only as readable as its unit. If the word 'customer' means a company on the traction page and a single user licence on the forecast page, the two can't be compared, and the growth between them looks larger than it is. Almanac's 22-page seed deck from October 2019, for a platform that lets professionals find, copy and improve shared business documents ('GitHub for knowledge professionals'), shows this clearly. Page 9 says the product is 'loved by 50 customers', with logos labelled 'incl. first month trial'. Page 18's title says 'We project growing at 30%+ MoM to reach ~60K paying customers within two years', but its chart is titled 'Paying Customers (Seats)', and a note says paying customers 'includes customers in their free (30 day) trials'. We read the deck page by page and follow that word.
TL;DR
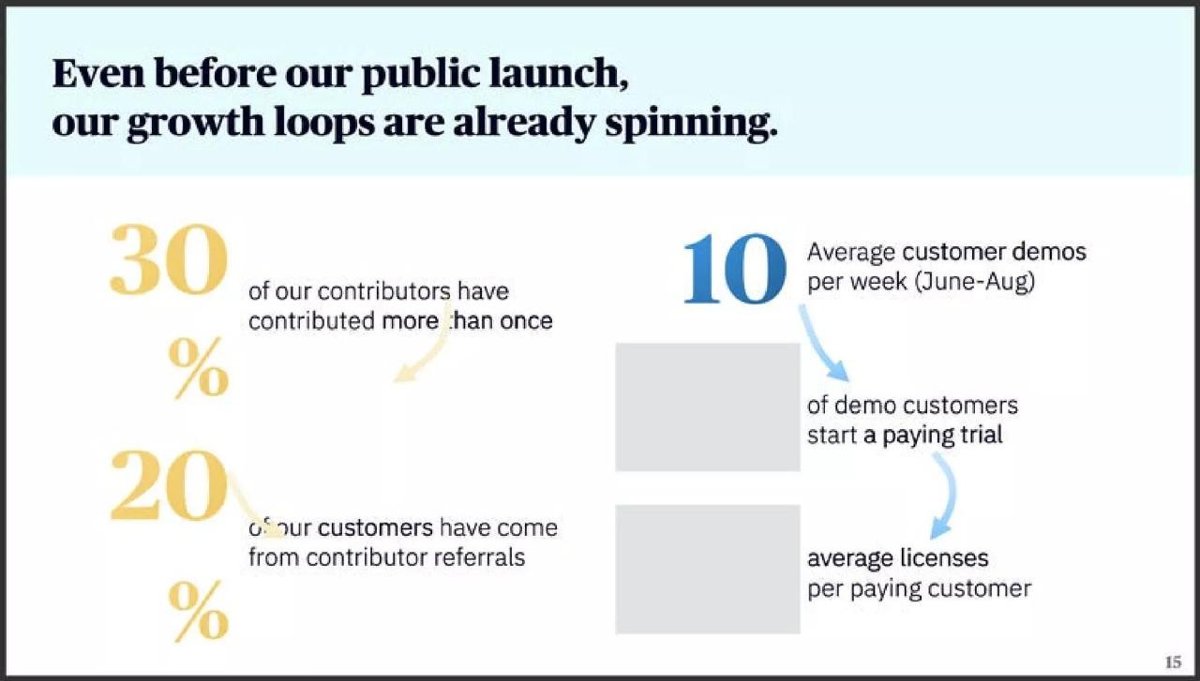
Page 9's '50 customers' are organisations, counted including first-month trials. Page 18's '~60K paying customers' are seats (individual user licences), counted including free 30-day trials. The step from 50 to 60,000 mixes a change of unit with growth. The figure that would connect them, 'average licenses per paying customer' on page 15, is redacted in our copy, so we can't convert one to the other and we don't estimate it.
Page 18's chart also has no vertical scale, its subtitle says 'OCT19–DEC20' while its axis runs to September 2021, and 30% a month for the 23 months shown multiplies the starting value by about 420 (our arithmetic). The rest of the deck is strong: a clearly argued problem, a priced product with tiers from $5 to $10 per user a month, and a stated raise of $3M.
The lesson for founders: pick one customer unit, use it on the traction page and the forecast, show the conversion between companies and seats if you use both, and keep anyone who hasn't paid out of a series labelled 'paying'.
The deck page by page, following the word 'customer'
Seven pages from Almanac's 22-page deck, from the cost of the problem to the raise.
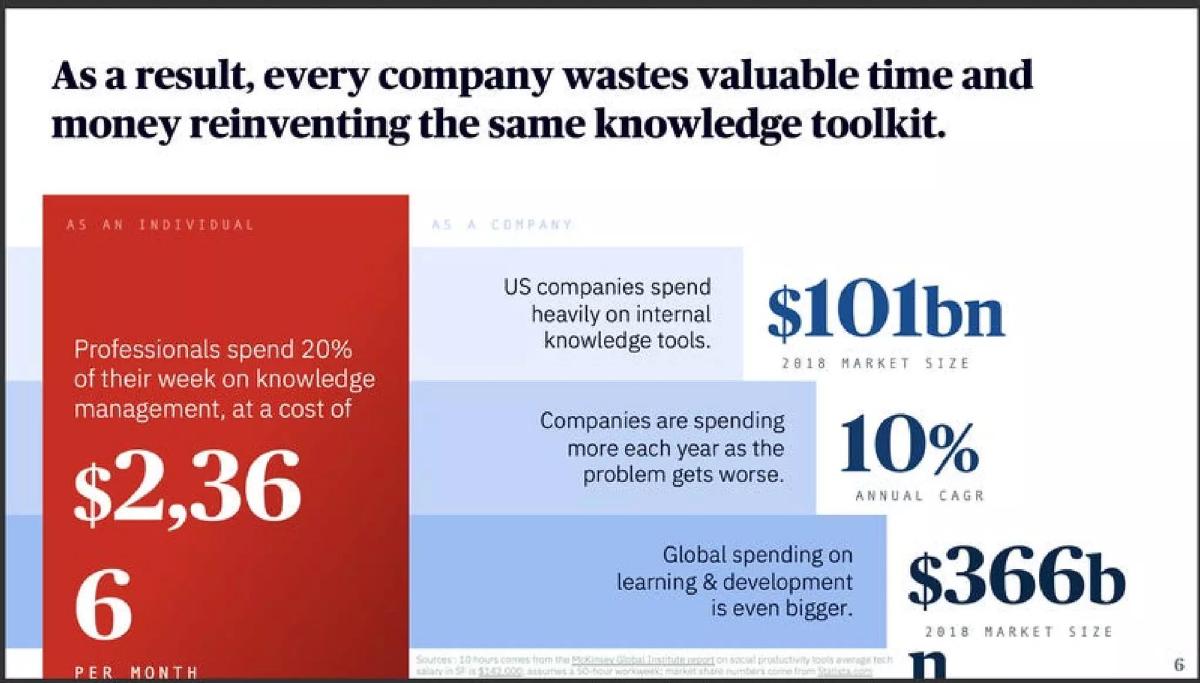
Almanac executive summary slide — slide 6
Knowledge-sharing software. Cost of the problem.
Almanac deck, slide 6. Exact stored slide matched to this analysis.
Our analysis: Our reading: mixed scopes, but clearly labelled.
Evidence and limitation: Each figure labels its unit and scope.
What a founder can adapt: Label every market figure's unit, place and year.
Supporting analysis
What the deck claims: 20% of the week at $2,366 per month per person; US internal knowledge tools $101bn (2018), 10% a year; global L&D $366bn.
Presentation choice: Labelled units let readers keep figures apart.
When it does not fit: Don't combine figures from different scopes.
Each customer figure, its unit and whether it includes trials.
Page
Figure
Unit
Includes trials?
9
50 customers
Organisations
Yes ('incl. first month trial')
15
20% of customers from referrals
Organisations (implied)
Not stated
15
Licences per paying customer
Seats per organisation
Blanked in our copy
18
~60K paying customers
Seats
Yes (free 30-day trials)
Key Takeaways
Use one meaning of 'customer' from traction to forecast.
If you forecast seats, show seats per company.
Keep free trials out of anything called 'paying'.
Give forecast charts a scale and a matching date range.
Show what monthly growth rate compounds to.
Check your customer units
Answer these before you finalise traction and forecast pages.
Unit. Is a customer an organisation, a seat or a user?
Paid. How many of your current customers have paid?
Ratio. How many seats does a paying organisation hold?
Start. What is the forecast's starting value?
Scale. Can a reader read every month on the chart?
Copyable framework: Today: [n] organisations ([n] paid), [n] seats ([n] paid). Average [n] seats per paying organisation. Forecast: [n] paid seats in [n] organisations by [date], from [start] at [x]% a month.
Illustrative example 1 — written by us
Before: 'We project growing at 30%+ MoM to reach ~60K paying customers within two years.' Note: Paying Customers includes customers in their free (30 day) trials.
After: We project ~[n] paid seats across [n] organisations by September 2021, from [start] seats today at 30% a month; trial seats shown separately.
What improved: Our illustrative rewrite. The 30% rate, ~60K and dates are from page 18; bracketed values are placeholders, not Almanac's figures. It names the unit, separates trials and states the start.
The question this guide answers
Our Almanac teardown describes the deck as a content-led growth playbook. One published guide and one draft, on market-share targets, use its vision page (page 19). No guide follows the deck from start to finish. Advice on forecasts usually covers whether a growth rate is believable. This walkthrough asks an earlier question that matters for any software company that sells to teams and charges per user: is the forecast counting the same thing as the traction, and does the word 'paying' mean paying?
How we read the deck
We rendered all 22 pages of the original file in our library and read them on a contact sheet at about 600 pixels per page; pages 15 and 18 were also read at full size. The file has no text layer, so quotes are read from the page images. Page 1 is dated 'October 2019' and page 22 is a closing page. In our copy, the customer logos on page 9, a photo area on page 10, two figures on page 15 and the revenue target on page 21 ('$XM in ARR') are blanked out. We don't guess any of them, and we don't use other pages to reconstruct them.
The library record has no source listed. The deck states a raise of $3M; we make no claim about whether it raised money with this deck. Compounding and ratios in this guide are our arithmetic on the deck's figures. Third-party statistics are reported as shown; we haven't checked them.
Step one: a well-argued problem
Page 2 says '100 million professionals work in tech-heavy roles today, growing 12%', with a chart of '128m US labor force', '91m professionals in the knowledge sector' and '10.8m non-engineering professionals at tech companies'. Page 3 lists tasks by role, from 'Writing and replicating job descriptions' to 'Writing a complex partnership contract'. Page 4 says engineers have Stack Overflow, GitHub and GitLab to 'discover', 'branch or fork' and 'compare & merge'. Page 5 says no equivalent exists for professionals, who 'waste time looking', 'recreate from scratch' and 'struggle to maintain structure'. Page 6 sizes the cost: professionals spend '20% of their week on knowledge management, at a cost of $2,366 per month'; 'US companies spend heavily on internal knowledge tools: $101bn' (2018), growing '10%' a year; and 'Global spending on learning & development is even bigger: $366bn'.
Our reading: this is an effective opening. Page 4's comparison with engineering tools gives a reader an instant mental model, and page 6 states its units (per person per month, US company spending, global training spending). The figures come from different scopes, US and global, but each is labelled, so a reader can keep them apart.
Step two: product and early evidence
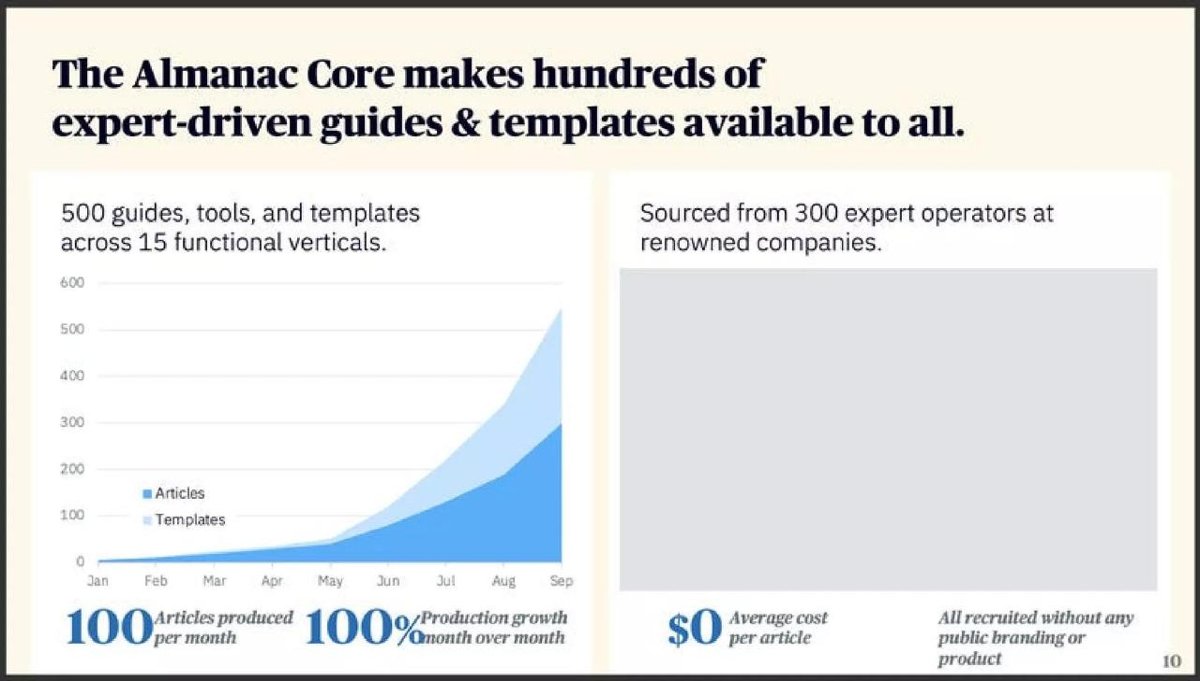
Page 7 says 'Almanac is GitHub for knowledge professionals'. Page 8 shows six founders and leaders. Page 9 says 'In under six months, we've built a robust product loved by 50 customers', above blanked-out logos labelled 'Selected customers (incl. first month trial)'. Page 10 says 'The Almanac Core' has '500 guides, tools, and templates across 15 functional verticals', 'Sourced from 300 expert operators', '100 articles produced per month', '100% production growth month over month' and '$0 average cost per article'. Pages 11 to 13 show copying, version history and a comparison claiming the product is '10x faster than today's alternatives' (about 6 minutes against about 56 minutes, by our sum of page 13's labelled steps). Page 14 diagrams the growth loops. Page 15 says '30%' of contributors have contributed more than once, '20%' of customers 'have come from contributor referrals', and '10' customer demos a week (June–August); the share of demos that start a paying trial and the 'average licenses per paying customer' are blanked out.
Our reading: the early evidence is specific, and page 9 is careful to say that its 50 include trial accounts. Note the unit: logos on page 9 are organisations. Page 15's blanked 'average licenses per paying customer' is exactly the figure a reader would need to turn organisations into seats. We treat it as unknown.
Step three: priced per user
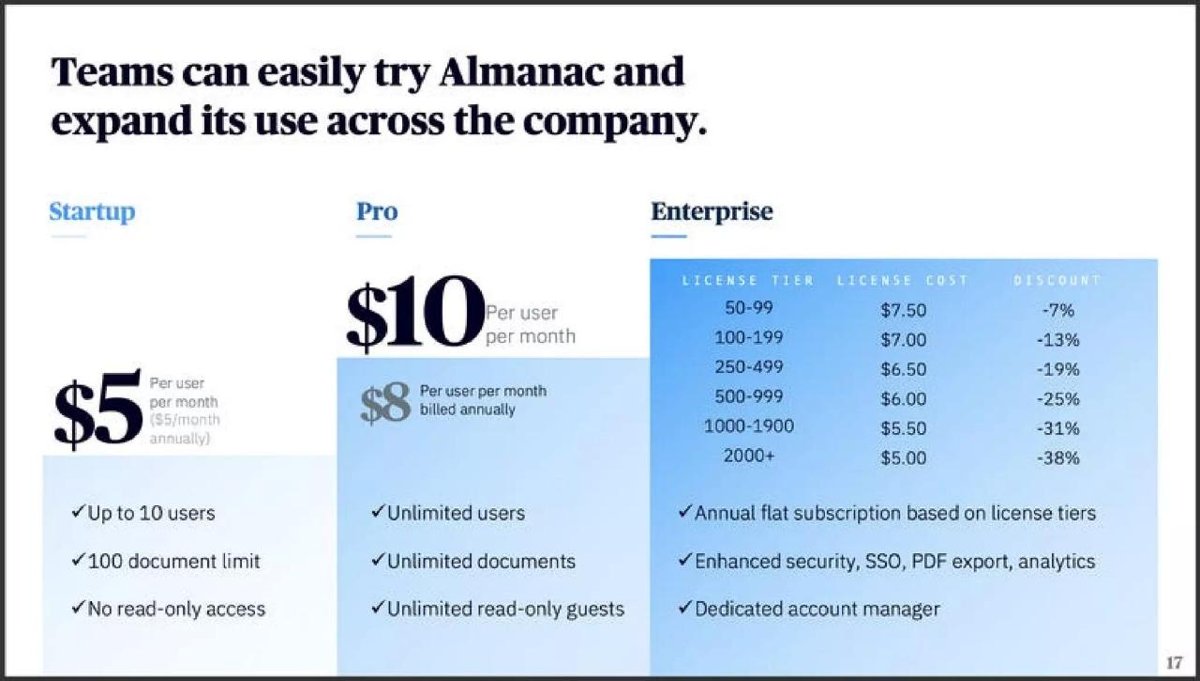
Page 17 shows three plans: Startup at '$5 per user per month' for up to 10 users, Pro at '$10 per user per month' or '$8' billed annually, and Enterprise with licence tiers from '$7.50' for 50–99 seats down to '$5.00' for 2,000 or more, with discounts of 7% to 38%. Page 16 positions Almanac as both 'bottoms up' and combining general productivity with knowledge management.
Our reading: clear, published pricing is a strength many early decks lack. It also confirms that the company's revenue unit is the seat. That makes it reasonable to forecast in seats. The problem is only that the forecast calls them 'customers'.
Step four: the forecast changes the unit
Page 18's title says 'We project growing at 30%+ MoM to reach ~60K paying customers within two years.' The left chart, 'Almanac Registered Users', and the right chart, 'Almanac Paying Customers (Seats)', both carry the subtitle 'OCT19–DEC20', but their axes run from October 2019 to September 2021. The right chart splits seats into 'Platform Paying Seats', 'Direct Sales Seats' and 'Inside Sales Seats (upsell)'. A footnote reads 'Note: Paying Customers includes customers in their free (30 day) trials.' The source line says 'Almanac Growth Forecast, September 2019'. Neither chart has a vertical scale.
Our reading: four things make the page hard to read. First, 'customers' here means seats, while page 9's 50 customers are organisations, so 50 to 60,000 isn't a like-for-like comparison. Second, 'paying' includes free trials, which is the opposite of what the word means. Third, without a scale a reader can't read any month's value, only the final ~60K in the title. Fourth, 30% a month compounds fast: over the 23 monthly steps from October 2019 to September 2021 it multiplies the starting figure by about 420, so ~60K at the end implies roughly 140 seats at the start (our arithmetic, assuming exactly 30%). The deck doesn't give its starting seat count, so we can't check this against page 9. The seat chart itself doesn't look like 30% every month: measured by eye, its October 2019 bar is very roughly a sixtieth of the September 2021 bar, not a four-hundredth. That's a much lower average rate, about 20% a month, so either the '30%+' describes part of the period or the bars and the title disagree. With no scale, a reader can't tell which.
Step five: vision, defensibility and the raise
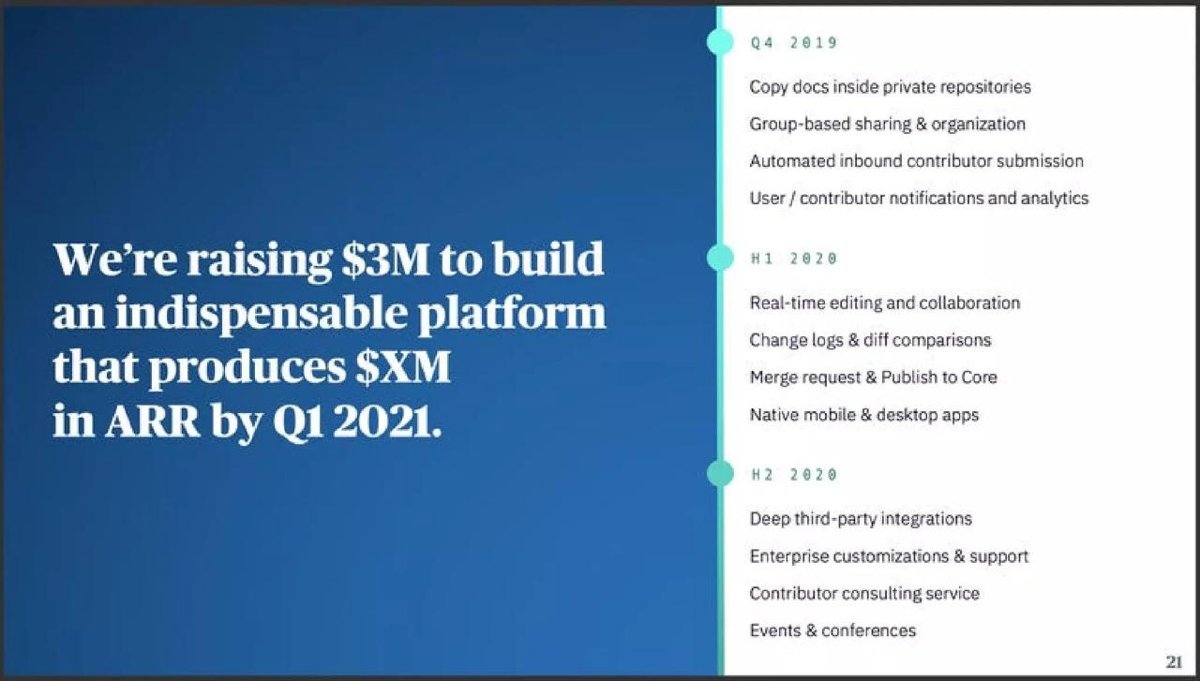
Page 19 shows a '$110b market' with '10% market share' giving a '$10b enterprise', beside comparable companies: Atlassian '$3.3b' 2017 revenue, GitHub '$7.5b' (acquisition), Lynda.com '$1.5b', Salesforce '$13.3b' and Stripe '$35b'. Page 20 lists five reasons Almanac wins, from network effects to switching costs. Page 21 says 'We're raising $3M to build an indispensable platform that produces $XM in ARR by Q1 2021', with a roadmap for Q4 2019, H1 2020 and H2 2020.
Our reading: the raise and roadmap are clear. The revenue target is blanked in our copy, so we can't compare it with page 18. Page 19's comparables mix revenue, acquisition prices and a private valuation; the deck labels each, which helps, but they measure different things. Page 6 gave US internal knowledge tools as $101bn in 2018; page 19's $110b, labelled 'US only, no ancillary revenue', is consistent with roughly a year of the stated 10% growth (our inference), though the deck doesn't say so.
What the deck proves, and what it leaves open
What a reader can take: a sharp problem with labelled market figures, a working product with early adoption, a content library growing quickly at no stated cost per article, public per-seat prices and a defined raise. What stays unknown: how many seats the 50 customers hold, how many of the 50 have paid, how many demos convert, what the starting seat count is, what the forecast shows in any month before the end, and what revenue target the round is meant to reach.
Most of those unknowns come from two choices on page 18, calling seats 'customers' and counting trials as 'paying', plus the missing scale. Fixing them needs no new data, only relabelling and a few numbers the company already tracks.
Keeping one unit from traction to forecast
Keep 'customer' for organisations and 'seat' for licences, and use both on the traction page: '50 organisations, [n] seats, of which [n] paid'. On the forecast, title the chart 'Paid seats' and either remove trials or show them as a separate series. Add a vertical scale, fix the subtitle to match the axis, and add a second line for organisations so a reader sees both units grow. State the starting figure and what 30% a month implies at 12 and 24 months.
If figures are private, as the blanked areas suggest, say which ones are withheld and give a range or a ratio instead: for example, 'average seats per paying customer: [range]'. That keeps the argument checkable without disclosing the exact number.
Common mistakes
'Customer' changes meaning. Keep one unit throughout.
Trials counted as paying. Show trials separately.
Seats without a ratio. Give seats per organisation.
Forecast without a scale. Let readers read each month.
Subtitle and axis disagree. Match the stated period.
Diagnostic checklist
'Customer' means one thing in every page.
Seats and organisations are both shown if both are used.
Paid and trial counts are separate.
The forecast states its starting value.
The chart has a scale.
The subtitle matches the axis.
The compounded effect of the growth rate is stated.
Frequently asked questions
Should a SaaS forecast count customers or seats?
Either works if it's labelled. If you price per seat, forecast seats and call them seats, and show organisations separately so readers can compare with traction.
How many customers did Almanac have?
Page 9 says 50 customers, with logos labelled as including first-month trials. Our copy blanks the logos.
What did Almanac's forecast show?
Page 18 projects growth at 30%+ a month to about 60,000 'paying customers' within two years; its chart counts seats and includes free 30-day trials.
What did Almanac charge?
Page 17 lists $5 per user a month (Startup), $10 or $8 billed annually (Pro), and Enterprise tiers from $7.50 down to $5.00 per seat.
How much was Almanac raising?
Page 21 says $3M. The revenue target beside it is blanked in our copy, and we make no claim about funding from this deck.
How we chose these examples
Selection (2026-10-02): Almanac was the saved lead. Distinctness check: one published guide and one draft use page 19; no guide examines how the meaning of 'customer' changes between traction and forecast across a whole deck.
All 22 pages of the original deck file (image-only) were rendered at 1280 px wide and read on a contact sheet at about 600 px per page; pages 15 and 18 were also read at full size (AI editorial model review, not human). Seven images are used: pages 6, 9, 10, 15, 17, 18 and 21 were stored for this draft on 2026-10-02 from the renders.
Redactions in our copy (page 9 logos, page 15 conversion and licences per customer, page 21 ARR target) are not guessed or reconstructed. The ×~420 compounding and ~140 starting seats assume exactly 30% a month over 23 steps; page 13's minute totals are our sums. Third-party figures are reported as shown and not independently checked.
Eligibility: private startup deck, already in our library with an existing teardown; no takedown request is recorded. No individuals are named. No funding or outcome claim is made.