Lupiya, a Zambian-based neobank, successfully raised $8.3M in a Series A round led by Alitheia IDF Fund. Their pitch deck is a concise 11-slide presentation that prioritizes traction and market opportunity over technical jargon. The deck highlights a significant gap in the African financial sector, where 65% of the adult population is marginalized and 70% of women are financially excluded. By showcasing triple-digit growth across ARR, loan book, and customer base, Lupiya positioned itself as a dominant player in the Southern African region. The inclusion of clear revenue models for lending, P…
Key takeaways
- The problem slide identifies a massive inefficiency in African finance, citing a 3-week average loan processing time (Slide 2).
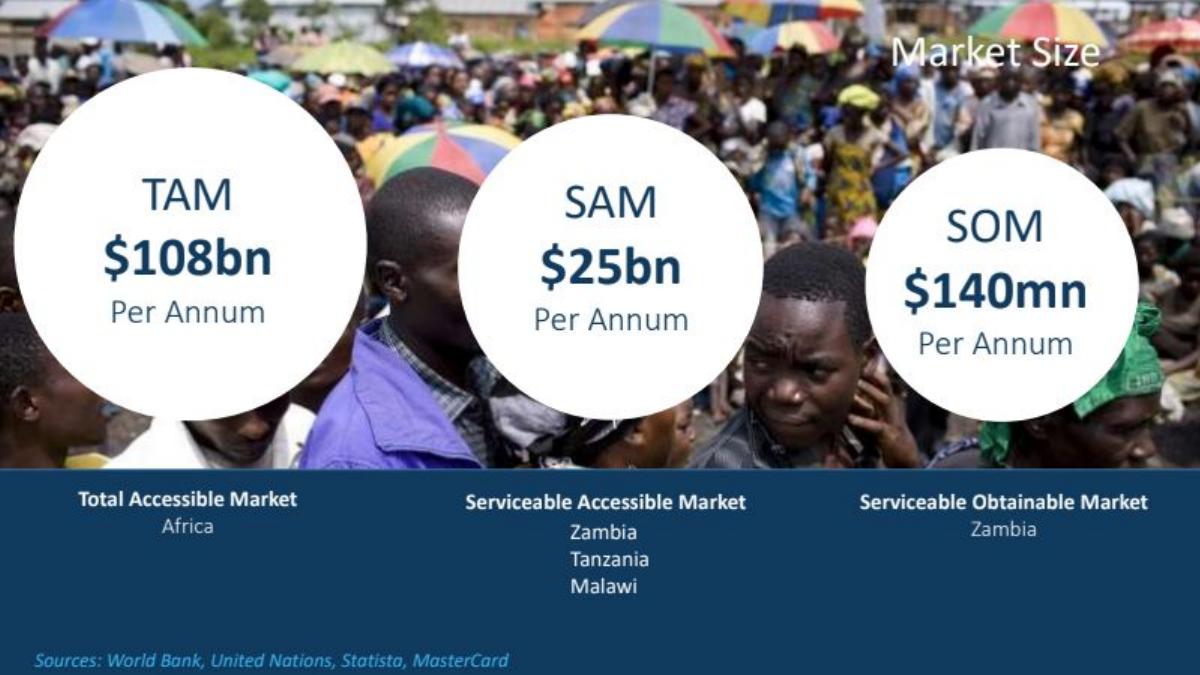
- Lupiya defines its market opportunity with a $108bn TAM for Africa and a specific $140mn SOM for Zambia (Slide 4).
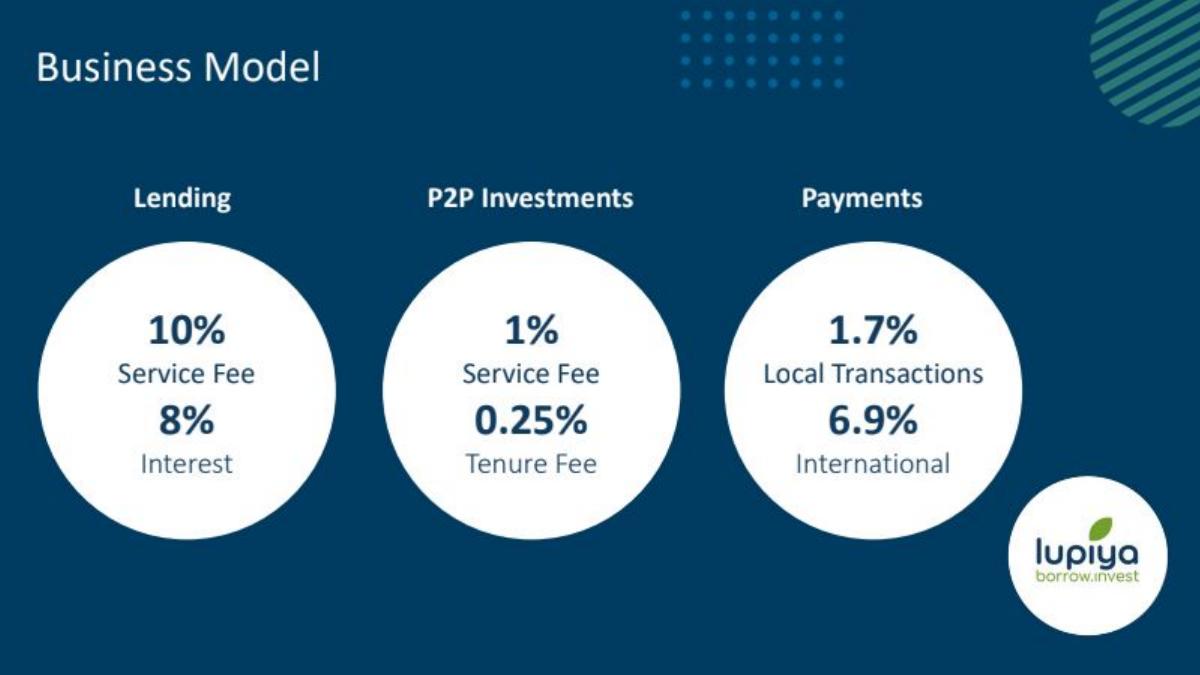
- The business model is diversified across three streams: Lending (10% fee + 8% interest), P2P Investments (1% fee), and Payments (up to 6.9% for international) (Slide 5).
- Traction is the deck's strongest point, reporting 598% YoY ARR growth and 1500% YoY EBITDA growth (Slide 7).
- The company leverages social proof by listing awards like 'Startup of the Year' and partnerships with Google and Mastercard (Slide 7).
- Gender diversity is a core pillar, with the deck stating the team is 60% female and management is 66% female (Slide 8).
- The ask was for $10 million, with 75% already committed at the time of the presentation (Slide 9).
- The deck lacks a detailed roadmap or product feature breakdown, focusing instead on high-level service categories (Slide 3).
Lupiya Series A Teardown: High-Velocity Growth in Emerging Markets
Lupiya’s pitch deck is a lean, 11-slide document that successfully secured $8.3M in Series A funding. In a sector as crowded as African FinTech, Lupiya stands out by focusing on the 'missing middle' of the economy—specifically marginalized populations and women. The deck is characterized by high-contrast visuals and a heavy reliance on growth percentages to tell a story of rapid market capture.
Slide 1: Title and Validation
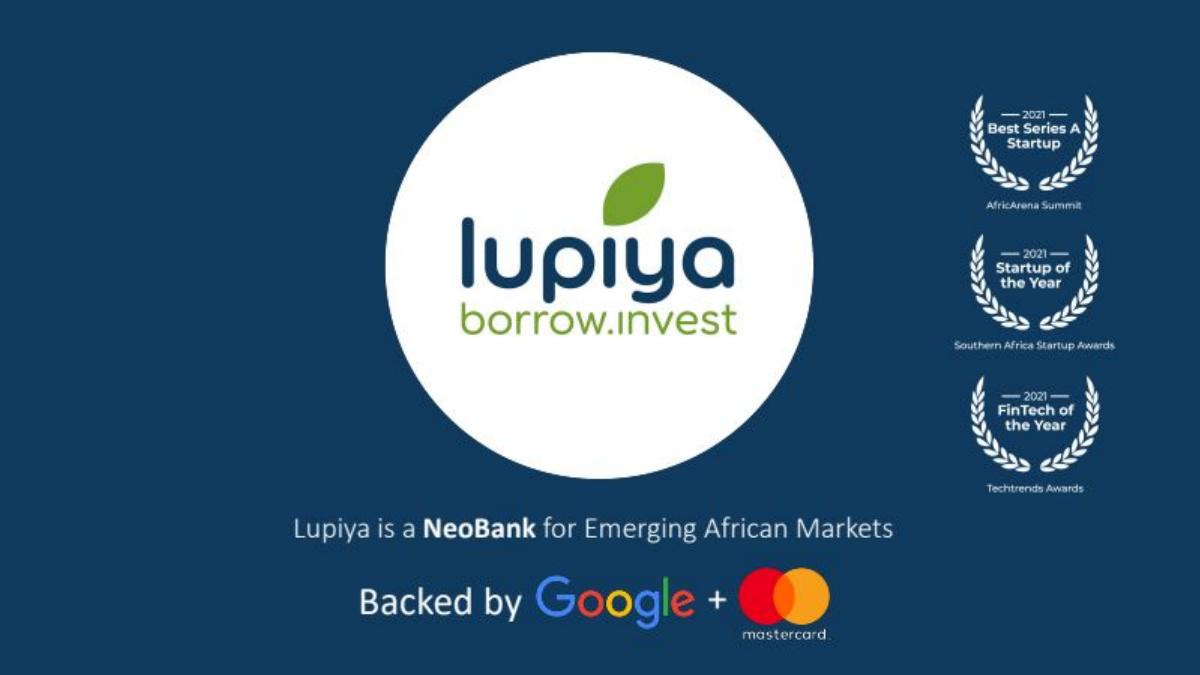
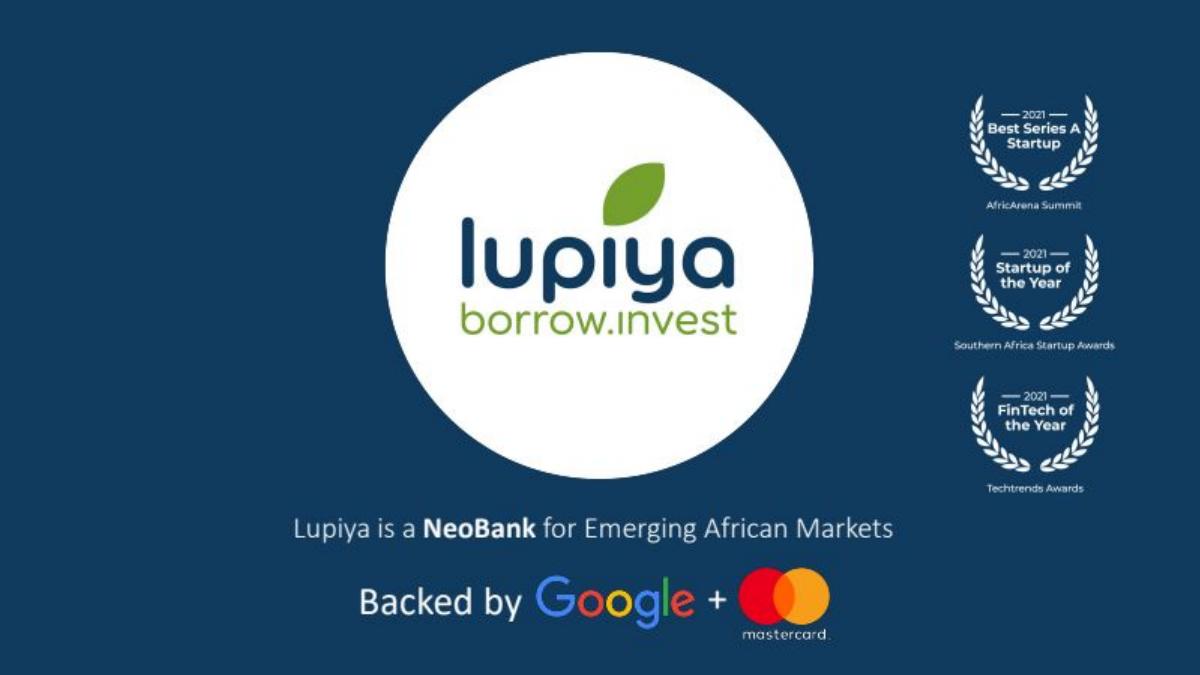
The cover slide establishes Lupiya as a 'NeoBank for Emerging African Markets.' It immediately utilizes social proof by displaying three awards from 2021: Best Series A Startup (AfricaArena), Startup of the Year (Southern Africa Startup Awards), and FinTech of the Year (Techtrends). The bottom of the slide features logos for Google and Mastercard, explicitly stating the company is 'Backed by' these entities. This sets a high bar for credibility before the investor even sees a metric.
Slide 2: The Problem
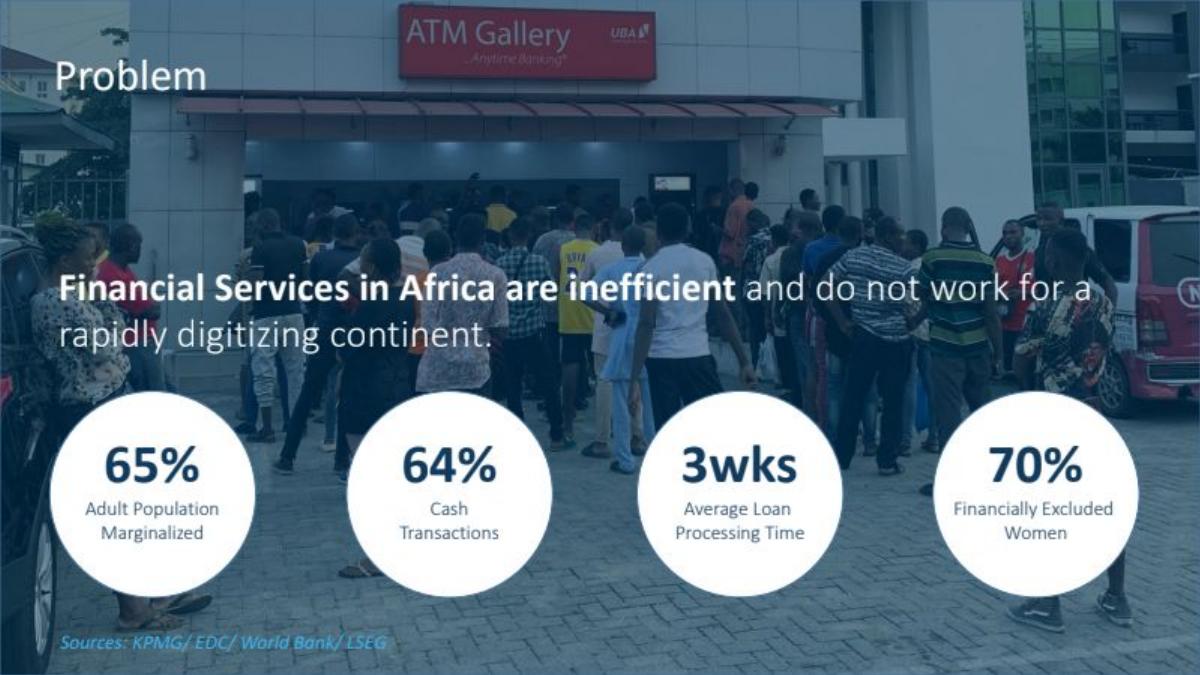
The problem slide uses a background image of a crowded ATM gallery to visualize the 'inefficient' nature of current financial services. It lists four key pain points: 65% of the adult population is marginalized, 64% of transactions are cash-based, there is a 3-week average loan processing time, and 70% of women are financially excluded. By citing sources like KPMG and the World Bank, Lupiya grounds these systemic issues in verifiable data.
Slide 3: The Solution
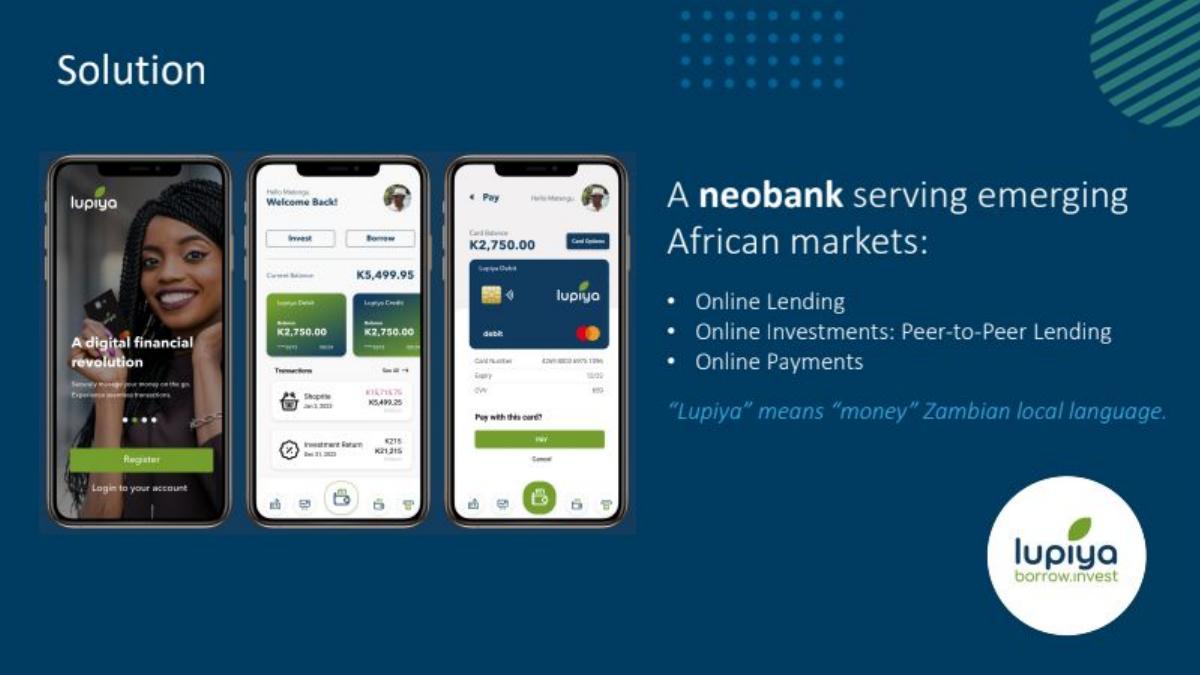
Lupiya defines its solution as a neobank serving emerging African markets through three pillars: Online Lending, Online Investments (P2P), and Online Payments. The slide includes mobile app mockups showing a clean UI with 'Invest' and 'Borrow' buttons. A small but culturally relevant note explains that 'Lupiya' means 'money' in a local Zambian language, adding a layer of brand identity that resonates with the target market.
Slide 4: Market Size
The market sizing slide follows the TAM/SAM/SOM structure. The TAM is $108bn (Africa), the SAM is $25bn (Zambia, Tanzania, Malawi), and the SOM is $140mn (Zambia). While the jump from a $25bn SAM to a $140mn SOM seems conservative, it suggests the founders have a realistic grasp of their immediate capture capabilities within their primary jurisdiction.
Slide 5: Business Model
This slide is refreshingly transparent about unit economics. Lupiya breaks down revenue into three buckets:
Lending: 10% Service Fee and 8% Interest. · P2P Investments: 1% Service Fee and 0.25% Tenure Fee. · Payments: 1.7% for Local Transactions and 6.9% for International.
This level of detail allows investors to quickly model potential returns based on the transaction volumes mentioned later in the deck.
Slide 6: Competition
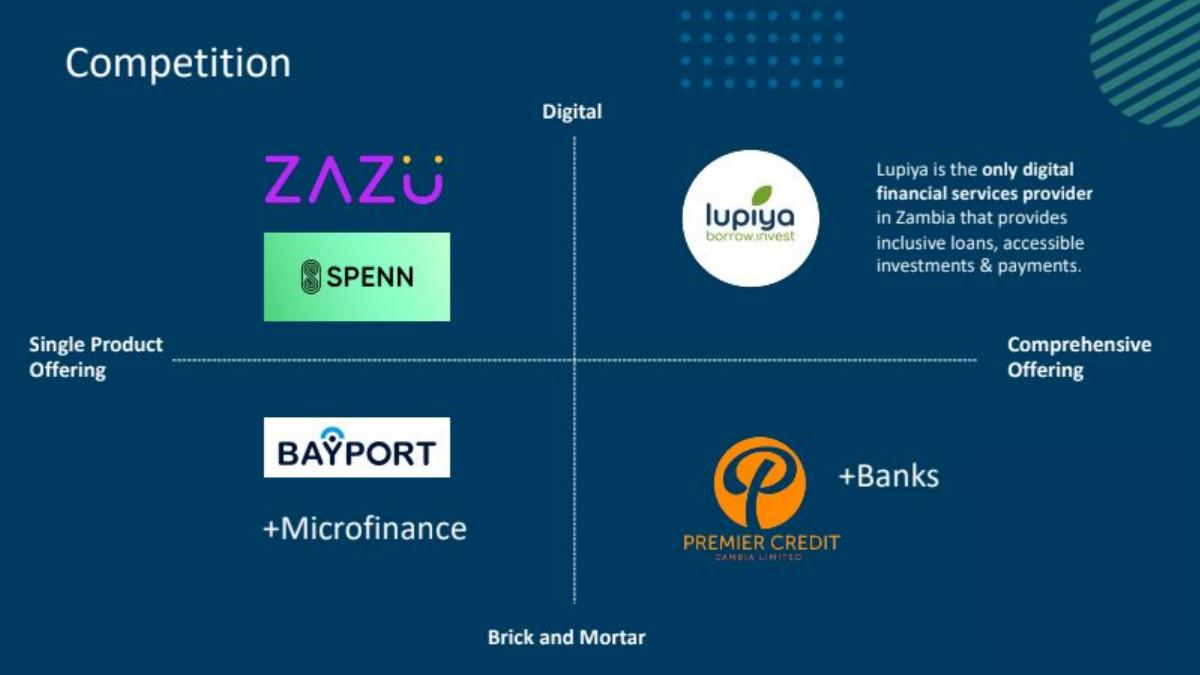
The competition matrix uses two axes: Single Product vs. Comprehensive Offering, and Brick and Mortar vs. Digital. Lupiya places itself in the top-right quadrant (Digital + Comprehensive). They name specific competitors like Zazu and Spenn (Digital/Single Product) and Bayport (Brick and Mortar/Microfinance). The slide explicitly claims Lupiya is the 'only digital financial services provider in Zambia' offering this specific mix of products.
Slide 7: Traction
This is the 'money slide' of the deck. It uses five circles to highlight Year-Over-Year (YOY) growth:
ARR: 598% · Loan Book: 437% · Customers: 120% · EBITDA: 1500% · Net Income: 137%
The slide also reiterates the awards mentioned on the cover and adds a 'Partnerships & Coverage' section featuring AWS, CNN, and The World Bank. The 1500% EBITDA growth is particularly striking for a Series A company, suggesting a highly scalable operational model.
Slide 8: Our Team
The team slide highlights the Co-founders, Evelyn Kaingu (CEO) and Muchu Kaingu (CTO), along with the Head of Finance. It lists their years of experience (10-15 years) and relevant degrees. The bottom of the slide features a bold statement on diversity: 'Inclusive Team: Female-run, 60% Female Employees, 66% Female Management.' This is a strategic inclusion, especially when pitching to funds with a mandate for social impact or gender equality.
Slide 9: Our Ask
The ask is clearly stated as USD 10 million . A donut chart breaks down the use of funds: 35% Operations, 33% Technology, 25% Sales & Marketing, and 7% CAPEX. Crucially, a second chart shows that 75% of the round is already committed . This is a powerful closing tactic, as it signals to the investor that the deal is moving fast and has already been de-risked by other capital.
Slide 10: Q&A
The final slide is a standard Q&A placeholder featuring a photo of the broader team in Lupiya-branded hoodies. It provides contact information for the CEO, Evelyn Kaingu, including her email and the company website. This reinforces the 'human' element of the business after several slides of dense metrics.
What Works in This Deck
Clarity of Revenue: Many fintech decks hide their actual fees behind vague terms like 'monetization through data.' Lupiya is blunt about their 10% fees and 8% interest rates. This transparency builds trust.
Momentum: The traction slide (Slide 7) is undeniable. When a company shows nearly 600% ARR growth, the specific mechanics of the product become secondary to the fact that the market is clearly demanding the service.
Gender-Lens Positioning: By highlighting their 66% female management team, Lupiya aligns itself with a growing segment of VCs (like Alitheia IDF) who are specifically looking to fund female-led enterprises in Africa.
What is Missing
Product Roadmap: The deck explains what they do now, but not what they will do next. There is no mention of future features, geographic expansion plans beyond the SAM slide, or how the technology will evolve with the 33% budget allocation.
Risk Mitigation: In the context of African microfinance, credit risk and currency fluctuation are massive hurdles. The deck does not mention their NPL (Non-Performing Loan) ratio or how they handle the volatility of the Zambian Kwacha.
Unit Economics Detail: While we see the revenue per transaction, we don't see the Customer Acquisition Cost (CAC) or Lifetime Value (LTV). For a neobank, these are the metrics that determine long-term viability.
What Founders Should Copy
The 'Committed' Chart: If you have 50% or more of your round committed, put it in the deck. It is the single most effective way to create FOMO (Fear Of Missing Out) and accelerate the closing process.
The Problem/Solution Alignment: Slide 2 and Slide 3 mirror each other perfectly. The problem is '3-week processing'; the solution is 'Online Lending.' The problem is 'marginalized women'; the solution is an 'Inclusive Team.' This narrative symmetry makes the deck easy to digest.
Source Everything: By citing the World Bank, KPMG, and Statista, Lupiya ensures that an investor won't spend the meeting arguing about whether the market is actually $108bn. They've outsourced the credibility of their data to global institutions.
Frequently asked questions
- What is Lupiya's core business model?
- Lupiya operates as a neobank with three primary revenue drivers. They earn through lending (a 10% service fee and 8% interest), peer-to-peer investment management (1% service fee and 0.25% tenure fee), and transaction processing for payments (1.7% for local and 6.9% for international transactions). This multi-pronged approach allows them to capture value across the entire financial lifecycle of their users.
- How does Lupiya differentiate itself from competitors?
- According to their competition matrix on slide 6, Lupiya positions itself as the only provider in Zambia offering a 'comprehensive' digital service. While competitors like Zazu or Spenn are categorized as 'single product' digital offerings, and traditional banks are 'brick and mortar,' Lupiya claims the top-right quadrant by combining digital delivery with a full suite of loans, investments, and payments.
- What specific market figures does the deck use?
- The deck uses a standard TAM/SAM/SOM framework. It identifies a Total Addressable Market of $108 billion per annum for Africa, a Serviceable Addressable Market of $25 billion covering Zambia, Tanzania, and Malawi, and a Serviceable Obtainable Market of $140 million specifically for their home market of Zambia. These figures are attributed to sources like the World Bank and Statista.
- Why is the team slide significant in this deck?
- The team slide is notable for two reasons: experience and diversity. It highlights co-founders with 10-15 years of experience in banking and software engineering. More importantly, it explicitly markets their 'Inclusive Team' status, noting they are female-run with 66% female management. This likely appealed strongly to their lead investor, Alitheia IDF Fund, which focuses on gender-lens investing.
- What was the fundraising status at the time of the deck?
- Slide 9 shows that Lupiya was seeking $10 million in equity. At the point of presentation, the 'Fundraising Progress' chart indicated that 75% of the round was already committed, leaving only 25% as 'pending.' This creates a sense of urgency and validation for new investors, showing that the round is nearly closed and already vetted by others.