How fintech startups show how they make money: fee rates, interchange, interest margin and subscriptions, and the volume each rate applies to.
Fintech Business Model Slide: Rates, Revenue Lines and What They Apply To
A fintech usually earns a small percentage of something much larger: a share of each card payment, a fee on a loan, the gap between what it earns on money lent and what that money costs. A rate means little until the reader knows what it applies to and what it costs to deliver. This guide compares eight real fintech business model slides on that question: does the slide give each revenue line a rate, the base the rate applies to, and the cost that comes out of it?
TL;DR
List each revenue line, give its rate, and say what the rate is charged on and who pays it. Lupiya is the only slide here that gives a rate for every line (lending, peer-to-peer investing, payments), though it doesn't say whether the 8% interest is monthly or annual or what volume the rates apply to. StudentFinance is the only one to show the cost side: it compares its ratio of interest income to interest expense (3.48x) with Affirm, Klarna and Afterpay and shows how the ratio changes with its cost of funding. Clutch gives a swap fee range. WageFi, Fundid and ImaliPay name revenue types (interchange, subscription, transaction fees) with no rates, Plum shows an order of revenue with no figures, and Maybe describes its pricing principle without a price.
Fintech business model slides from real pitch decks
Each example shows the slide above its analysis and links to the full teardown. Slides that give rates, bases or costs come first. Claims are as shown on the slides; checks and comments are ours.
Lupiya business model slide — slide 5
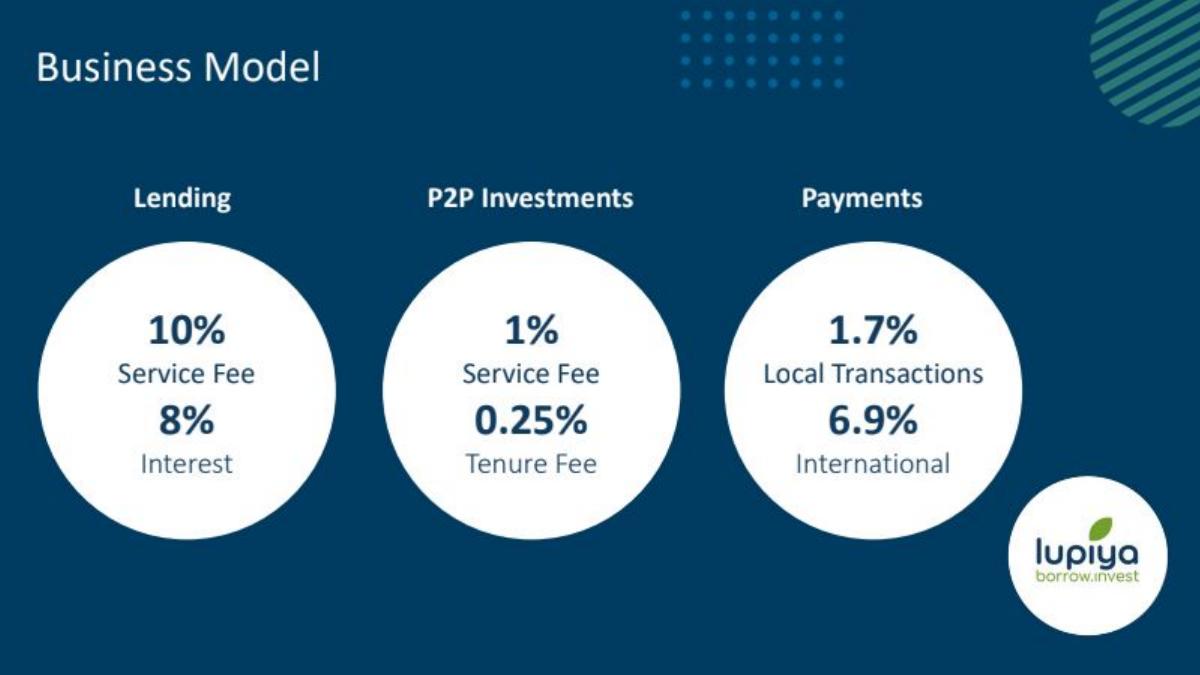
Lending, investing and payments app in Zambia and neighbouring markets (from the deck's market slide). Three circles, one per product.
Lupiya deck, slide 5. Exact stored slide matched to this analysis.
Our analysis: Three products, each with its own pricing. The payments rates look like a share of transaction value; that is our reading, not stated.
Evidence and limitation: Every revenue line has a rate. The slide does not say what each rate is charged on (loan principal, amount invested, payment value), the period for the 8% interest or the 0.25% tenure fee, or who pays each fee. No volumes, so the reader can't estimate which line matters most.
What a founder can adapt: Add the base, period and payer to each rate, and one volume: "Lending: 10% service fee on principal, 8% interest [per month or per year]; [loan volume] in [period]."
Supporting analysis
What the deck claims: "Business Model." Lending: "10% Service Fee", "8% Interest". P2P Investments: "1% Service Fee", "0.25% Tenure Fee". Payments: "1.7% Local Transactions", "6.9% International".
Presentation choice: It is the only slide in this set that gives a number for every line, which lets an investor start asking the right questions.
When it does not fit: An interest rate without a period can be read as monthly or annual, which changes it by a factor of about twelve.
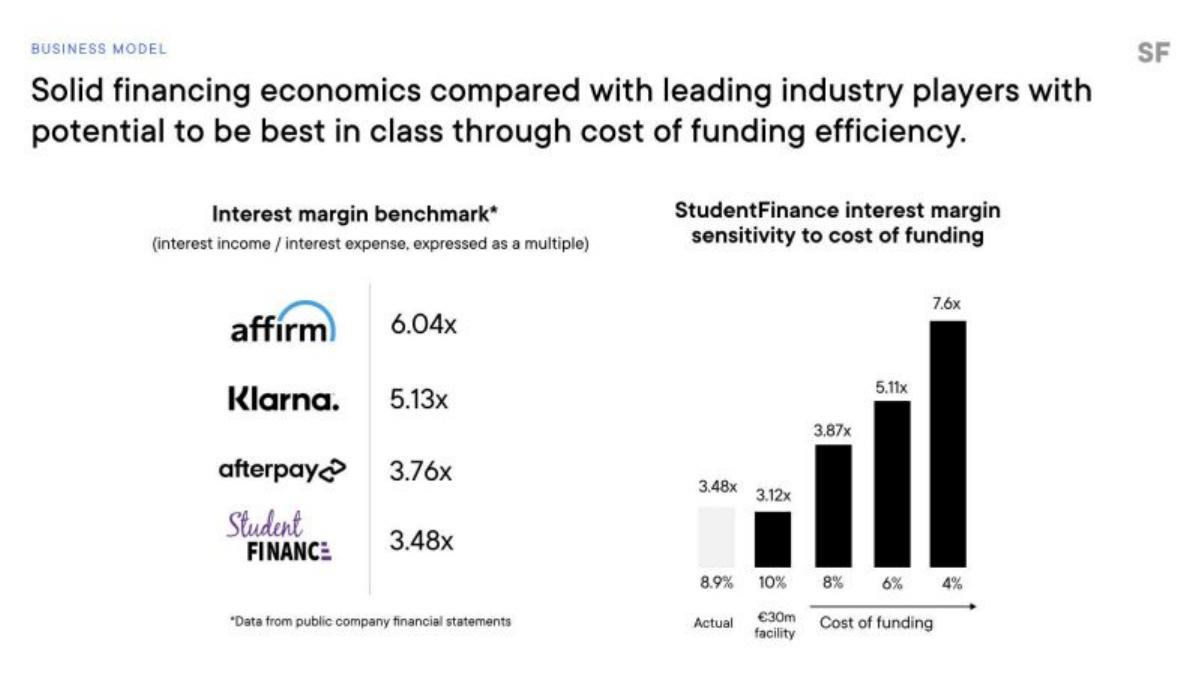
Education financing for students. A benchmark table and a sensitivity chart.
StudentFinance deck, slide 9. Exact stored slide matched to this analysis.
Our analysis: The slide's argument is that the company's economics depend on cost of funding, and that cheaper funding would lift its ratio above the benchmarks. The higher bars are conditional illustrations at lower funding costs, not results.
Evidence and limitation: The slide defines its measure, which most slides here don't. It is a ratio of interest income to interest expense, not the net interest margin banks report (net interest income divided by interest-earning assets), so it can't be compared with published bank margins. No period is given for the benchmark figures, and Klarna was privately held, so its figure would come from its own published annual reports rather than public-company filings. StudentFinance ranks last of the four on its own chart. Our check: if interest income is held constant, the ratio scales with 1 ÷ cost of funding: 3.48 × 8.9 ÷ 8 ≈ 3.87 (matches), ÷ 10 ≈ 3.10 (slide 3.12), ÷ 6 ≈ 5.16 (slide 5.11), ÷ 4 ≈ 7.74 (slide 7.6). The chart looks broadly like that calculation; the small differences are not explained.
What a founder can adapt: Keep the sensitivity chart. Add the period, the source filing for each benchmark company, and the net interest margin alongside your own ratio: "Net interest margin [X]% in [period]; income/expense ratio [Y]x."
Supporting analysis
What the deck claims: "Solid financing economics compared with leading industry players with potential to be best in class through cost of funding efficiency." "Interest margin benchmark* (interest income / interest expense, expressed as a multiple)": Affirm 6.04x, Klarna 5.13x, Afterpay 3.76x, StudentFinance 3.48x. "*Data from public company financial statements." Sensitivity chart: 3.48x at 8.9% ("Actual"), 3.12x at 10% ("€30m facility"), then 3.87x at 8%, 5.11x at 6%, 7.6x at 4% ("Cost of funding").
Presentation choice: It is the only slide in this set to show the cost side of a lending model, and it makes the funding dependency explicit.
When it does not fit: A headline of "solid economics" beside a chart where you rank last invites the question. Lead with the funding plan that moves the bar, and say the "€30m facility" lowers the ratio.
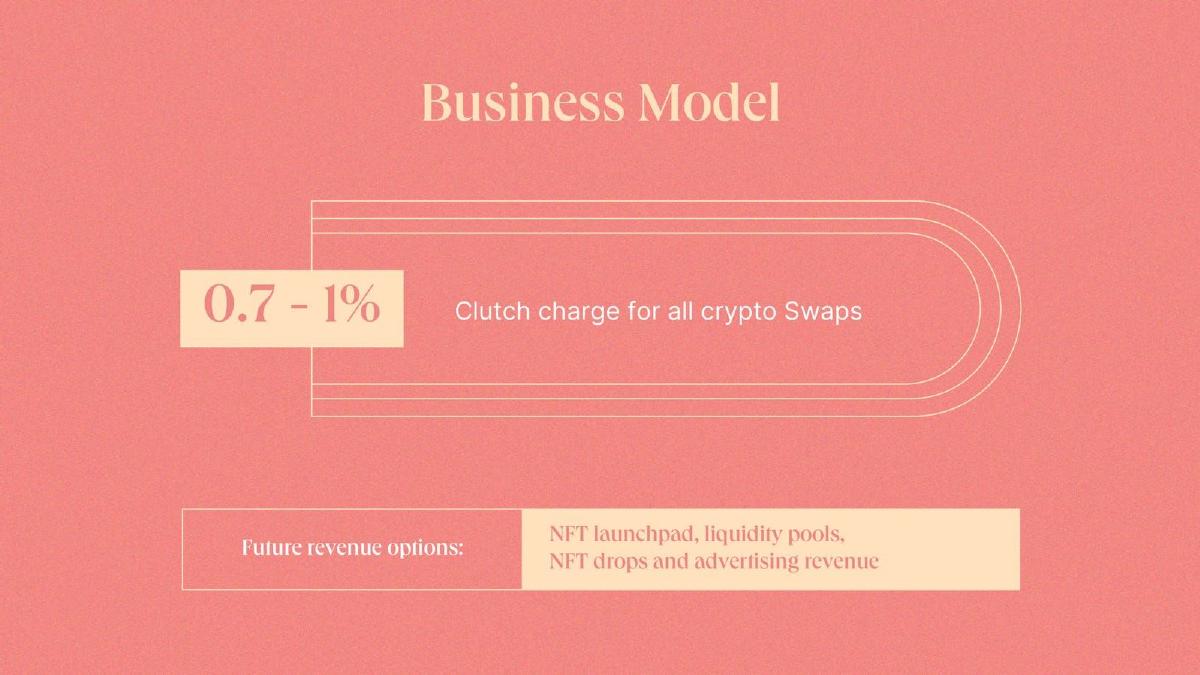
Crypto wallet app. One rate and a list of future revenue options.
Clutch deck, slide 16. Exact stored slide matched to this analysis.
Our analysis: A transaction-fee model on one action (swaps), with other lines listed as possibilities.
Evidence and limitation: One revenue line with a rate range. The slide does not say what sets the rate within the range, what the fee is charged on (presumably swap value), what the company pays to swap providers or networks, or any swap volume. Future options are clearly separated from the live line.
What a founder can adapt: Add what the fee applies to and what's left after costs: "0.7–1% of swap value, depending on [size or asset]; after provider costs, [X]% retained."
Supporting analysis
What the deck claims: "Business Model." "0.7 - 1% Clutch charge for all crypto Swaps." "Future revenue options: NFT launchpad, liquidity pools, NFT drops and advertising revenue."
Presentation choice: The live line is stated with a number and the future lines are labelled as future, so a reader can't mistake one for the other.
When it does not fit: A range without the rule that picks the rate. Four future options on a one-product slide can suggest the main line isn't enough.
Fundid deck, slide 7. Exact stored slide matched to this analysis.
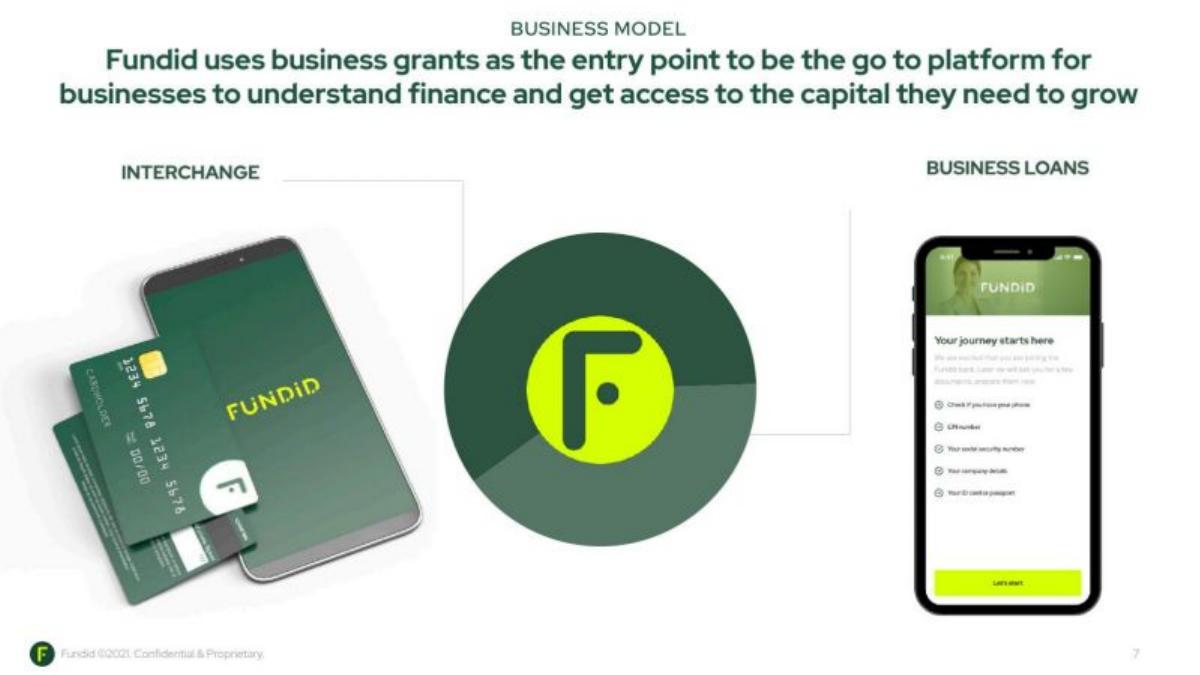
Our analysis: A sequence: attract businesses with grants, earn interchange on card spending, then lend. The order is our reading of the headline, not a stated plan.
Evidence and limitation: Two revenue lines named, no rates, no volumes. The grants entry point is described but the slide doesn't say whether grants earn revenue. No issuing bank or card type, which decides what interchange a card can earn.
What a founder can adapt: Put a figure on each line: "Interchange: [X]% of card spend through [issuing bank]; business loans: [rate] on [average loan]." Say if grants are free.
Supporting analysis
What the deck claims: "Business Model." "Fundid uses business grants as the entry point to be the go to platform for businesses to understand finance and get access to the capital they need to grow." Left: a card and phone labelled "Interchange". Right: a phone onboarding screen labelled "Business Loans".
Presentation choice: The headline explains how customers arrive and names two revenue lines, which is more than a list of revenue types.
When it does not fit: Naming interchange without card type or issuing bank; interchange rates vary a lot between card types, and in the US large issuers' debit rates are capped.
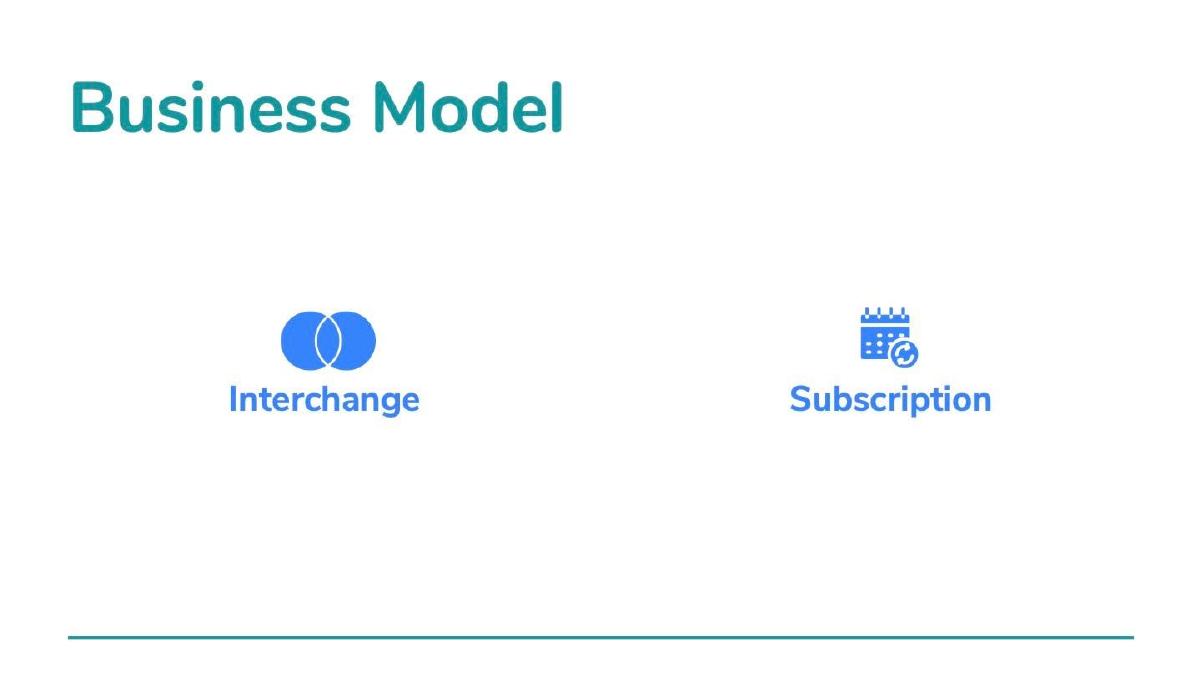
An alternative to payday loans and overdrafts (from the deck's preceding market slide). Two icons.
WageFi deck, slide 10. Exact stored slide matched to this analysis.
Our analysis: Card interchange plus a subscription, which suggests the company plans to issue a card and charge a membership fee. That is our reading of two labels.
Evidence and limitation: Two revenue types with no rates, prices, payer or base. The preceding slide sizes the market by payday loan and overdraft fees, but this slide does not say how WageFi's revenue relates to those fees.
What a founder can adapt: Turn each label into a line: "Subscription [$X] a month; interchange [X]% of card spend through [bank]; expected revenue per user [$Y] a year."
Supporting analysis
What the deck claims: "Business Model." Two icons labelled "Interchange" and "Subscription".
Presentation choice: It's short, and it does name two lines. It is included because it shows the most common gap in fintech business model slides.
When it does not fit: Labels without numbers leave the investor to guess the whole model.
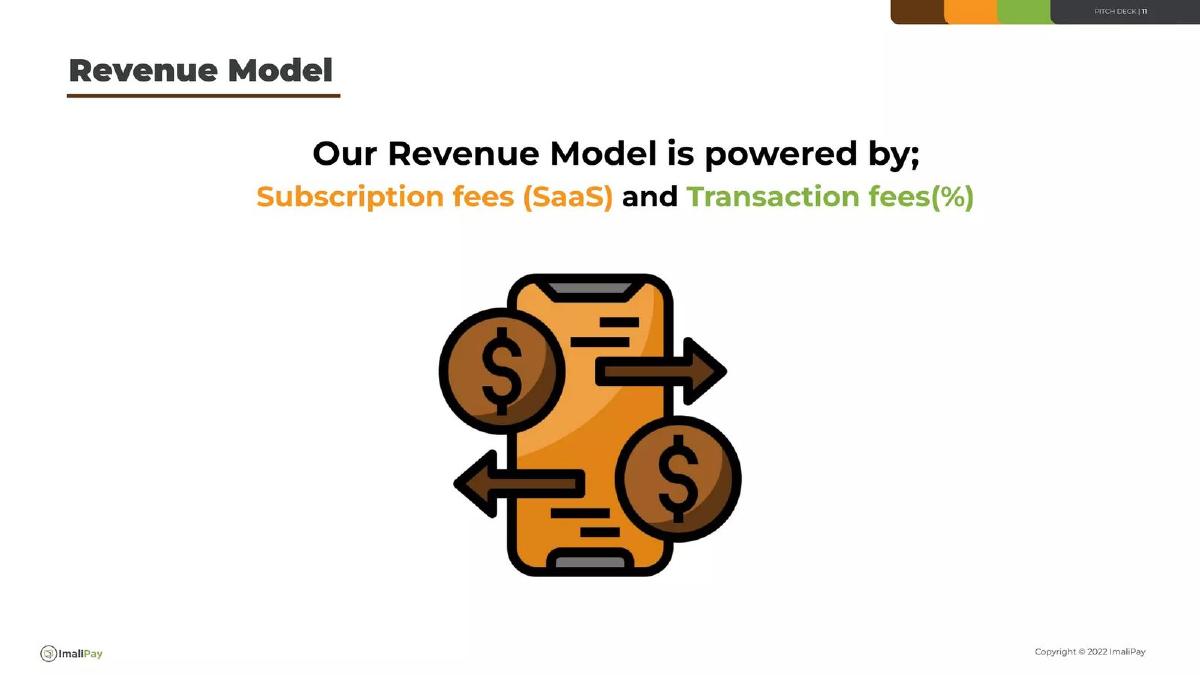
ImaliPay deck, slide 11. Exact stored slide matched to this analysis.
Our analysis: A B2B subscription for partners using the API plus a per-transaction percentage, based on the previous slide. Who pays which is not stated.
Evidence and limitation: Two revenue types; the transaction fee is marked as a percentage but no rate is given. The slide doesn't say who pays the subscription (platforms, lenders or workers).
What a founder can adapt: "[Partner type] pays [$X] a month for API access plus [X]% of each transaction; [N] partners live."
Supporting analysis
What the deck claims: "Revenue Model." "Our Revenue Model is powered by; Subscription fees (SaaS) and Transaction fees(%)."
Presentation choice: It separates recurring from usage-based revenue, which is the right split for an infrastructure product.
When it does not fit: A percentage sign without the percentage.
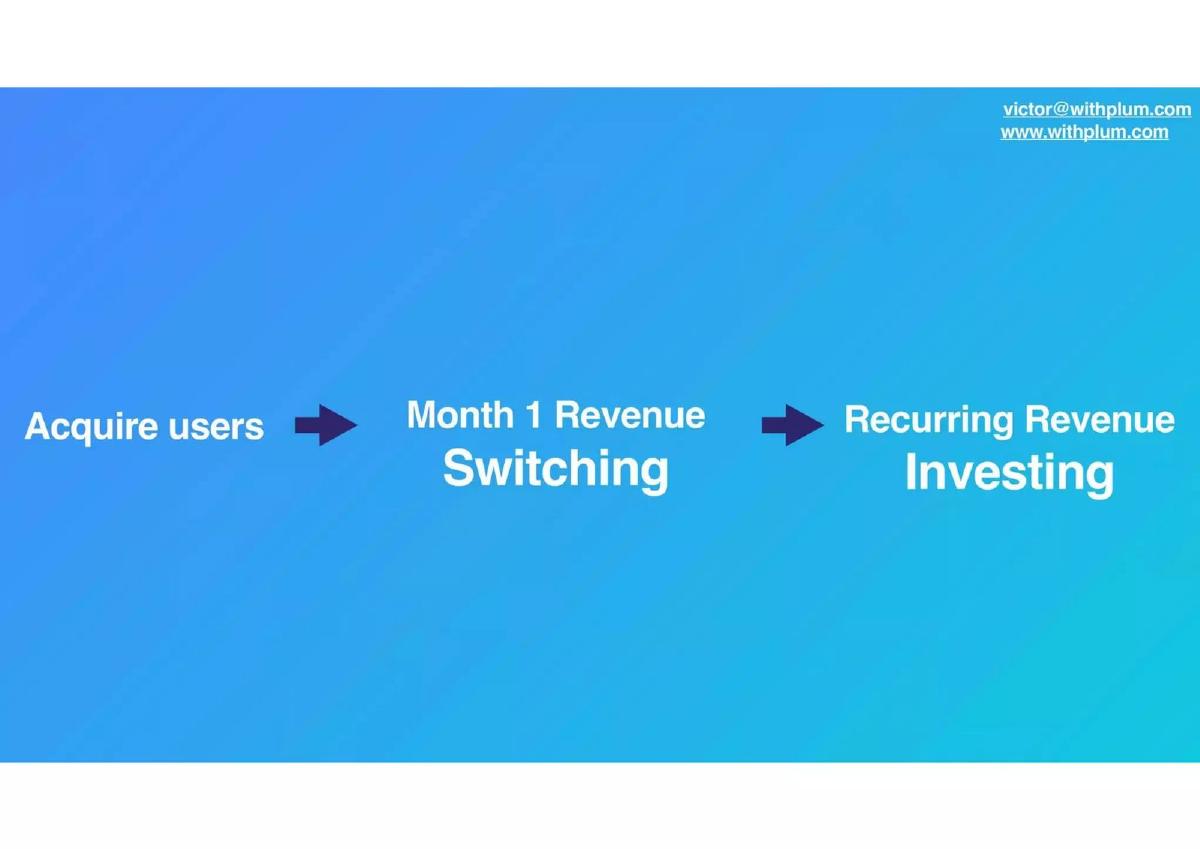
Automated savings and investing app. The slide before claims "20% MoM user growth" and "50% MoM in Savings".
Plum deck, slide 8. Exact stored slide matched to this analysis.
Our analysis: Early one-off revenue that could offset acquisition cost, followed by recurring revenue from investing. A reasonable structure; the numbers that would support it are missing.
Evidence and limitation: An order of revenue with no figures. The slide does not say what "switching" means (for example, a referral fee when a user switches a utility or bank), how much each switch earns, or how investing revenue is charged.
What a founder can adapt: Add a figure to each arrow: "Switching: [$X] per switch, [Y]% of users in month 1; Investing: [fee]% of balances a year."
Supporting analysis
What the deck claims: "Acquire users" → "Month 1 Revenue: Switching" → "Recurring Revenue: Investing".
Presentation choice: It separates revenue that arrives in month one from revenue that recurs, which matters for payback.
When it does not fit: Arrows that imply payback without saying what each step earns.
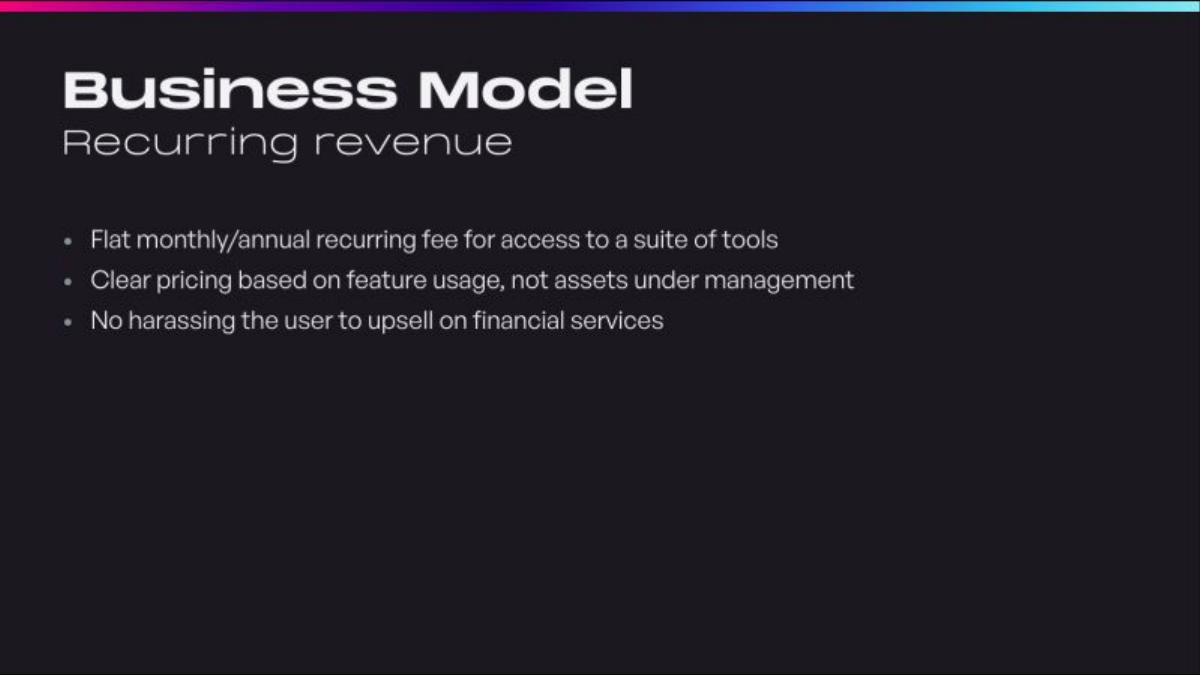
Maybe deck, slide 7. Exact stored slide matched to this analysis.
Our analysis: A positioning choice against advisers who charge a share of assets and apps that earn from selling products. The trade-off is that revenue doesn't grow with a user's wealth.
Evidence and limitation: It says what the company won't do (charge on assets, sell financial products) but gives no price. "Flat" fee and pricing "based on feature usage" point in different directions, and the slide doesn't reconcile them.
What a founder can adapt: Add the price and the trade-off: "[$X] a month or [$Y] a year; [Z]% of trial users convert."
Supporting analysis
What the deck claims: "Business Model. Recurring revenue." "Flat monthly/annual recurring fee for access to a suite of tools." "Clear pricing based on feature usage, not assets under management." "No harassing the user to upsell on financial services."
Presentation choice: Stating what you don't charge is useful in finance, where users are wary of hidden fees.
When it does not fit: A pricing principle without a price.
Whether each slide gives rates, the base they apply to, and the cost side.
Example
Revenue lines
Rates given
Base and period
Cost side
Lupiya
Lending, P2P, payments
Yes, every line
Not stated
No
StudentFinance
Lending
Ratio only (defined)
Cost of funding stated; benchmark period not stated
Yes (sensitivity)
Clutch
Swap fee (+ future)
Range
Not stated
No
Fundid
Interchange, loans
No
No
No
WageFi
Interchange, subscription
No
No
No
ImaliPay
Subscription, transaction %
No
No
No
Plum
Switching, investing
No
Order only
No
Maybe
Subscription
No
Monthly or annual
No
Key Takeaways
Give every revenue line a rate, the base it applies to, and who pays it.
Say the period for any interest rate: per month, per year or per loan.
Interchange is a share of card payment value that is set by the card networks and, for some US debit cards, capped by regulation; say which cards you issue and your expected share.
For lending, show the cost of funds next to the income; the spread is the business.
Label future revenue lines as future and keep them off the main line.
Define any ratio you benchmark, and give the period and source for each comparison company.
Build your fintech business model slide
One row per revenue line.
Line. What do you charge for: payments, card spend, loans, swaps, access?
Rate and base. What rate, on what amount (payment value, principal, balance), and over what period?
Payer. Who pays: the user, the merchant, a partner, the card network via interchange?
Cost. What comes out before you keep it: provider fees, network fees, cost of funds, expected losses?
Volume. What volume does the rate apply to today, over what period?
Copyable framework: [Line]: [rate] of [base] per [period], paid by [payer]. After [costs], we keep [X]. Volume: [amount] in [period].
Illustrative example 1 — written by us
Before: Business model: interchange and subscription.
After: Card: we receive [X]% of card spend from [issuing bank]; members spend [$Y] a month. Subscription: [$Z] a month, paid by [share] of members.
What improved: Our illustrative rewrite; bracketed figures are placeholders, not company facts. It gives each line a rate, base and payer.
What this guide adds
The general business model guide covers how any startup shows who pays, for what and how much. The SaaS and marketplace business model guides cover subscriptions and commissions. This guide covers what is specific to financial products: revenue that is a small rate on a large flow of money, and, for lending, a cost of money that has to come out of it. The fintech product, traction and market guides cover other slides in fintech decks.
Four common fintech revenue lines and what each needs
Transaction fee: a percentage or fixed amount per payment, swap or transfer. Needs the rate, the value it applies to, and the provider costs that come out of it.
Interchange: the fee a merchant's bank pays the bank that issued the card, a share of each card payment. Fintechs that issue cards through a partner bank usually receive part of it. The rate is set by the card networks, not the startup, and in the US, debit interchange for issuers with $10 billion or more in assets is capped under the Federal Reserve's Regulation II; smaller issuers are exempt from the cap. A slide should say what kind of card, who the issuing bank is, and what share of interchange the company expects.
Interest and lending fees: income on money lent, less the cost of the money. Banks describe this with net interest margin (net interest income divided by interest-earning assets). A startup can use a different measure, but should define it.
We quote the text on the slide images and describe charts from what is drawn. We have not checked company rates or claims. None of these slides was in our stored image set, so we rendered each one from the original deck file in our library; the pages shown are the ones quoted. Where we recalculate a figure, we show the inputs.
Common mistakes
Revenue types with no rates. "Interchange" or "transaction fees" alone can't be evaluated.
Rates with no base. Say whether a percentage is of payment value, principal or balance.
Interest with no period. Monthly and annual rates differ by about twelve times.
No cost side for lending. Show cost of funds and expected losses next to income.
Undefined benchmark ratios. Define the measure and give each comparison company's period and source.
Future lines mixed with live ones. Label what earns today and what is planned.
Diagnostic checklist
Every revenue line has a rate.
Each rate says what it applies to and over what period.
The payer for each line is named.
Costs that come out of each rate are shown or noted.
Future revenue lines are labelled as future.
Frequently asked questions
How do fintech startups make money?
Usually through a rate on a flow of money: transaction fees, a share of card interchange, interest and lending fees, or a subscription. A business model slide should give each line's rate, what it applies to and who pays.
Should I show interchange revenue on my business model slide?
Only with the card type, issuing bank and the share you expect to receive. Interchange rates are set by card networks, and in the US, debit interchange for large issuers is capped under Regulation II. (Federal Reserve Board)
How we chose these examples
Corpus: published pitch deck teardowns on StartupFundraising.com. Founder-uploaded private decks are excluded.
Selection (2026-09-26): we searched teardown text for business model or revenue model slides in decks mentioning fintech, payments, banking, lending or cards together with interchange, take rate, basis points, per-transaction fees, spread or float. About 60 teardowns matched; many were not fintech. We inspected 36 rendered pages (the named slide and its neighbours) from 12 fintech decks.
Kept eight. Excluded: Exeq p11 (data monetisation, not a financial revenue line), FuelFinance p6 (already used in the gross-margin and financials guides for the same figures), Ramp p6 (forecasting software, not a fintech revenue model), Productfy p15 (cover of a different section).
None of the chosen pages was in our stored image set; we rendered them from the original deck PDFs in our library and stored them with the existing slide-image workflow. Plum's page is portrait-cropped as in the original file.
Review: slide images were checked on 2026-09-26 and matched to company, deck and page (editorial model review). No person has yet completed an editorial review of this page. We make no claim that any slide caused a fundraising outcome.