NewLegends Studios was an Israeli mobile games studio raising a seed round in Q3/Q4 2014 to build Forest Tribes: Rise of Heroes, a competitive turn-based strategy game designed to be streamed and watched — a mobile eSports bet placed years before the category existed. Founder Ohad Barzilay published the 50-page 'reading' version of the deck in June 2015 as a giveaway to other founders, complete with an opening notes slide explaining what he would change. Pages 1 to 16 are the pitch; pages 17 to 50 are an appendix of Mary Meeker, NewZoo, Digi-Capital, InMobi and Kabam research more than twice…
Key takeaways
- NewLegends Studios' 2014 seed deck is a 50-page 'reading deck' released publicly by its own founder: 16 pitch slides followed by 34 pages of market-research appendix, more than twice the length of the pitch itself.
- The slide titled 'Now Raising' contains a use-of-funds pie (salaries 48%, marketing 36%, others 16%) and no amount, no valuation, no instrument and no runway — the only funding figure anywhere is a $2M growth round assumed for Q3 2016.
- Slide 5 compares Twitch's 780K viewers against MTV, MSNBC, E! and CNN under the label 'average prime time viewers', but page 20 of the deck's own appendix reproduces the original New York Times chart, which plots Twitch's peak against cable's average.
- The 'Financial Projection' slide lists twelve quarters of revenue to the dollar ($123,222 rising to $8,154,687) with no cost line, no net and no cash balance — yet the next slide claims break-even in Q4 2015.
- Every assumption moves favourably at once: eCPI rises 2.3x from $1.50 to $3.50 while ARPDAU rises 3.5x and stickiness rises 2.25x, the opposite of how monetisation and retention behave as you scale into more expensive traffic.
- The team's strongest credential — four people who ran games together for 3+ years generating ~$1M monthly revenue at Mytopia, acquired by 888 — is the third sub-bullet on the team slide rather than the headline.
- Slide 9's watchability rubric (seven design traits mapped to seven performance outcomes) is the best-constructed slide in the deck and the format most worth copying, but its economic claim of lower UA costs is contradicted by the deck's own rising eCPI assumption.
- The appendix's best evidence — Digi-Capital's finding that PvP-and-PvE games earn 13x the ARPU of single-player — sits on page 34, thirty pages after the slide that needed it and long after the ask.
What this deck actually is
Fifty pages, 1024 x 768 points — 4:3 , built in PowerPoint, run through Acrobat PDFMaker 11 and exported on 22 June 2015 at 20:14 UTC . The PDF title field says "Reading Deck" . The author field says civax . The filename ends in full4publish , and that word is the key to the whole document: this deck was deliberately released to the public by its own founder after the round, as a giveaway to other entrepreneurs.
NewLegends Studios was an Israeli mobile games studio raising a seed round in Q3/Q4 2014 to build Forest Tribes: Rise of Heroes — a free-to-play, cross-platform, turn-based competitive strategy game the deck describes as "Clash of Clans meets Hearthstone." The pitch underneath it is a market-timing bet: competitive games are becoming spectator entertainment, all of the watched titles are on PC, mobile is the better platform for streaming, and whoever builds the first genuinely watchable mobile game catches both waves at once. In 2014, before the word had settled, they called this category "watchable games" rather than eSports, and slide 2 explains why: investors did not know the term and "understood it completely wrong initially."
Structurally this is two documents stapled together. Pages 1 to 16 are the deck. Pages 17 to 50 are an appendix titled "Extra Slides" — thirty-four pages of market research pulled from Mary Meeker's 2014 Internet Trends report, NewZoo, Digi-Capital, InMobi, Kabam, Flurry, Mixpanel and Distimo. The appendix is more than twice the length of the pitch. That ratio is the most instructive thing about this file, and not in the way the founder intended.
Two more things make it unusual. First, it is a "reading" deck — slide 2 states plainly that the version used in meetings "had much less text and some slides were removed / different." So we are analysing the long-form version, which is the fairer thing to judge on paper. Second, it is self-annotated . Slide 2 is a set of notes from the founder to future readers, including an email address for anyone who wants the PowerPoint or wants to buy him a coffee. I have torn down forty-odd decks in this series and this is the first one that opens by telling you its own limitations.
Slide-by-slide walkthrough
Slide 1 — Cover
Two illustrated characters — a bear warrior on the left, an archer on the right — flanking the NewLegends Studios logo, over the line "Competitive Mobile Games that are fun to watch, fun to play." No date, no round name, no confidentiality mark, no contact details.
The tagline is doing real work. It is nine words, it contains the product category, the differentiator and the thesis, and it is falsifiable — you can look at their game and decide whether it is fun to watch. Most cover slides in this library say something like "the future of X." This one says what they make and what is unusual about it. The art is also genuine studio art rather than stock, which for a games company is itself a credential: it is the first proof that the team can produce.
What is missing is the anchor. There is no month or year anywhere on the cover, and the deck is full of time-sensitive claims dated to specific 2014 events. A reader opening this file in 2015 — which is when it was published — has no way to know from the cover that the data is already six to nine months old.
Slide 2 — Notes
Six bullets of authorial commentary: this is the reading deck; the meeting version had less text; the Extra Slides section is imported from the presentation version and holds the data investors asked about; the deck was used around Q3/Q4 2014 so "there should be more accurate/up to date data out there by now"; they used "watchable games" instead of "eSports" deliberately; and they got help from the community and are releasing this to give back.
This slide was not in the deck investors saw. It is a release note. But it is worth reading closely because it tells you what the founder himself thought the deck's weak points were: staleness of data and terminology risk . He was right on both, and as we will see, he was not conservative enough about either.
Slide 3 — Veteran Team
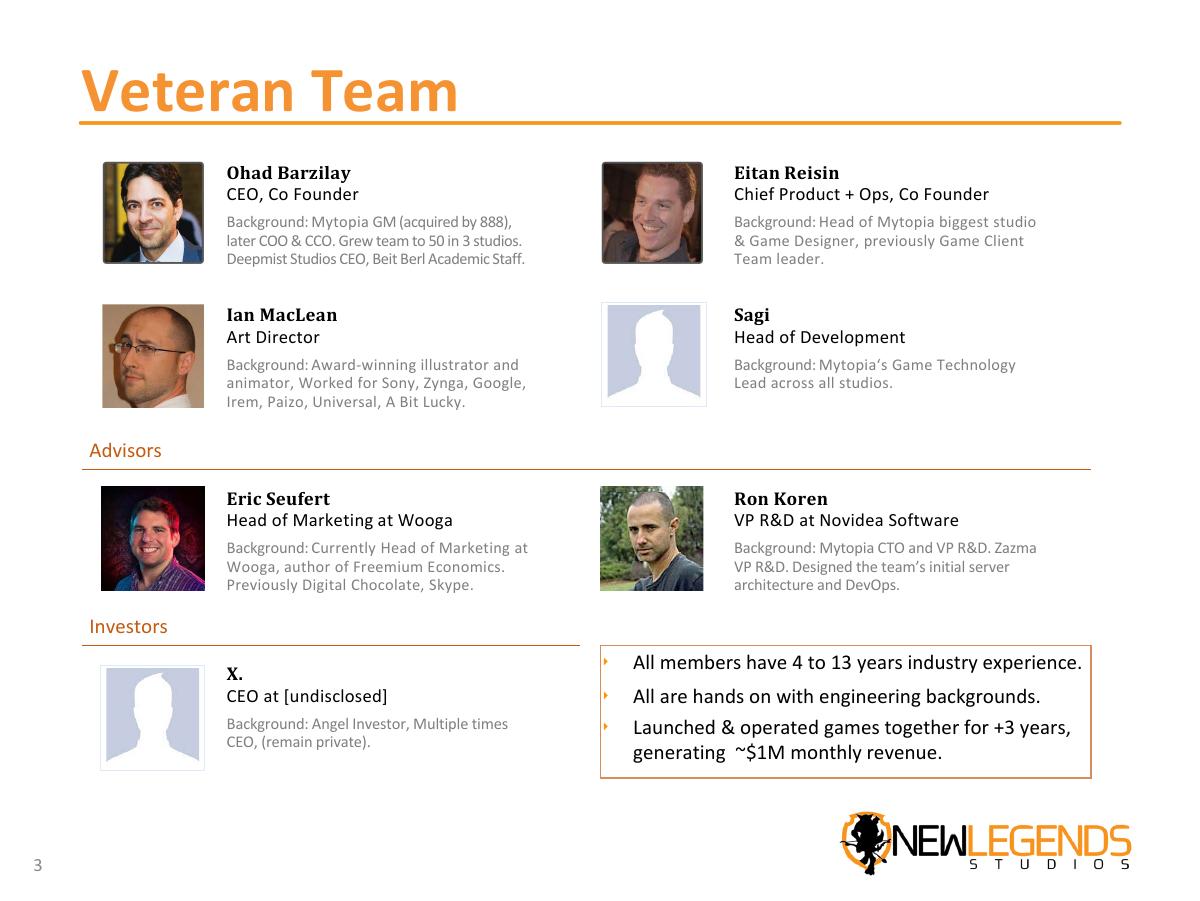
Four people with photos: Ohad Barzilay (CEO, co-founder; ex-GM of Mytopia, acquired by 888, later COO and CCO; grew the team to 50 across three studios; CEO of Deepmist Studios; academic staff at Beit Berl), Eitan Reisin (Chief Product + Ops, co-founder; head of Mytopia's biggest studio and game designer), Ian MacLean (Art Director; award-winning illustrator and animator, worked for Sony, Zynga, Google, Irem, Paizo, Universal, A Bit Lucky) and Sagi (Head of Development; Mytopia's game technology lead across all studios). Below them, two advisors — Eric Seufert , then head of marketing at Wooga and author of Freemium Economics , and Ron Koren , VP R&D at Novidea and former Mytopia CTO — and one investor slot occupied by "X., CEO at [undisclosed], Angel Investor, multiple times CEO, (remain private)."
Three closing bullets carry the actual argument: all members have 4 to 13 years of industry experience; all are hands-on with engineering backgrounds; and they "launched & operated games together for +3 years, generating ~$1M monthly revenue."
That last line is the strongest sentence in the deck and it is buried as the third sub-bullet of a team slide. A team that has already run a portfolio at $1M a month together, at a company that got acquired, is the entire reason to take a pre-product games seed seriously. It should be a headline, with the studio named, the period stated and the revenue attributed — is that $1M across all Mytopia titles, or the titles this specific team ran? The deck never says.
Two smaller problems. "Sagi" appears with no surname on a slide where everyone else has a full name — for a head of development, that reads as an oversight rather than privacy. And the investor tile shows a placeholder headshot labelled "X." Listing an undisclosed angel with a redacted identity does not add credibility; it invites the reader to wonder why the name is being withheld, and it makes a five-person slide look like it has a hole in it.
Slide 4 — Market Size Opportunity
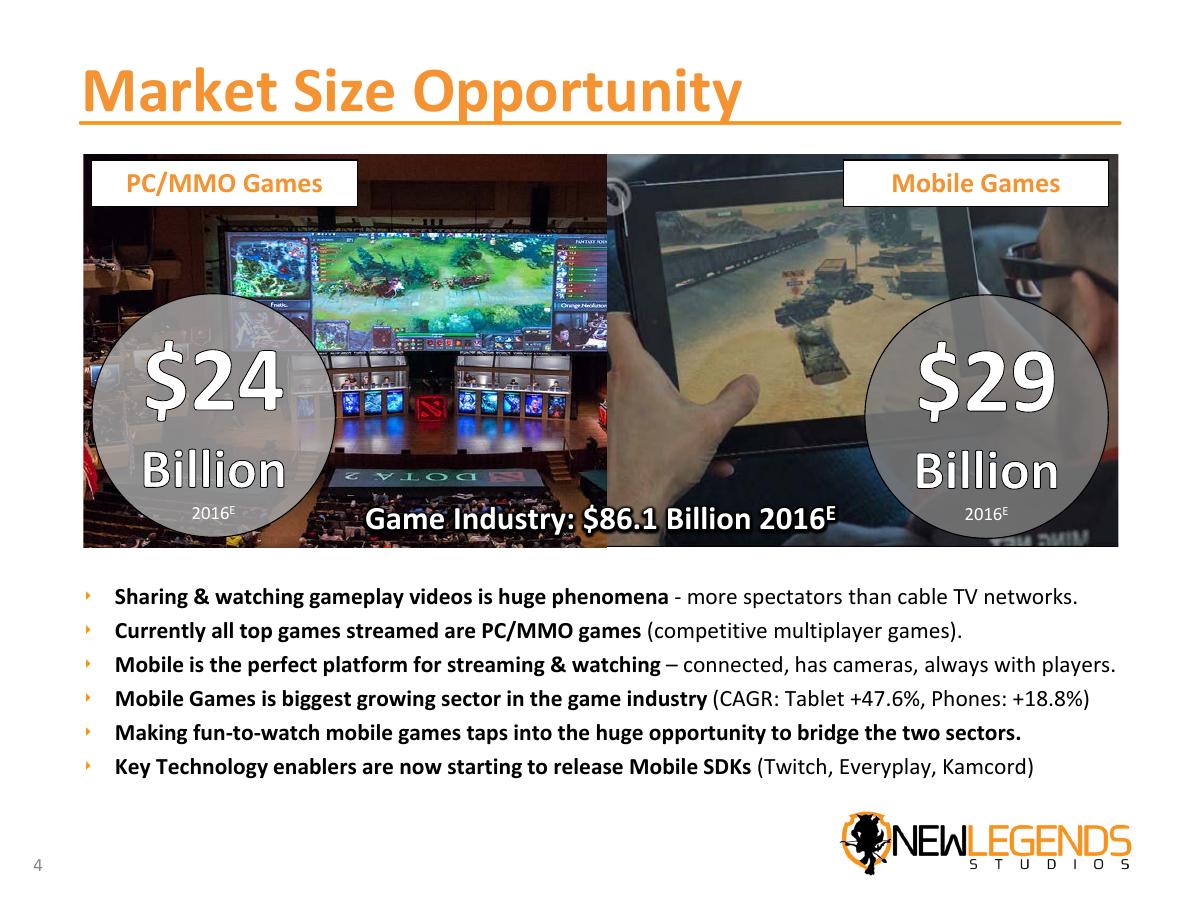
A comparison of PC/MMO and mobile market sizes plus six bullets: sharing and watching gameplay video is a huge phenomenon with more spectators than cable networks; all top streamed games are PC/MMO competitive multiplayer; mobile is "the perfect platform for streaming and watching — connected, has cameras, always with players"; mobile is the fastest-growing sector ( CAGR: tablet +47.6%, phones +18.8% ); making fun-to-watch mobile games bridges the two; and the key technology enablers are only now releasing mobile SDKs ( Twitch, Everyplay, Kamcord ).
This is a clean statement of a timing thesis and it names its own enabling condition, which most decks do not. The weakness is that the slide titled "Market Size Opportunity" never states a market size for the thing being sold. It gives growth rates for mobile gaming as a whole. Nowhere in the sixteen-page deck is there a number for how large the watchable-mobile-games segment could be, how many spectators convert to players, or what share of a mobile game's revenue is attributable to being streamable. The bridge is asserted, never sized.
Slide 5 — Game Spectators > TV channels
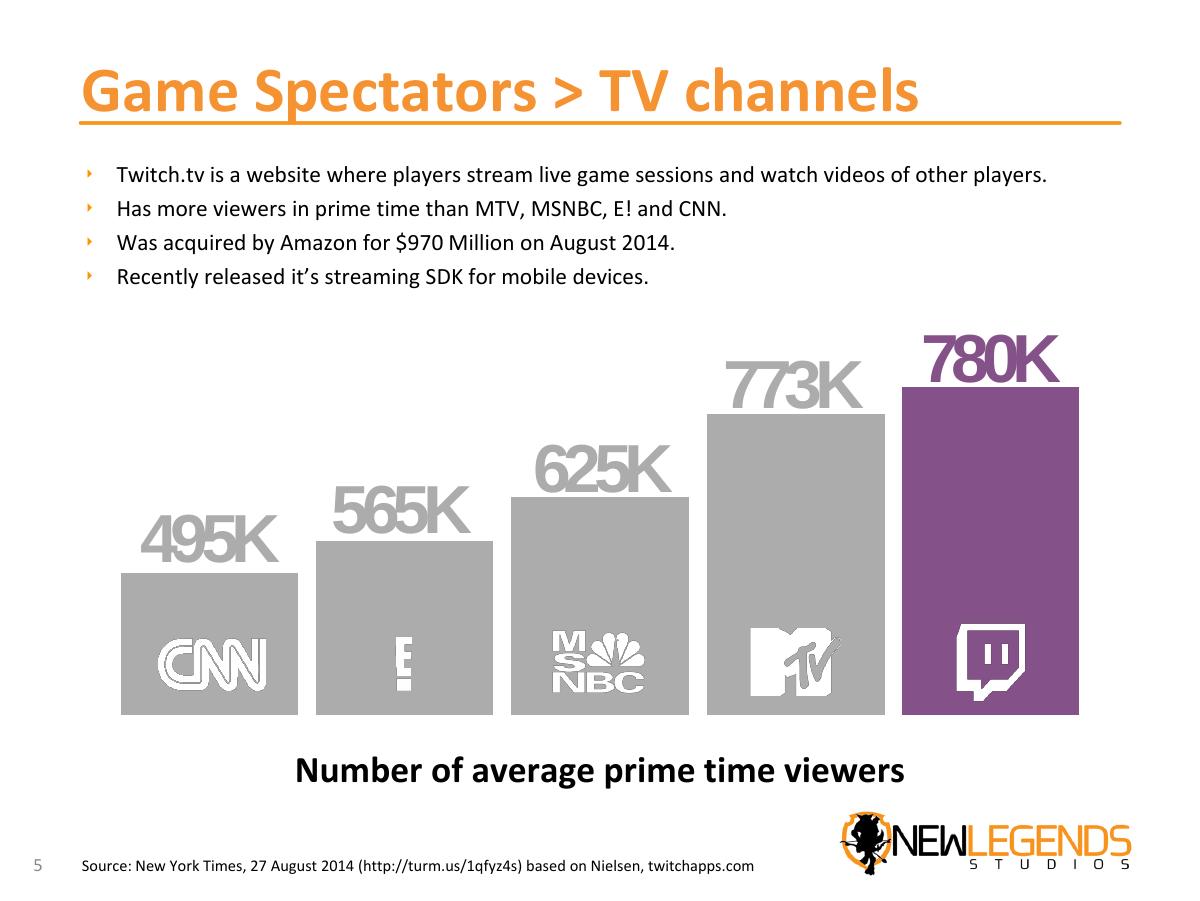
A bar chart with five columns — CNN 495K, E! 565K, MSNBC 625K, MTV 773K, Twitch.tv 780K — under the label "Number of average prime time viewers," sourced to the New York Times of 27 August 2014 citing Nielsen and twitchapps.com. Four bullets note that Twitch is a live-streaming site, has more prime-time viewers than MTV, MSNBC, E! and CNN, was acquired by Amazon for $970 million in August 2014 , and has recently released a mobile streaming SDK.
This is the deck's single most quotable slide and it contains its most serious analytical error — one you can only catch by turning to page 20 of the appendix, where the original New York Times graphic is reproduced. The original chart is titled "Peak Twitch and prime-time cable viewers" and its subhead says Twitch's peak viewership "now rivals the average prime-time viewers of some cable networks." Slide 5 relabels the whole axis as average prime-time viewers and drops the word "peak" entirely.
So the headline comparison is Twitch's peak against cable's average. That is not a small presentational liberty; it is comparing a maximum to a mean, and it turns "rivals" into "bigger than." An investor who knows the source — in 2014, plenty did, because that NYT graphic was everywhere — catches it immediately, and once they catch it they will re-check every other number in the deck. The irony is that the honest version of this claim was still remarkable and still made the point.
Slide 6 — Industry Players
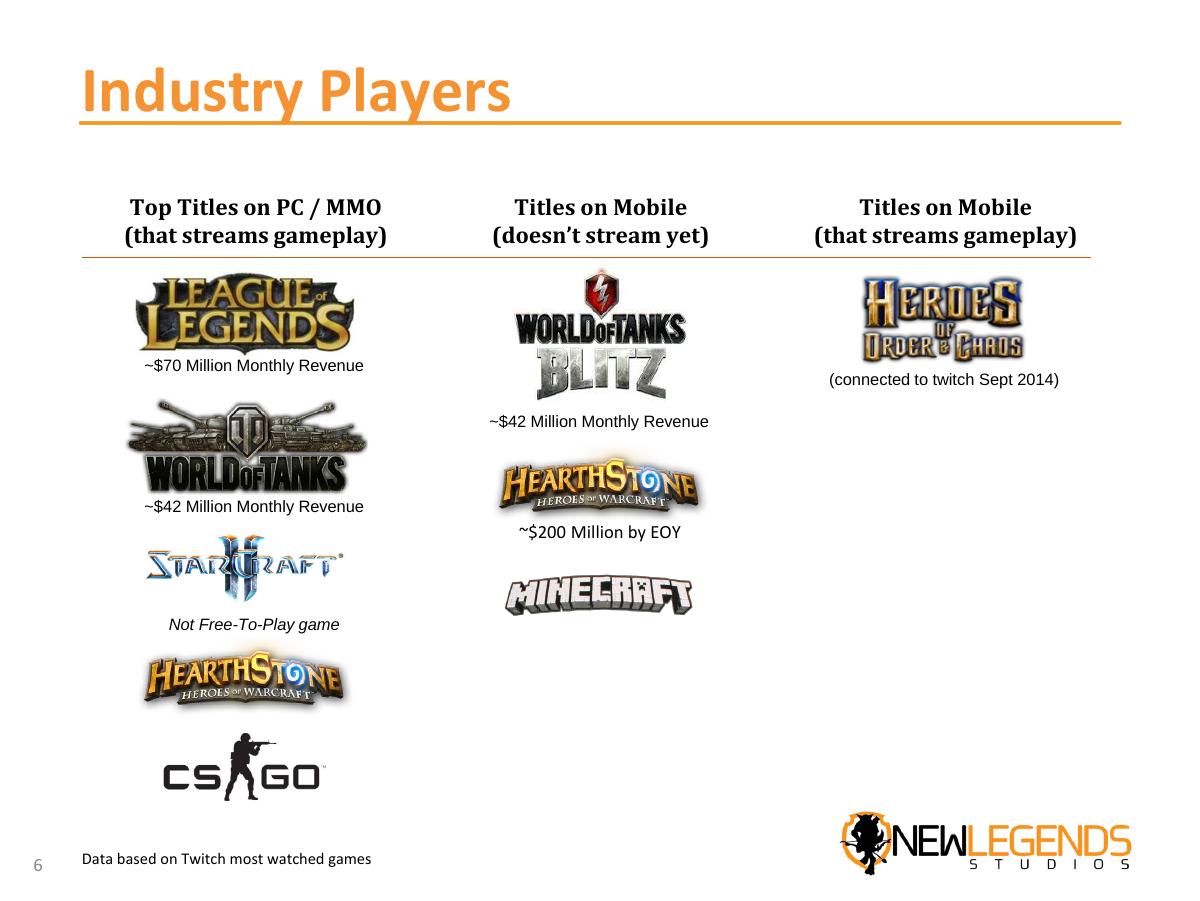
Three columns. Top titles on PC/MMO that stream gameplay : League of Legends at ~$70M monthly revenue , World of Tanks at ~$42M monthly , StarCraft II (flagged "not free-to-play"), Hearthstone and CS:GO. Titles on mobile that don't stream yet : World of Tanks Blitz at ~$42M monthly , Hearthstone at ~$200M by EOY , Minecraft. Titles on mobile that stream : Heroes of Order & Chaos, "connected to Twitch Sept 2014."
The structure is exactly right — it draws the gap the company wants to fill, and it does it with logos rather than prose. But the numbers migrate between columns. World of Tanks Blitz, the mobile title, is given the same ~$42M monthly figure as World of Tanks, the PC title , and Blitz had launched only in June 2014. Hearthstone appears in both the PC and mobile columns, with the mobile entry carrying a $200M-by-end-of-year figure that is a full-franchise number, not a mobile one. The effect, intended or not, is that the "mobile doesn't stream yet" column looks like it is already generating PC-scale revenue.
The deeper problem is the third column. It contains one game. A slide arguing that a category is about to exist has to explain why it contains a single entry — is the category early, or is it not a category? The deck asserts the first and never addresses the second.
Slide 7 — Forest Tribes: Rise of Heroes (visual)
The game on a tablet frame between the two characters from the cover, with a link to a prototype video demo. Showing the product on the target device is right, and by slide 7 of 16 the reader has finally seen it. For a games company, the video link is the most valuable object in the deck — and it is a shortened URL with no thumbnail, no run time and no description of what the viewer will see.
Slide 8 — Forest Tribes: the product
Free-to-play, mid-core, cross-platform iOS and Android. Competitive turn-based strategy with battle-card mechanics — "Clash of Clans meets Hearthstone." Built to be fun to watch as well as play: simple basic rules, easy to pick up and hard to master; designed to generate dramatic moments; play sessions that fit mobile; in-game streaming and community system.
The X-meets-Y line is well chosen: both references were 2014's biggest mobile hits and they combine into something a reader can actually picture. What is missing is any monetisation description. This is a free-to-play game and the deck never says what players buy, at what price, or how the card mechanic converts into spend — a gap that becomes critical three slides later when the financial model turns on a single ARPDAU assumption.
Slide 9 — Fun-to-watch Games DNA
A two-column table mapping seven watchability traits (competitive with clear winners; simple rules with depth; skill-dominant with some luck; unpredictable to the end; socially inclusive; fosters professional players; supports leagues and real-world events) to seven performance impacts (extremely high engagement, viral acquisition, high retention, brand loyalty, works across genres, becomes part of marketing strategy, advantage over clones). Then four bullets: a fun-to-watch match is "a sequence of dramatic moments"; it requires a specific design approach and specialised technology; not every game qualifies; and virality plus retention "significantly lower the user acquisition costs."
This is the best slide in the deck and it is the one that justifies the whole company. It converts a vibe — "watchable" — into a design specification, and it does so as a rubric a sceptic could apply to Forest Tribes themselves. Founders in any category should steal this format: the left column is your thesis, the right column is why it shows up in the numbers.
The flaw is that the two columns are not connected by evidence. "Significantly lower user acquisition costs" is the load-bearing economic claim of the entire business, and it appears as an unquantified bullet — then the financial model on slide 14 assumes eCPI rising from $1.50 to $3.50. The deck's own numbers contradict its own thesis, and nobody reconciles them.
Slide 10 — Production Timeline
A three-row grid. Forest Tribes: Rise of Heroes (tablets) : production Q4 2014 – Q1 2015, soft launch Q1 2015 – Q2 2015, new features Q2 2015 – Q1 2017. Forest Tribes (smartphones) : production Q3 2015, soft launch Q3 2015 – Q4 2015. New Game : pre-production Q1 2016, production Q1–Q3 2016, soft launch Q3–Q4 2016.
Clear, readable, and it shows a studio plan rather than a one-game plan — appropriate, since the pitch is for a studio. But it does not agree with the rest of the deck. This grid starts the tablet soft launch in Q1 2015 ; slide 14 says soft launch is Q2 2015 (6 months dev) and slide 15 repeats Q2 2015 ; the revenue model on slide 13 shows the first dollar in Q2 2015 . Three different slides, two different soft-launch quarters. It is a one-quarter discrepancy and it is exactly the sort of thing an investor points at to ask which version of the plan is the real one.
Slides 11–12 — Technology
Slide 11 is an architecture diagram: Unity game client compiling to iOS and Android phones and tablets with "possible future clients" on PC, web and consoles; game servers scaling 1, 2, 3+; database servers scaling the same way; an admin panel; analytics via Mixpanel and internal tooling; and outbound integration to Twitch, YouTube and "others" through an in-game community system. Slide 12 explains it in five bullets: cross-game infrastructure built in modules for reuse, Unity for cross-platform compilation, an in-game community system for forums, posts and video, third-party SDKs, and a real-time administration panel — illustrated with an internal community mockup beside an actual Twitch feed of a streamed mobile game.
The reuse argument is the right one for a studio pitch: it says the seed does not just buy one game, it buys infrastructure the second game inherits. Putting a mockup next to a real Twitch screenshot is also a good honesty move — the label distinguishes them explicitly. Two slides on architecture in a sixteen-slide seed deck is generous, though, and neither one names the thing an investor most wants: what is proprietary here? Unity, Mixpanel and the Twitch SDK are all off-the-shelf. The defensibility claim on slide 9 was design; nothing on 11 or 12 adds to it.
Slide 13 — Financial Projection for FT:RoH
Income by quarter, twelve quarters: nothing in Q4 2014 and Q1 2015, then $123,222 (Q2 2015), $398,894 , $833,806 , $1,504,714 , $2,005,781 , $2,866,711 , $4,081,975 , $5,607,011 , $7,189,829 , $8,154,687 in Q3 2017.
Two things are wrong with this slide, one obvious and one structural.
The obvious one: it is titled a financial projection and it contains no costs. There is no spend line, no headcount cost, no user-acquisition budget, no net figure, no cash balance. It is a revenue curve. Yet slide 14 claims break-even in Q4 2015 — a claim that cannot be evaluated against anything on the page that is supposed to support it. In a games business where marketing spend is the dominant variable and the model runs on eCPI, omitting the cost line removes the only half of the model that is actually contested.
The structural one: these numbers are quoted to the dollar. $8,154,687 for a quarter thirty-three months out, from a game that does not exist yet, in a category the deck says does not exist yet. Six significant figures on a pre-prototype projection do not signal rigour; they signal that a spreadsheet was left on default formatting. Round to the nearest hundred thousand and the same curve reads as a scenario rather than a forecast.
Slide 14 — Financial Assumptions & Milestones
Three assumption rows. Soft launch : eCPI $1.50, ARPDAU $0.10, stickiness 16%. Global launch : eCPI $2.00, ARPDAU $0.15, stickiness 24%. Twelve-month average post global launch : eCPI $3.50, ARPDAU $0.35, stickiness 36%. Plus a note assuming an additional $2M growth round in Q3 2016 . Milestones: initial gameplay prototype Q2 2014 (done), raising first round Q3–Q4 2014 (in progress), soft launch Q2 2015 (6 months dev), break-even Q4 2015 (five quarters from seed).
Publishing the assumptions at all puts this deck ahead of most. An investor can now argue with the model instead of guessing at it, and the eCPI figures are honest about acquisition getting more expensive as you scale — which is what actually happens and which most decks pretend away.
But look at what happens across the three rows. eCPI goes up 2.3x, and ARPDAU goes up 3.5x while stickiness goes up 2.25x. Every single input moves in the direction that helps, and the two that help move faster than the one that hurts. Real games do not improve monetisation and retention together by those multiples while scaling into more expensive traffic; typically ARPDAU and retention dilute as you buy beyond your core audience. This is not a rounding-error assumption — a flat ARPDAU of $0.15 through 2017 would cut the terminal quarter by more than half and push break-even well past Q4 2015.
There is also a hidden dependency. Break-even in Q4 2015 is stated as a milestone, but the model assumes a $2M growth round in Q3 2016 — nine months after break-even. Either the company is profitable at Q4 2015 and does not need the round, or the round funds the growth that produces the curve, in which case break-even is not a stable state. The deck asserts both and reconciles neither.
Slide 15 — Now Raising
A use-of-funds pie: salaries 48%, marketing 36%, others 16% . Two targets: hire key employees during Q4 2014 – Q1 2015, soft launch in Q2 2015.
The slide is titled "Now Raising" and it does not say how much. There is no amount, no valuation, no instrument, no runway in months, no minimum cheque and no lead status. A pie chart of percentages of an unstated number is not an ask; it is a shape. The only monetary figure attached to funding anywhere in the deck is the "$2M growth round at Q3 2016" buried in the assumptions on the previous slide — which means the reader has to guess whether the seed is smaller than, equal to, or larger than a number that describes a different round entirely.
This is the deck's biggest single failure, and it is a common one: the founder knew the number, said it out loud in every meeting, and never wrote it down. The reading deck is precisely the version where it must be written down, because the reading deck is the one that gets forwarded to the partner who was not in the room.
Slide 16 — Contact
The bear warrior again, the logo, the line "Join us to create New Legends," and Ohad Barzilay's name, title, email, Israeli mobile and US mobile.
Two phone numbers on two continents is a nice touch for a team pitching US investors from Israel. The closing line is also the only piece of emotional framing in an otherwise analytical deck, and it lands. What is absent is a next step: no ask for a meeting, no link back to the demo video, no data-room reference.
Slides 17–50 — "Extra Slides"
Thirty-four appendix pages. Highlights: Twitch at 45M MAUs in December 2013 versus 8M three years earlier, 12 billion minutes watched per month (+2x year on year) and 900K broadcasters per month (+3x), and Twitch at 44% of US live-streaming volume ahead of WWE at 18% and ESPN at 6%. eSports viewers of 72 million with $25M in prize money in 2013 , projected to 118 million and $32M in 2014 . Mobile games at $16 billion in 2013 actual against a $12.2 billion projection, with a footnote that Juniper projected $28.9 billion for 2016 . Kabam audience research showing mid-core conversion rates of 8% in the US, 18% in Europe, 27% in Asia . And the appendix's best slide: Digi-Capital's monetisation comparison showing PvP-and-PvE games at 13x the ARPU of single-player , with ARPPU above 10x.
That Digi-Capital table is a quantified version of the deck's core claim — competitive multiplayer monetises an order of magnitude better than single-player — and it is sitting on page 34 of 50 , behind the ask, in a section most investors never open. Meanwhile the same appendix reveals the peak-versus-average error on slide 5, because page 20 reproduces the original chart with its honest label intact.
There is also a title problem worth naming. Page 19 is headed "Mobile Games: $28.9 Billion by 2016," but the chart on it tops out at $86.1 billion across all segments and the $28.9 billion figure comes from a footnote citing a June 2014 Juniper revision — the chart's own implied number was $23.9 billion. The slide title uses the more favourable number the chart does not show. Three slides in the appendix also repeat the title "Games Dominates on Tablets" (pages 28, 39 and 46) for three different datasets, and one of them carries the note "Games = 67% tablet usage" beside a chart that shows games at 32%.
What this deck does better than most startup pitch decks
The tagline is a thesis. "Competitive mobile games that are fun to watch, fun to play" states the category, the differentiator and the bet in nine words on the cover. · It publishes its assumptions. eCPI, ARPDAU and stickiness at three stages, laid out in a table. Most seed decks show a revenue curve and hide the inputs; this one lets you argue with the model. · Slide 9 turns a vibe into a rubric. Seven watchability traits mapped to seven performance consequences is a format any founder can copy for any "why is this different" slide. · It names the enabling condition. "Key technology enablers are now starting to release mobile SDKs (Twitch, Everyplay, Kamcord)" is a timing claim with a verifiable trigger, not a vague "the market is ready." · The team's shared operating history is real. Four people who ran games together for three-plus years at a company that was acquired is the correct credential for a pre-product studio seed. · It labels mockups as mockups. Slide 12 puts an internal mockup next to a real Twitch screenshot and says which is which. That single label buys more trust than the mockup costs. · It anticipates the diligence questions. The appendix exists because investors asked for that data. Building it as a separate section instead of stuffing it into the main flow is the right instinct.
Where this deck would fail in an investor meeting
The ask has no number. A slide titled "Now Raising" with a use-of-funds pie and no amount, no valuation, no instrument and no runway. In a reading deck — the one that gets forwarded — this is disqualifying. · Peak versus average. Slide 5 relabels Twitch's peak viewership as "average prime time viewers" to beat cable's average. The appendix contains the original chart that proves the relabel. · A financial projection with no costs. Twelve quarters of revenue to the dollar, no spend line, no net, and a break-even claim on the following slide that nothing on the page supports. · Every assumption moves the right way. ARPDAU 3.5x and stickiness 2.25x against eCPI 2.3x. Monetisation and retention improving faster than acquisition costs, as you scale, is the opposite of what happens. · Break-even and the growth round contradict. Profitable in Q4 2015, yet the model needs $2M in Q3 2016. Both cannot be load-bearing. · Three slides, two soft-launch dates. Slide 10 says Q1 2015; slides 13, 14 and 15 say Q2 2015. · Mobile revenue figures borrowed from PC titles. World of Tanks Blitz carries World of Tanks' ~$42M monthly; Hearthstone's $200M appears in the mobile column. · No monetisation model for the game itself. A free-to-play pitch that never says what players buy or at what price, while the entire forecast rests on one ARPDAU number. · The market slide never sizes the market. "Market Size Opportunity" gives growth rates for mobile gaming, never a size for watchable mobile games. · Best evidence buried in the appendix. The 13x ARPU advantage of competitive play sits on page 34, thirty pages after the slide that needed it. · An anonymous investor on the team slide. A redacted headshot labelled "X." raises the question it is trying to avoid. · No date anywhere. A deck built on August 2014 news events, published in 2015, with no date on the cover.
Date and stage Implied by the calendar invite Must be on the cover. Absent here.
Chart labels Presenter can caveat "peak vs average" The label is the claim. Slide 5's relabel goes uncorrected.
Costs Discussed live, model sent after At least a spend line and a net. Revenue only here.
Appendix Held in reserve for questions Read selectively or not at all — put the 13x ARPU proof in the main flow.
Demo video Played in the room Needs a thumbnail, a run time and a reason to click. A bare short link here.
Length 10–14 slides 16 slides is right; 34 appendix pages is twice the pitch.
How you would rebuild this deck today
Put the ask on slide 15 in numerals. "Raising $Xm seed on a SAFE, 18 months of runway to global launch, $Y committed." Keep the 48/36/16 pie beneath it — it is a good pie, it just needs a denominator. · Promote the operating history to slide 1 or 2. "The team that ran a ~$1M/month mobile games portfolio together for three years is building the first watchable mobile game." That sentence earns the next fourteen slides. · Fix slide 5 and keep the point. Say "Twitch's peak audience now rivals MTV's average prime-time audience" and cite the NYT chart as printed. The honest version is still a striking claim and it survives diligence. · Add a cost line to the projection. Revenue, UA spend, headcount, net, cash. Round every figure to the nearest $100K. Then the Q4 2015 break-even becomes checkable instead of asserted. · Show a downside case. Hold ARPDAU flat at $0.15 and let eCPI rise as planned. If the business still works, that scenario is more persuasive than the base case; if it does not, you have found the thing to fix before the meeting. · Reconcile the growth round. Either break-even is the milestone and the $2M is optional acceleration, or the $2M is required and break-even is later. Say which, on the same slide. · Move the Digi-Capital 13x ARPU table into the main deck. It is third-party quantified proof of the core thesis and it belongs immediately after slide 9, not on page 34. · Add the missing monetisation slide. What players buy, price points, the card economy, and which comparable title's monetisation you are modelling on. · Size the actual market. Not mobile gaming's CAGR — the watchable segment. Even a bottom-up estimate ("Twitch's top ten titles generate $X monthly; mobile is Y% of gaming revenue and 0% of that watch time") beats a growth rate for a different market. · Cut the appendix to eight pages and date every source. Half of it is 2012–2013 data supporting claims about 2015. Keep Twitch scale, eSports growth, the monetisation comparison, the mid-core conversion rates, and drop the rest. · Date the cover, and one soft-launch quarter everywhere. Pick Q2 2015, propagate it to slide 10, and stamp "Seed round — October 2014" on slide 1.
The transferable lesson
NewLegends had a genuinely good thesis five years early. Mobile eSports did arrive; streaming from phones did become normal; competitive multiplayer did monetise the way Digi-Capital's table said it would. The deck spotted the wave, named the enabling technology by SDK, and had a team with the scar tissue to build for it.
And it left the two most consequential numbers off the page. The ask has no amount, and the projection has no costs. Everything else on this list — the peak-versus-average relabel, the borrowed revenue figures, the assumptions all improving at once — flows from the same underlying habit: the deck reaches for the version of each number that helps the argument and does not write down the version that constrains it. An investor reading page 15 cannot tell you what they are being asked for. An investor reading page 13 cannot tell you whether the company survives to page 14.
The test is mechanical, and you can run it on your own deck this afternoon. Find the slide with your ask. Is there a number on it, in numerals, with an instrument and a runway? Find your financial slide. Is there a cost line? Then take your single most impressive statistic and check the original source's axis label. Most decks fail at least one of those three, and the ones that fail all three are usually, like this one, hiding a real business underneath.
Frequently asked questions
- What was NewLegends Studios?
- NewLegends Studios was an Israeli mobile games studio founded by Ohad Barzilay and Eitan Reisin, both formerly of Mytopia (acquired by 888). It raised a seed round in Q3/Q4 2014 to build Forest Tribes: Rise of Heroes, a free-to-play cross-platform competitive turn-based strategy game designed to be streamed and watched, described in the deck as 'Clash of Clans meets Hearthstone'.
- Why did the NewLegends deck avoid the word 'eSports'?
- The founder explains it on slide 2: in 2014 many investors did not know the term and 'understood it completely wrong initially', so the deck uses 'watchable games' throughout. It is a genuinely useful lesson in category naming — if your label needs a definition before your pitch begins, you have spent your first slide on vocabulary instead of the business.
- What is the biggest mistake in the NewLegends Studios pitch deck?
- The slide titled 'Now Raising' never states how much money is being raised. It shows a use-of-funds pie of 48% salaries, 36% marketing and 16% other, with no amount, valuation, instrument or runway. In a deck explicitly built for reading rather than presenting, the ask has to be written down, because the reading deck is the version forwarded to partners who were never in the room.
- Is the Twitch versus cable TV comparison in the deck accurate?
- Not as labelled. Slide 5 shows Twitch at 780K against MTV at 773K, MSNBC at 625K, E! at 565K and CNN at 495K under the heading 'Number of average prime time viewers'. The source — a New York Times chart from 27 August 2014, reproduced on page 20 of the deck's own appendix — plots Twitch's peak viewership against cable's average prime-time viewership. Comparing a maximum to a mean turns 'rivals' into 'bigger than'.
- Which slides should founders copy from this deck?
- Slide 9, the 'Fun-to-watch Games DNA' rubric, which maps seven design traits to seven performance consequences and turns a subjective claim into something a sceptic can test. Slide 14's published assumptions table is also worth copying in form — showing eCPI, ARPDAU and retention lets an investor argue with your model instead of guessing at it, provided the assumptions do not all improve at once as they do here.
- What happened to Forest Tribes: Rise of Heroes?
- The deck was published openly by the founder in mid-2015 as a resource for other entrepreneurs, with slide 2 noting it was used around Q3/Q4 2014 and that newer data would exist by the time anyone read it. The planned Q1–Q2 2015 tablet soft launch did not produce a title that reached commercial scale, and NewLegends Studios did not become an established mobile eSports publisher. The underlying thesis — that competitive mobile games would become spectator entertainment — was correct but arrived several years later.