Nexthink’s 2021 Series D deck reflects a company that has successfully moved from a niche tool to a platform-level enterprise necessity. By framing the problem as a 'broken' IT service model (Slide 3) and positioning their solution as the unifying layer for Digital Employee Experience (Slide 5), Nexthink effectively created a new category. The deck is heavy on social proof and quantitative outcomes, citing a 62% reduction in root cause analysis time and a $900k cost avoidance for a healthcare client (Slide 8). While the deck lacks a specific 'Ask' slide or detailed financial projections, its…
Key takeaways
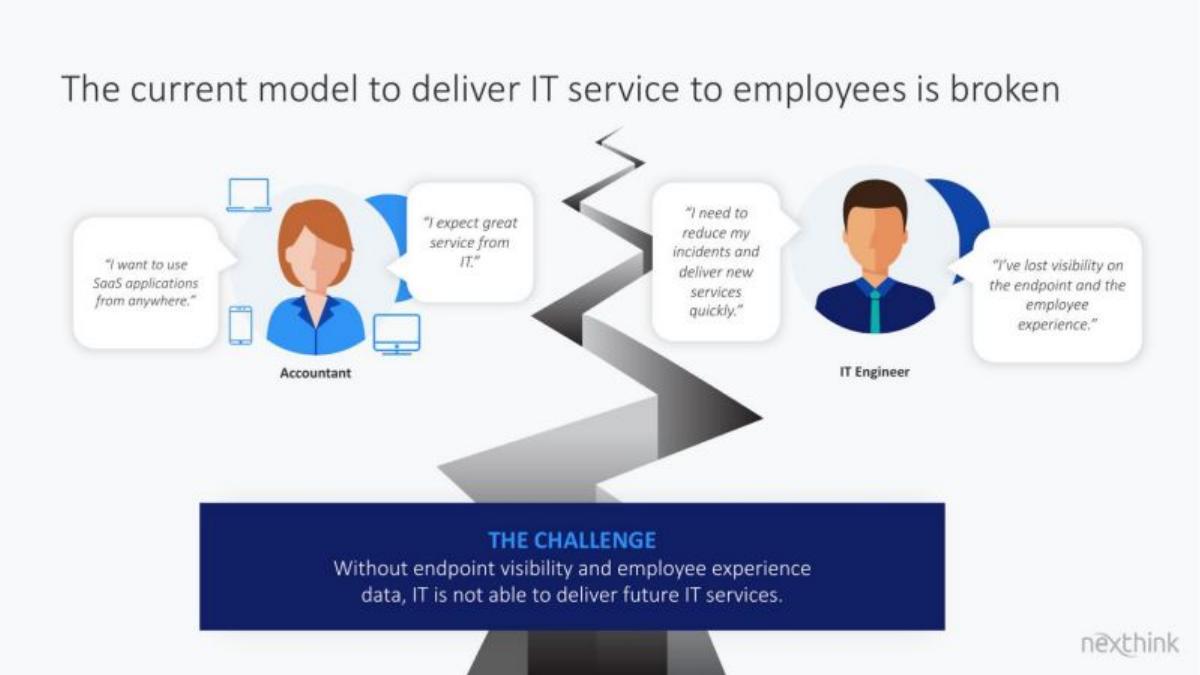
- The deck defines the problem as a lack of endpoint visibility and employee sentiment data, which prevents IT from delivering future services (Slide 3).
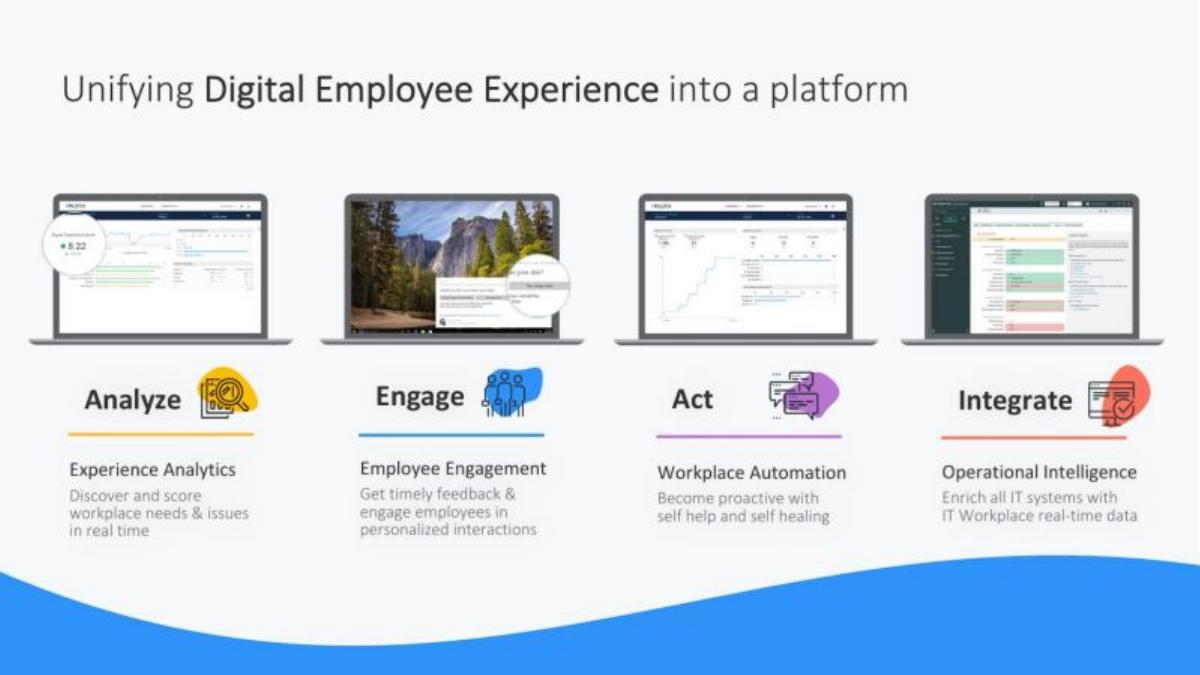
- Nexthink positions itself as a unifying platform across four pillars: Analyze, Engage, Act, and Integrate (Slide 5).
- Business impact is quantified through diverse metrics, including a 72-point increase in Employee NPS for a pharmaceutical company (Slide 8).
- The deck uses three detailed use-case slides to demonstrate how the platform handles specific enterprise migrations and transformations (Slides 9-11).
- Market dynamics are framed as a shift from siloed IT disciplines to a unified employee-centric view (Slide 14).
- The addressable market is calculated at $11.7B based on 777M business device units and a $15 average price point per endpoint (Slide 15).
- The platform architecture is shown to sit on a 'Modern Cloud Foundation' with over 100 use-case content packs in its library (Slide 18).
- The team slide highlights deep enterprise experience, including advisors from Palo Alto Networks and Carbon Black (Slide 19).
Executive Summary: The Category Creator’s Playbook
Nexthink’s Series D pitch deck, used to secure $180M in 2021, is a textbook example of how a mature startup transitions from selling a product to selling a category. The deck does not focus on the minutiae of software features; instead, it focuses on the Digital Employee Experience (DEX) as a strategic business imperative. By the time a company reaches Series D, investors are looking for market dominance and the ability to capture a massive TAM. Nexthink addresses this by framing IT as a department that has lost its way and needs a unifying platform to regain visibility.
Slides 1-2: The Vision and Mission
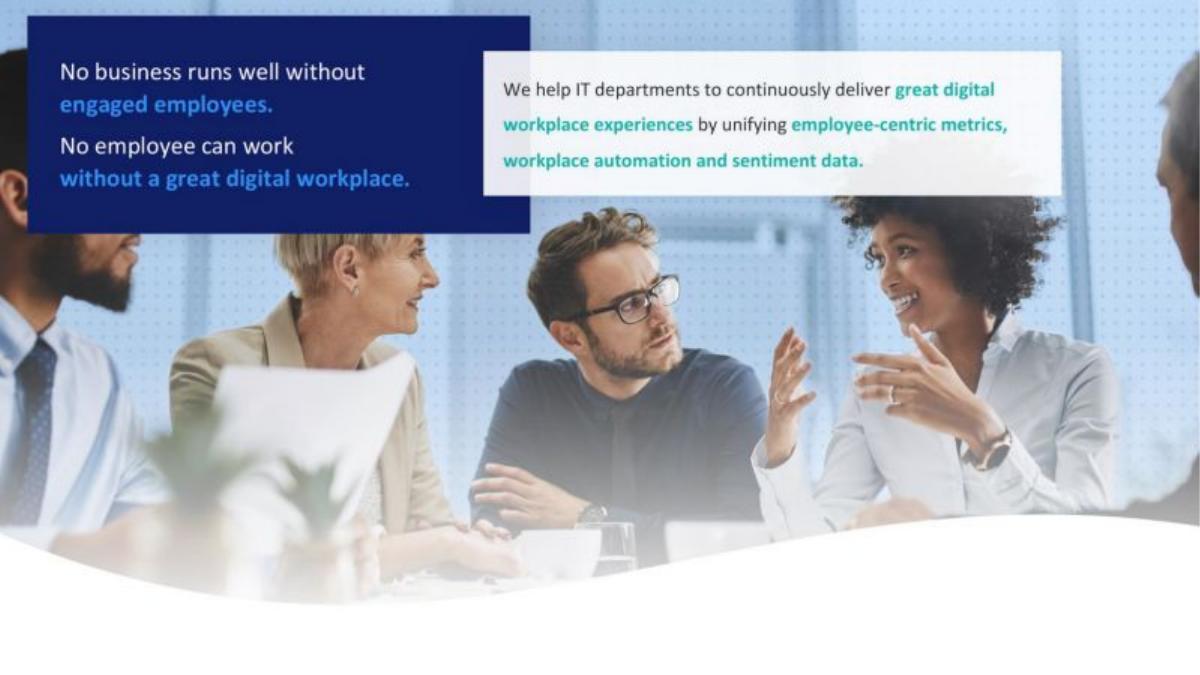
The deck opens with a clear, high-level value proposition: Transform Digital Employee Experience . Slide 2 establishes the fundamental logic of the business: no business runs well without engaged employees, and no employee can work without a great digital workplace. It introduces the solution as a unification of employee-centric metrics, workplace automation, and sentiment data. This sets the stage for a platform play rather than a point solution.
Slides 3-4: The Problem and the Gap in Current Tech
Slide 3 uses a 'broken bridge' visual to illustrate the gap between the Accountant (the user) and the IT Engineer. The user wants to work from anywhere with SaaS apps, while the IT Engineer has lost visibility on the endpoint. The core challenge is stated clearly: Without endpoint visibility and employee experience data, IT is not able to deliver future IT services.
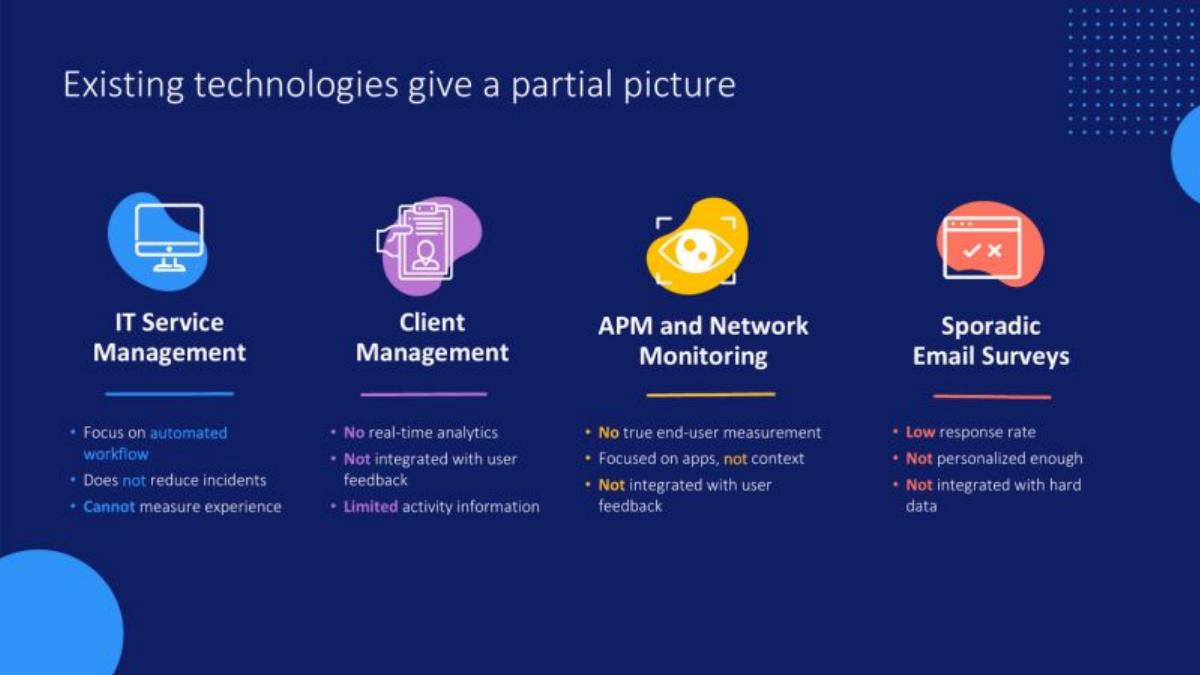
Slide 4 is a critical competitive positioning slide. It categorizes existing technologies—ITSM, Client Management, APM, and Surveys—and lists their failures. By highlighting that these tools are 'siloed' and 'partial,' Nexthink creates the logical necessity for a 'unifying' platform, which is introduced on the very next slide.
Slides 5-7: The Nexthink Solution and Outcomes
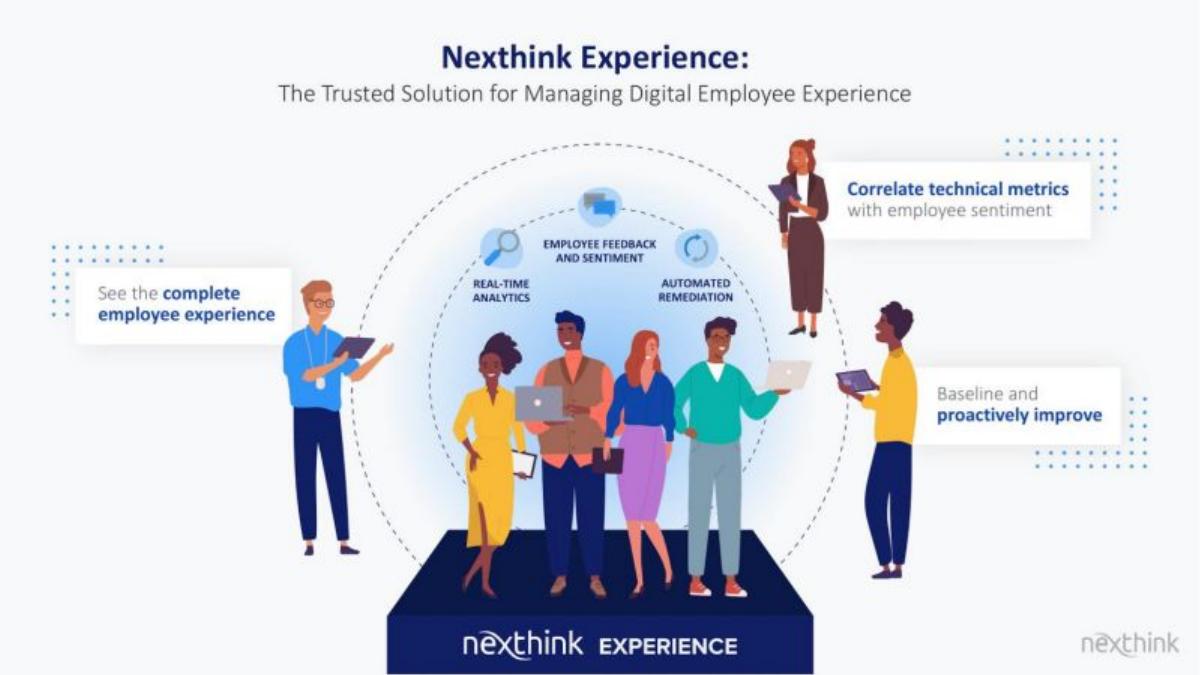
Slide 5 introduces the four pillars of the Nexthink platform: Analyze, Engage, Act, and Integrate . This is a classic 'Platform Architecture' slide that shows the breadth of the offering. Slide 6 reinforces this with a 'Nexthink Experience' graphic, showing how technical metrics correlate with employee sentiment. Slide 7 distills the value proposition into three simple outcomes: finding and fixing issues faster, proactively managing experience, and providing the right technologies to every employee.
Slide 8: The Proof Point (Business Impact)
This is arguably the most important slide in the deck for a Series D investor. It moves from theory to hard data. Nexthink lists six specific metrics from real-world clients:
62% reduction in time for root cause analysis (US Pharmaceutical Company). · 72-point increase in Employee NPS (US Pharmaceutical Company). · 440 days of lost time avoided from one outage (Global Manufacturer). · $900k cost avoidance for hardware refresh cycle (US Healthcare Company). · 10% increase in experience score (Global Manufacturer). · 37% incident reduction (US Media Company).
The diversity of these metrics—ranging from technical efficiency to financial savings to employee sentiment—demonstrates the platform's versatility across different enterprise functions.
Slides 9-11: Deep Dive Use Cases
Nexthink dedicates three slides to detailed use cases, which is unusual for a pitch deck but effective for enterprise software. These slides (9, 10, and 11) walk through specific scenarios like a migration to Skype for Business and 'personalized' service delivery. Each slide follows a 'Problem-Action-Result' format, showing how the platform’s 'Analyze, Engage, Act' framework works in practice. This serves to de-risk the technology in the eyes of the investor by showing it is battle-tested in complex environments.
Slides 12-15: Market Dynamics and TAM
After proving the product works, the deck shifts to the market opportunity. Slide 14 explains that traditional IT disciplines were siloed (APM, End User Computing, Sentiment) and that Nexthink integrates them. Slide 15 presents the $11.7B TAM . The calculation is transparent: 777 million business devices multiplied by a $15 average price point per endpoint. Citing Gartner adds third-party credibility to these figures.
Slides 16-18: Technology and Product Packaging
Slides 16 and 17 show the 'Nexthink DEX Platform' as the hub for digital experience, connecting users 'working from home, office or anywhere' to IT leadership (CIO, VP EUC, App Owner). Slide 18 provides a technical overview of the 'Product Packaging,' showing the 'Modern Cloud Foundation' and the 'Nexthink Library' which contains over 100 use-case content packs. This slide communicates scalability and the 'moat' created by a library of pre-built integrations and workflows.
Slide 19: The Team
The team slide features 11 executives and two prominent advisors. The inclusion of advisors from Palo Alto Networks (René Bonvanie) and Carbon Black (Patrick Morley) is a strategic move to signal that Nexthink is operating at the same level of enterprise sophistication as the world’s leading cybersecurity and infrastructure firms.
What Nexthink Does Well
Category Definition: Nexthink doesn't just call itself 'IT monitoring.' They own the term 'Digital Employee Experience.' By naming the category, they set the criteria by which they and their competitors are judged.
Quantifiable Success: Slide 8 is a masterclass in using data to sell. They don't just say they improve efficiency; they give the exact percentage and the specific industry of the client.
Logical Progression: The deck follows a very tight narrative arc: The world has changed -> IT is broken -> Current tools are insufficient -> We are the unifying platform -> Here is the proof -> Here is the massive market.
What is Missing from the Nexthink Deck
The Ask: There is no slide stating how much money they are raising or what the terms are. While we know from catalogue data that they raised $180M, the deck itself is silent on the transaction details.
Financial Performance: For a Series D, it is highly unusual not to see a slide on ARR growth, net revenue retention (NRR), or CAC/LTV ratios. This suggests this version of the deck may have been a 'teaser' or a high-level overview used for initial meetings, with a separate data room for the hard financials.
Competitive Matrix: While they critique categories of competitors on Slide 4, they never name specific rival companies. In a mature market, investors usually want to see a feature-by-feature comparison against direct competitors.
Founder Takeaways: What to Copy
Use the 'Unifying Platform' Frame: If you are in a crowded market, don't try to be 'better' than everyone else. Instead, position yourself as the layer that unifies the existing tools that aren't talking to each other. This moves you from being a 'cost' to being an 'investment' that makes other costs more efficient.
Industry-Specific Proof: When listing metrics, always include the industry (e.g., 'US Pharmaceutical Company'). It shows investors that you have product-market fit across different verticals and gives them a sense of your 'Ideal Customer Profile' (ICP).
Visual Consistency: The deck uses a consistent color palette and iconography (the 'blobs' behind icons on Slides 4, 5, 8, and 15). This professional polish is expected at the Series D level and helps the deck feel like a cohesive brand story rather than a collection of slides.
Market Sizing Logic: Don't just throw a big number on a slide. Show the math. Nexthink's formula (Devices x Price per Endpoint) is simple, logical, and easy for an investor to verify or tweak in their own model.
Frequently asked questions
- What is the primary problem Nexthink aims to solve?
- According to Slide 3, the current model for IT service delivery is 'broken.' The deck argues that IT departments have lost visibility on the endpoint and the employee experience. Without this data, they cannot proactively reduce incidents or deliver new services quickly, creating a gap between employee expectations and IT's ability to execute.
- How does Nexthink differentiate itself from existing IT tools?
- Slide 4 explicitly lists the shortcomings of existing technologies. It notes that IT Service Management (ITSM) focuses on workflows but doesn't reduce incidents, Client Management lacks real-time analytics, APM/Network Monitoring lacks end-user context, and email surveys suffer from low response rates and a lack of integration with hard data.
- What specific business outcomes does the deck promise?
- Slide 8 provides six concrete examples of business impact: a 62% reduction in root cause analysis time, a 72-point increase in Employee NPS, 440 days of lost time avoided from a single outage, $900k in cost avoidance for hardware refreshes, a 10% increase in experience scores, and a 37% reduction in incidents.
- How does Nexthink calculate its Total Addressable Market (TAM)?
- On Slide 15, the company cites Gartner data showing an install base of 777 million business devices (desktops, notebooks, and ultramobiles) in 2019. By applying their own estimate of a $15 average price point per endpoint, they arrive at a total market estimate of $11.7 billion.
- What is missing from this Series D pitch deck?
- The deck is notably missing several standard fundraising elements: there is no slide detailing the specific 'Ask' (amount and terms), no 'Use of Funds' breakdown, no historical financial growth charts (ARR/MRR), and no detailed competitive landscape matrix beyond the general category critiques on Slide 4.