The Biogrify pitch deck, dating from 2011, introduces a social platform centered on 'social infographics' or 'creative communication.' The 11-slide presentation focuses heavily on the user experience, demonstrating how individuals can track personal data—like days until a vacation or hours spent watching a favorite TV show—and share these as visual assets. A significant portion of the deck is dedicated to brand integration, suggesting a business model built on sponsored infographics and fan engagement for entertainment properties like 'Jersey Shore.' While the deck excels in visual consistenc…
Key takeaways
- The platform defines its core value proposition as 'creative communication' through social infographics (Slide 3).
- Biogrify targets both individual users for personal tracking and brands for fan engagement (Slides 4 and 7).
- The deck leans heavily on pop culture references, specifically the show 'Jersey Shore,' to illustrate product utility (Slides 4, 5, and 7).
- A 'Current Market' slide predicts Facebook will reach 1,000,000,000 users by the end of 2012 (Slide 10).
- The team consists of two founders and four specialized roles, including designers and a Rails developer (Slide 8).
- The deck lacks a specific financial 'ask' or a clear breakdown of how the investment will be used.
- Revenue models are implied through 'Sponsored By' tags on product mockups rather than explicitly stated (Slides 4 and 6).
- The market size is calculated based on the assumption that 60% of Facebook users will look for new social networks in 2013 (Slide 10).
The Vision: Infographics as a Social Language
Biogrify’s pitch deck is a product of its time, leaning into the 'infographic craze' of the early 2010s. The company positions itself not just as another social network, but as a utility for 'creative communication.' By turning mundane data—like how many days you have been alive or how many dresses you tried on—into high-fidelity graphics, Biogrify aims to capture the attention of a visual-first generation of internet users.
Slide 1: Title Slide
The deck opens with a clean, dark background featuring the Biogrify logo: a stylized, multi-colored bar chart contained within a speech bubble. This immediately communicates the brand's focus on data (the bars) and social interaction (the speech bubble). The typography is a friendly, white script, setting a tone that is more consumer-lifestyle than enterprise-tech.
Slide 2: The Hook
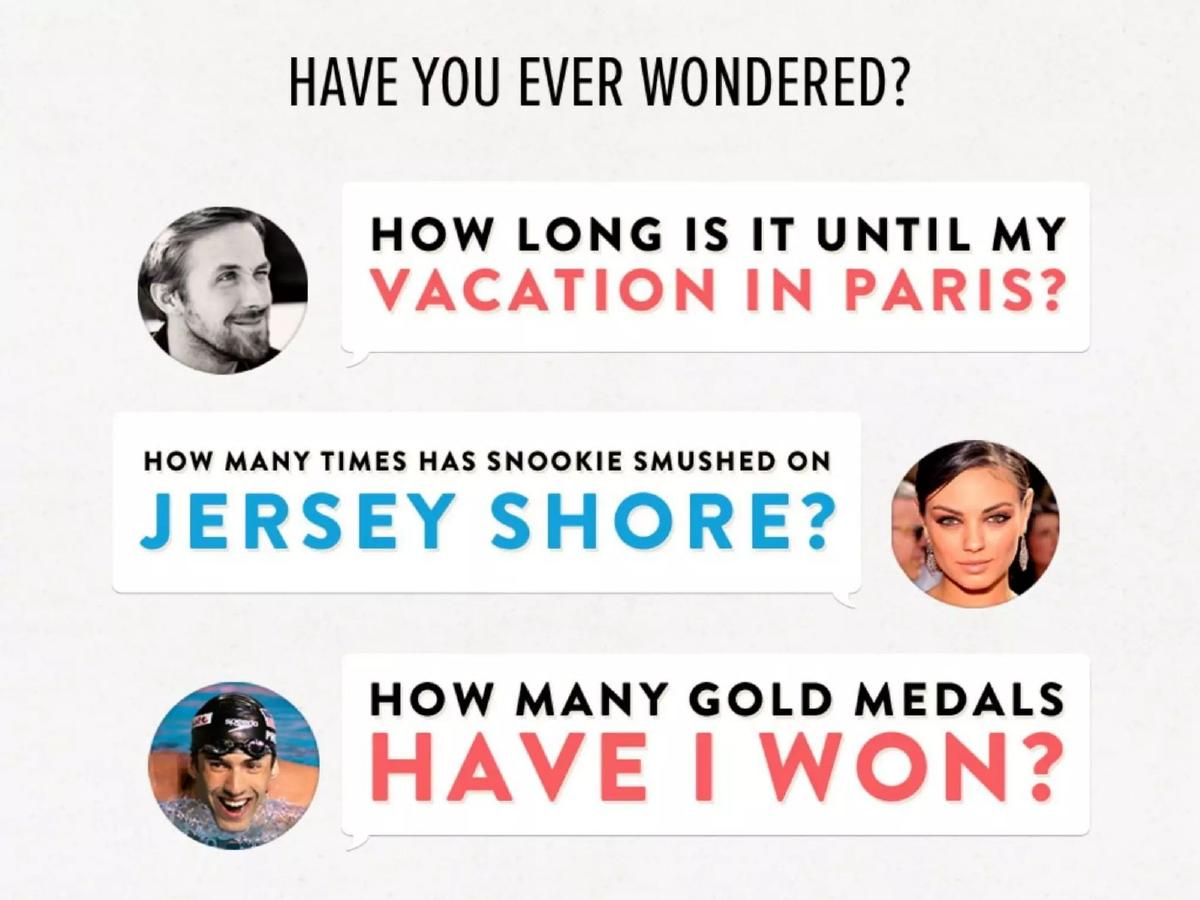
Slide 2 uses a 'Have you ever wondered?' framework to establish the problem or the curiosity the app satisfies. It uses celebrity avatars (Ryan Gosling, Mila Kunis, Michael Phelps) to pose questions like 'How long is it until my vacation in Paris?' and 'How many gold medals have I won?' This slide establishes the 'tracking' nature of the product, suggesting that people have a natural desire to quantify their lives and interests.
Slide 3: The Value Proposition
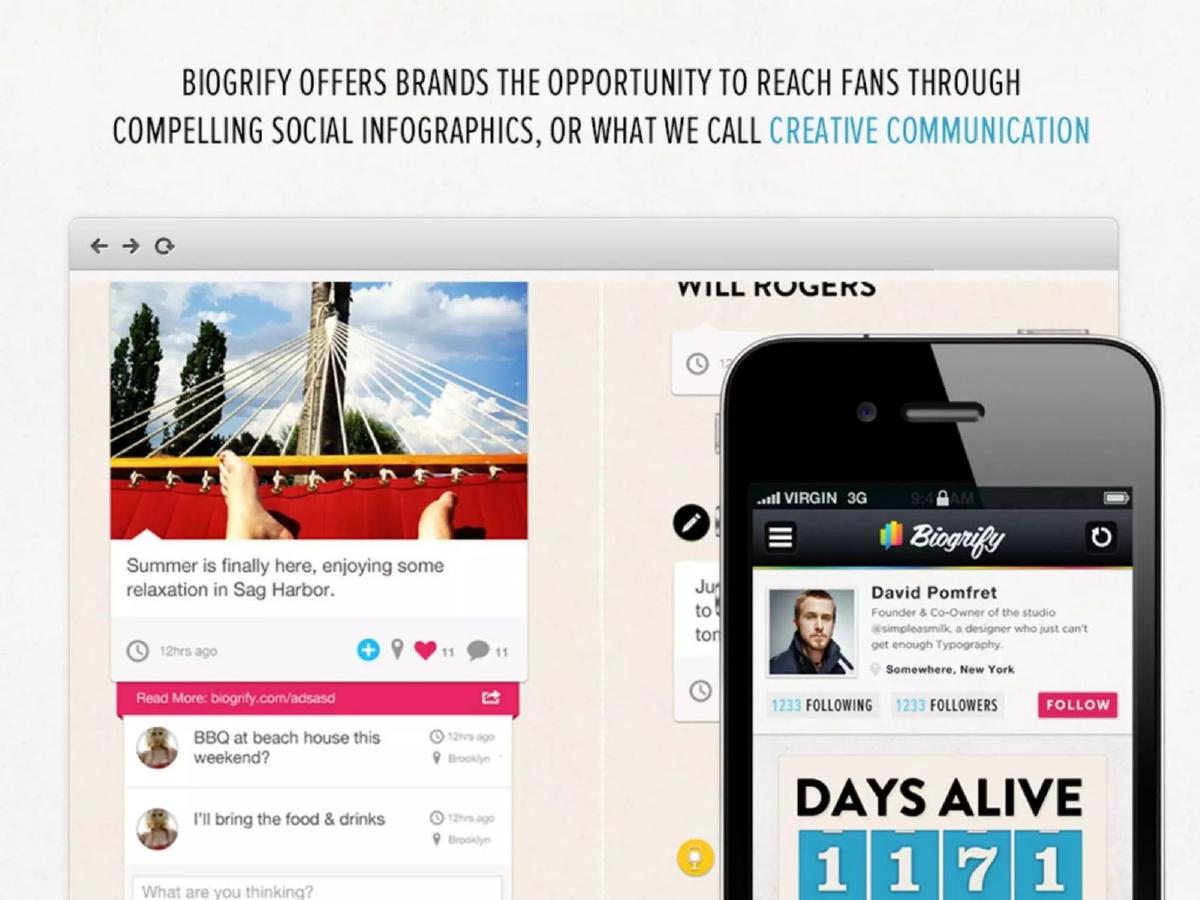
This slide introduces the term 'Creative Communication.' It explicitly states that Biogrify offers brands the opportunity to reach fans through 'compelling social infographics.' The slide features a split-screen mockup showing a web browser and a mobile app (specifically an iPhone 4-era interface). This confirms the platform's cross-device intentions and its focus on a feed-based social experience.
Slide 4: Personal Tracking and Sponsorship
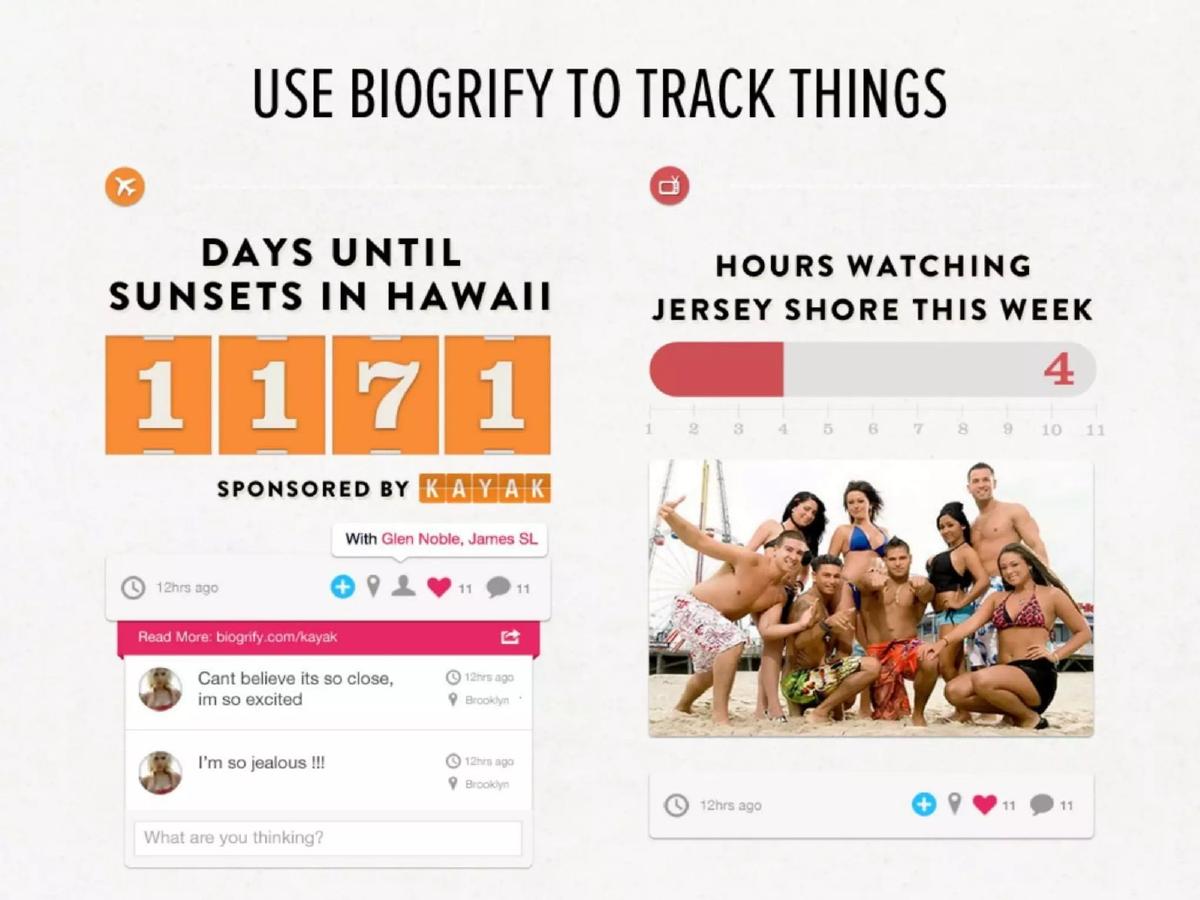
Slide 4, titled 'Use Biogrify to Track Things,' provides the first concrete look at the product's utility. It shows a 'Days Until Sunsets in Hawaii' counter and an 'Hours Watching Jersey Shore This Week' bar chart. Crucially, the Hawaii counter is 'Sponsored by Kayak,' demonstrating the intended monetization strategy: integrating brand sponsorships into the very tools users use to track their lives.
Slide 5: Social Competition
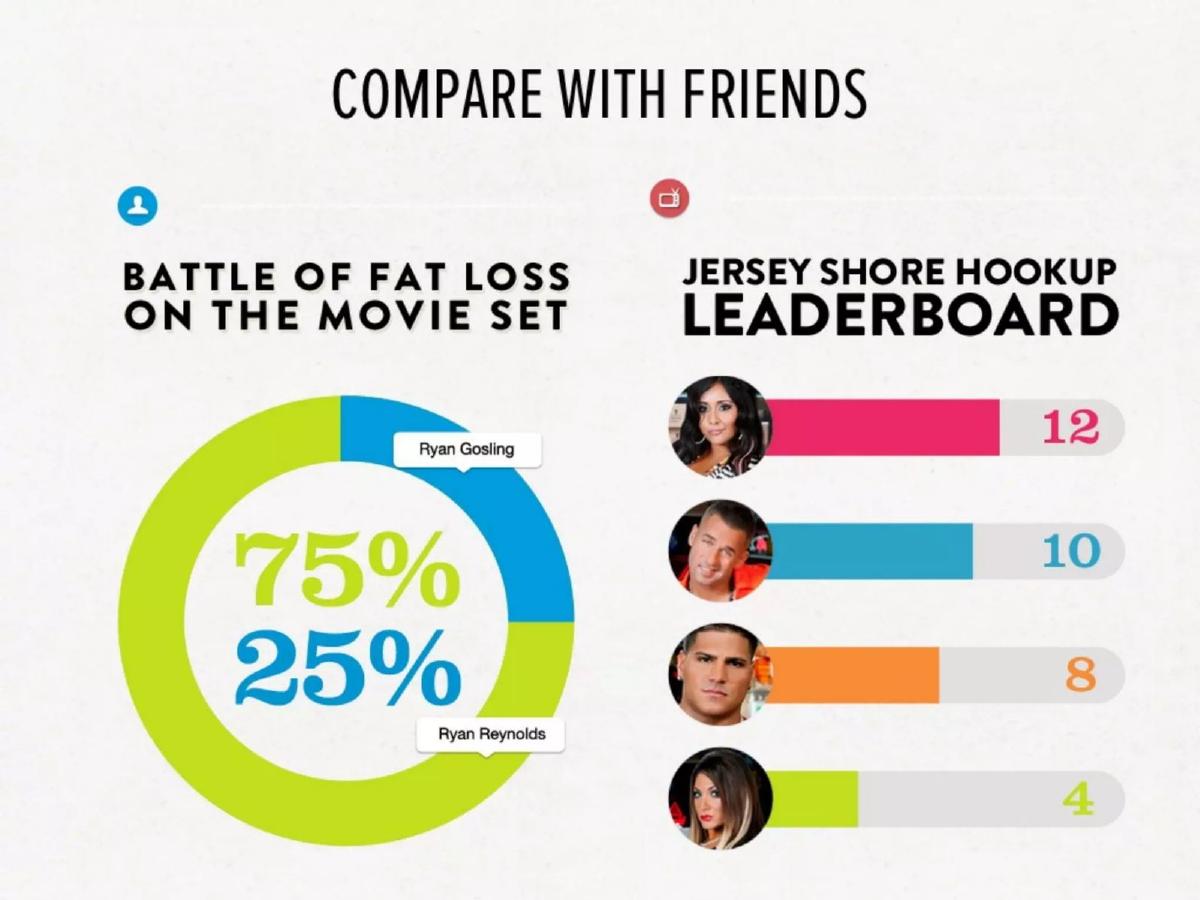
Titled 'Compare With Friends,' this slide highlights the social and gamified aspects of the platform. It shows a 'Battle of Fat Loss' pie chart between Ryan Gosling and Ryan Reynolds, and a 'Jersey Shore Hookup Leaderboard.' By introducing leaderboards and comparative charts, Biogrify positions itself as a platform for social competition and community engagement.
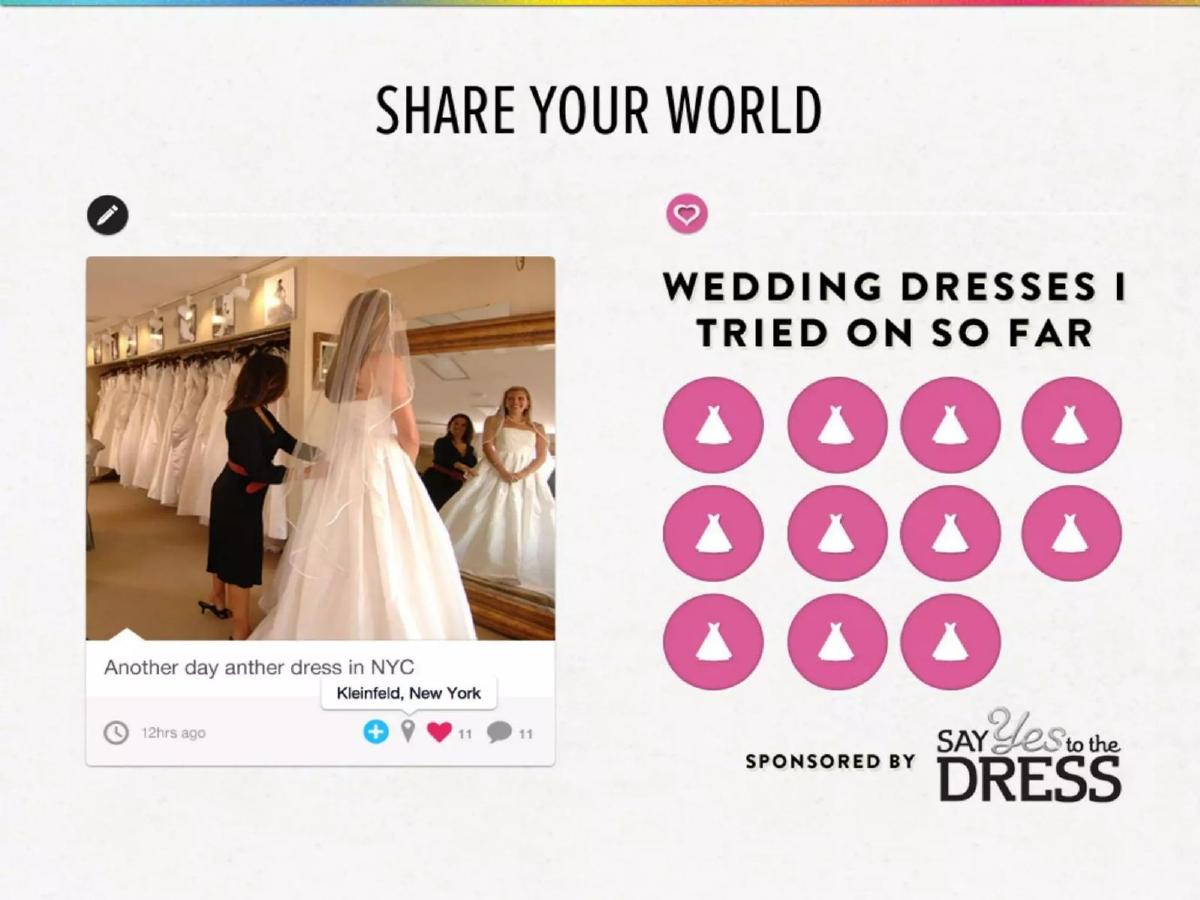
Slide 6: User-Generated Content
The 'Share Your World' slide shows how a user might document a specific journey, such as wedding planning. It features a photo of a woman trying on a dress at Kleinfeld, NYC, paired with an infographic showing 'Wedding Dresses I Tried On So Far.' Again, a sponsorship is present: 'Sponsored by Say Yes to the Dress.' This illustrates how the app bridges the gap between real-world activities and digital data visualization.
Slide 7: Brand Interaction
Slide 7 reinforces the B2B value proposition: '& Help Brands Grow and Interact with Fans.' It is a collage of 'Jersey Shore' themed infographics, including a 'Vote Now' circle chart for favorite characters and a counter for 'Times Sammie Has Broken Up With Ronnie.' This slide makes it clear that Biogrify sees itself as a second-screen companion for entertainment brands, providing a way to quantify fan sentiment and show-related data.
Slide 8: Meet the Team
The team slide features photos of the two founders, Jordan and Kristen, and illustrated avatars for the four technical and design staff. The roles listed are Founder, Co-Founder, Designer + Front-End, UX + Front-End, Rails Developer, and Designer. While it shows a complete product team, the slide lacks any text regarding the team's background, education, or previous industry experience.
Slide 9: The Transition
Slide 9 is a minimalist transition slide with the text 'Need Your Arm Twisted?' and an illustration of an arm. This serves as a rhetorical bridge to the market data slide, suggesting that the product's appeal is so strong it shouldn't require much persuasion, but the data is there regardless.
Slide 10: The Current Market
This is the only slide containing external market data. It notes that 40% of Facebook users are on another network and predicts Facebook will hit 1,000,000,000 users by the end of 2012. It concludes that based on these rates, there will be '600,000,000 users looking for new social networks in 2013.' This is a broad 'rising tide' argument rather than a specific analysis of the infographic or data-tracking market.
Slide 11: Contact Information
The final slide provides the company’s physical address at 99 Hudson Street, New York, and direct email and phone contacts for Jordan and Kristen. It is a standard closing slide that maintains the brand's visual identity.
What Works in This Deck
Visual Consistency: The deck is professionally designed and adheres strictly to the brand's aesthetic. The use of vibrant colors and clean iconography mirrors the product's core promise of making data beautiful.
Clear Product Utility: By the end of the first five slides, the reader understands exactly what the product does. The use of concrete examples (vacation countdowns, fitness tracking) makes the abstract concept of 'social infographics' tangible.
Monetization by Example: Instead of a dry slide explaining revenue streams, Biogrify shows 'Sponsored by' tags on several mockups. This demonstrates how advertising can be integrated natively into the user experience without being overly intrusive.
What Is Missing
The Ask: Perhaps the most significant omission is a funding request. The deck does not state how much money is being raised, the valuation, or what the milestones for the next 18 months look like.
Traction: There is no mention of current user numbers, beta test results, or brand partnerships that have already been signed. For a 2011 deck, even early-stage 'vanity metrics' would have helped validate the concept.
Competitive Landscape: The deck ignores competitors. In 2011, platforms like Path, Instagram, and even Pinterest were competing for 'visual social' attention. Failing to acknowledge the competitive set is a red flag for many investors.
Business Logic: The market slide (Slide 10) makes a massive leap from 'Facebook is growing' to '600 million people want a new network.' It doesn't explain why Biogrify specifically is the network they will choose.
What a Founder Should Copy
Show, Don't Just Tell: Biogrify does an excellent job of showing the product in action. Founders should copy the way they use specific, relatable use cases (like wedding planning or TV fandom) to explain their platform.
Native Ad Integration: If your business model relies on advertising, showing how those ads look within the product UI is much more effective than a bulleted list of 'Revenue Streams.'
Clean Design: The deck is not cluttered. Each slide has a single focus and uses whitespace effectively. This ensures the investor's attention is exactly where the founder wants it to be.
Frequently asked questions
- What is the primary product Biogrify is offering?
- Biogrify offers a social platform where users and brands create 'social infographics.' As stated on Slide 3, they call this 'creative communication.' The product allows users to track personal data—such as countdowns, habits, or achievements—and present them in a visually rich, shareable format that integrates with existing social behaviors.
- How does Biogrify plan to make money?
- While the deck does not have a dedicated revenue slide, the business model is demonstrated through product mockups. Slides 4 and 6 show infographics 'Sponsored by Kayak' and 'Sponsored by Say Yes to the Dress.' This suggests a B2B2C model where brands pay to provide custom tracking tools or sponsored content to engage with their fan bases.
- Who are the key people behind Biogrify?
- Slide 8 identifies Jordan as the Founder and Kristen as the Co-Founder. The supporting team includes David (Designer + Front-End), James (UX + Front-End), Kevin (Rails Developer), and Glen (Designer). The deck provides photos and titles but lacks professional biographies or past company successes.
- What market opportunity does the deck identify?
- Slide 10 focuses on the 'Current Market,' noting that 40% of Facebook users are on at least one other network. It projects that by 2013, there will be 600,000,000 users looking for new social networks, framing Biogrify as a destination for this migrating or diversifying audience.
- What critical information is missing from this pitch deck?
- The deck is missing several standard venture components: a specific funding 'ask,' a detailed use of funds, a competitive landscape analysis, and any historical traction or user growth metrics. It functions more as a product vision and design showcase than a comprehensive business plan.