Biomarker’s deck, presented during 500 Startups Batch 20, addresses the lack of objective measurement in the massive health and wellness sector. The company identifies a $3.7 trillion market filled with disparate hardware and service providers—ranging from Fitbit to Quest Diagnostics—but notes a lack of unified output analysis. Their solution is a dashboard that allows users to connect, track, and discover the efficacy of their health interventions. With an early team boasting credentials from Stanford, Google, and the NIH, the company reported $20,000 in MRR from just four customers at the t…
Key takeaways
- The company targets a $3.7 trillion global health and wellness industry as cited on slide 3.
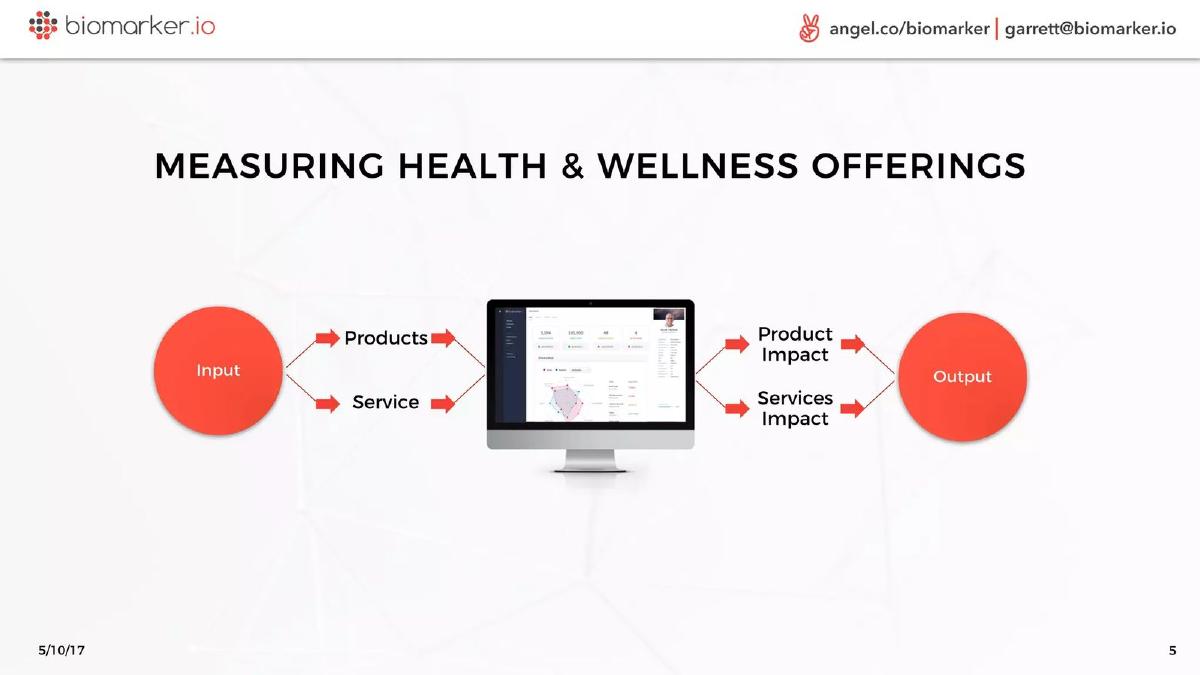
- Biomarker positions its platform as the bridge between wellness inputs (products/services) and measurable outputs (impact) on slide 5.
- The user interface focuses on three core actions: Connect, Track, and Discover, according to slide 7.
- The dashboard integrates diverse data points including heart rate (72 bpm), blood pressure (120/80), and calories burned (2,639 cal) as shown in the mockup on slide 7.
- The founding team includes a CEO, COO, two software engineers, an enterprise sales lead, and a biomedical engineer on slide 9.
- Team members bring experience from institutions such as Duke, Stanford Medicine, Google, and IBM according to slide 9.
- Early traction is defined by 4 customers generating $20,000 in Monthly Recurring Revenue (MRR) on slide 11.
- The company claims a $2 million sales pipeline to support future growth on slide 11.
Introduction and Brand Identity
Slide 1: Title Slide
The deck opens with a clean, minimalist title slide for biomarker.io. The tagline, "Connecting The Dots In Health & Nutrition," immediately establishes the company's value proposition as a data aggregator or platform. The inclusion of an AngelList link and a direct email for the CEO in the header is a standard practice for Demo Day decks, ensuring investors have an immediate path to due diligence. The logo, featuring a network of connected nodes, reinforces the theme of connectivity and data synthesis.
The Market Opportunity
Slide 3: A $3.7 Trillion Industry
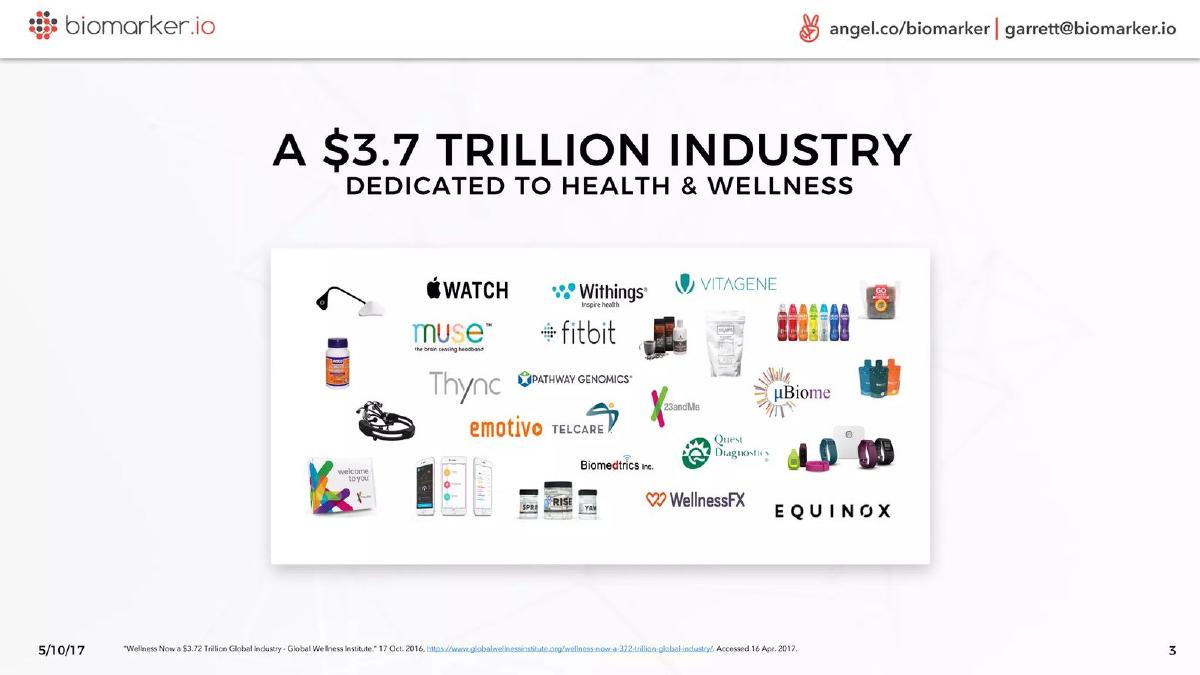
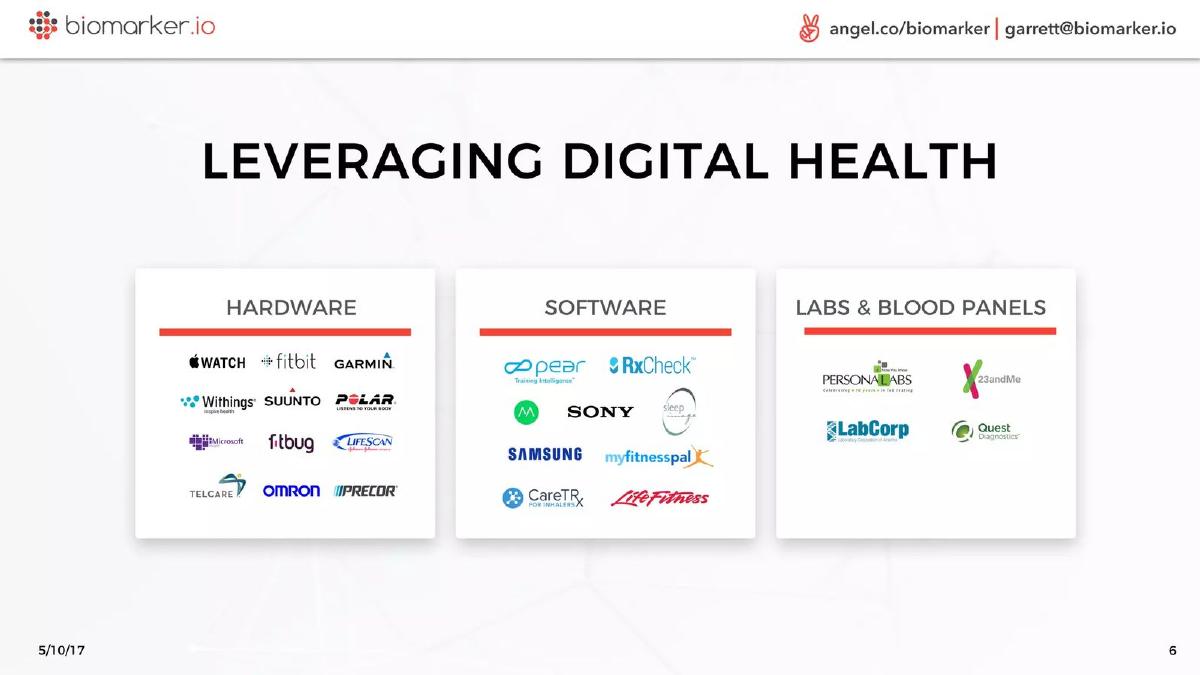
Biomarker utilizes a classic 'big number' slide to establish the scale of the opportunity. By citing a $3.7 trillion industry dedicated to health and wellness, they are positioning themselves within a massive, non-discretionary spending category. The slide is visually dense with logos of existing players, including Apple Watch, Fitbit, 23andMe, Quest Diagnostics, and Equinox. This serves two purposes: it validates the market's maturity and highlights the extreme fragmentation. The underlying message is that while these companies provide data or services, they do not talk to one another, creating a 'silo' problem that Biomarker intends to solve. The footnote cites the Global Wellness Institute as the source for the $3.72 trillion figure, lending credibility to the claim.
The Solution and Workflow
Slide 5: Measuring Health & Wellness Offerings
This slide explains the mechanics of the platform using a simple input-process-output diagram. On the left, 'Input' is split into 'Products' and 'Service.' These flow into a central dashboard (the process), which then yields 'Product Impact' and 'Services Impact' as the 'Output.' This is a critical conceptual slide because it moves Biomarker from a simple tracking app to an analytical engine. It suggests that the company isn't just collecting data; it is attributing health changes to specific interventions. For an investor, this hints at a high-value data play where Biomarker could eventually tell a user (or a provider) exactly which supplement or workout routine is actually working.
Slide 7: Customers and Product Interface
Slide 7 provides a closer look at the user experience, categorized by three verbs: Connect, Track, and Discover. The mockup shows a comprehensive dashboard for a user named Garrett T. Ruhland. Key metrics displayed include Journal Entries (3,594), Weekly Steps (105,990), Beats Per Minute (48), and Active Stacks (4). The 'Active Stacks' metric is particularly interesting, as it implies the tracking of multiple simultaneous variables, such as supplements or medications. The dashboard also features a radar chart (spider map) visualizing categories like Sleep Quality, Acute Stress, and Concentration. This slide proves the product is more than a wireframe; it is a functional interface capable of handling complex, multi-modal health data.
The Team and Execution
Slide 9: The Team Making It Happen
The team slide is structured to emphasize both individual roles and institutional credibility. The six-person core team includes Garrett T. Ruhland (CEO), Bryan M. Welker (COO), and technical staff. The right side of the slide is a 'wall of logos' representing where the team has studied or worked: Duke University, Stanford Medicine, UC San Diego, Google, NIH, and IBM. This is a high-signal slide for a health-tech startup. In a field where data privacy and clinical accuracy are paramount, having backgrounds in Stanford Medicine and the NIH (National Institutes of Health) mitigates perceived execution risk.
Traction and Financials
Slide 11: Early Traction
The final slide in the provided sequence focuses on hard metrics. Biomarker reports 4 customers, $20,000 in MRR, and a $2 million pipeline. The math here is the most revealing part of the deck: 4 customers generating $20k MRR means an average contract value (ACV) of $5,000 per month, or $60,000 per year. This confirms that Biomarker is not a $0.99 consumer app. It is an enterprise or professional-grade platform. The $2 million pipeline suggests a significant sales effort is underway, likely targeting clinics, wellness centers, or high-end coaching groups. This slide provides the 'proof of work' necessary to justify a seed-stage investment.
What Works in This Deck
Clarity of Purpose: Within six slides, the founder clearly explains the market size, the specific problem (fragmentation), the solution (impact measurement), and the current business progress. There is no ambiguity about what the company does.
High Signal Team: The combination of big-tech (Google, IBM) and top-tier medical/research institutions (NIH, Stanford) is exactly what investors look for in the 'quantified self' space.
B2B Validation: By showing a high MRR relative to the number of customers, the deck avoids the 'consumer treadmill' trap. It demonstrates that the product is valuable enough for organizations to pay a premium for it.
What Is Missing
The 'Ask': The provided slides do not include a funding request. We do not know how much they are raising or what the milestones for the next 18 months look like.
Competitive Landscape: While slide 3 shows many logos, it frames them as partners or data sources. It does not address direct competitors who are also trying to be the 'operating system for health data' (e.g., Apple Health, or other B2B aggregators).
Unit Economics: While we see MRR, we don't see the cost to acquire these customers (CAC) or the churn rate. For a B2B platform, understanding the sales cycle length is also crucial, especially with a $2M pipeline mentioned.
Founder Takeaways
Quantify the Impact: If you are building a data tool, don't just show that you can collect data. Show that you can provide an 'Output' or an 'Impact' analysis, as seen on slide 5. Investors value insights over raw data.
Focus on High-Value Traction: Biomarker could have tried to get 10,000 free users. Instead, they got 4 paying customers at $5k/month. This is a much stronger signal for a seed-stage company because it proves a willingness to pay and a clear ROI for the customer.
Use Logos Strategically: Don't just list your team; list the institutions that 'vouch' for their expertise. The logos on slide 9 do more work than the job titles themselves.
Frequently asked questions
- What problem is Biomarker solving?
- Biomarker addresses the fragmentation in the wellness industry. While trillions are spent on supplements, wearables, and services, there is rarely a unified way to measure if these 'inputs' actually result in positive health 'outputs.' The platform aggregates data from various sources to provide a single source of truth for health impact.
- Who is the target customer for Biomarker?
- While the dashboard shown on slide 7 looks like a consumer tool, the traction slide (slide 11) mentions 4 customers generating $20,000 MRR. This high revenue-per-customer ($5,000/month) suggests a B2B or B2B2C model, likely targeting wellness providers, clinics, or corporate wellness programs rather than individual retail users.
- How does the technology work?
- According to slide 7, the platform works by 'Connecting' to existing data sources, 'Tracking' metrics over time, and allowing users to 'Discover' insights. The mockup shows integrations with devices like Fitbit and Withings, alongside manual journal entries and 'active stacks' of supplements or medications.
- What is the background of the founding team?
- The team is technically and clinically heavy. It includes CEO Garrett T. Ruhland and COO Bryan M. Welker, supported by an MD/Biomedical Engineer and software engineers with pedigrees from Google, IBM, and NIH. This suggests the company is focused on high-integrity data processing and enterprise-grade software.
- Is the market opportunity clearly defined?
- The deck uses a top-down market sizing approach, citing a $3.7 trillion industry. While this shows the scale of the wellness economy, it does not define the Serviceable Addressable Market (SAM). However, by showing logos of companies like 23andMe and Equinox, they illustrate the breadth of the ecosystem they intend to unify.