The New Gold Investor Day 2016 deck is a comprehensive 97-slide operational review that prioritizes transparency in capital expenditure and resource management. With a heavy focus on its Canadian assets, particularly the Rainy River and Blackwater projects, the company uses the presentation to justify a $595 million liquidity position against significant upcoming development costs. The deck successfully bridges the gap between macro gold market trends in India and China and micro-level site construction progress. By detailing all-in sustaining costs (AISC) of $809/oz against historical perfor…
Key takeaways
- The company maintains a significant geographic focus on Canada, which accounts for 88% of gold reserves and 81% of M&I resources (Slide 51).
- Operational efficiency is highlighted by 2015 results where gold production of 436 Koz exceeded guidance (Slide 31).
- Capital allocation is heavily weighted toward growth, with $500 million of the 2016 budget dedicated to the Rainy River project (Slide 41).
- The Blackwater project summary outlines a 17-year mine life with an estimated $1,576 million in development capital (Slide 21).
- Market demand analysis focuses on India and China, noting that India represents 24% of annual global gold demand (Slide 11).
- The company reports a strong liquidity position of $595 million to cover remaining Rainy River capital needs of $590 million (Slide 71).
- Historical performance since 2009 shows a 106% return for New Gold, significantly outperforming the S&P/TSX Global Gold Index which fell by 49% (Slide 81).
- Technical transparency is provided through detailed reserve and resource notes, including specific lower cut-off grades for each mineral property (Slide 91).
Executive Summary: The Industrial Scale of Transparency
The New Gold Investor Day 2016 presentation is a technical and financial deep dive into a mid-tier mining producer. Unlike early-stage startup decks that sell a vision of the future, this deck sells the execution of the present. With 97 slides, the presentation leaves little to the imagination, providing exhaustive detail on everything from global macro trends to the specific cut-off grades of ore at individual mine sites. The narrative is one of geographic stability, operational excellence, and disciplined capital management.
Slides 1-11: Setting the Macro Stage
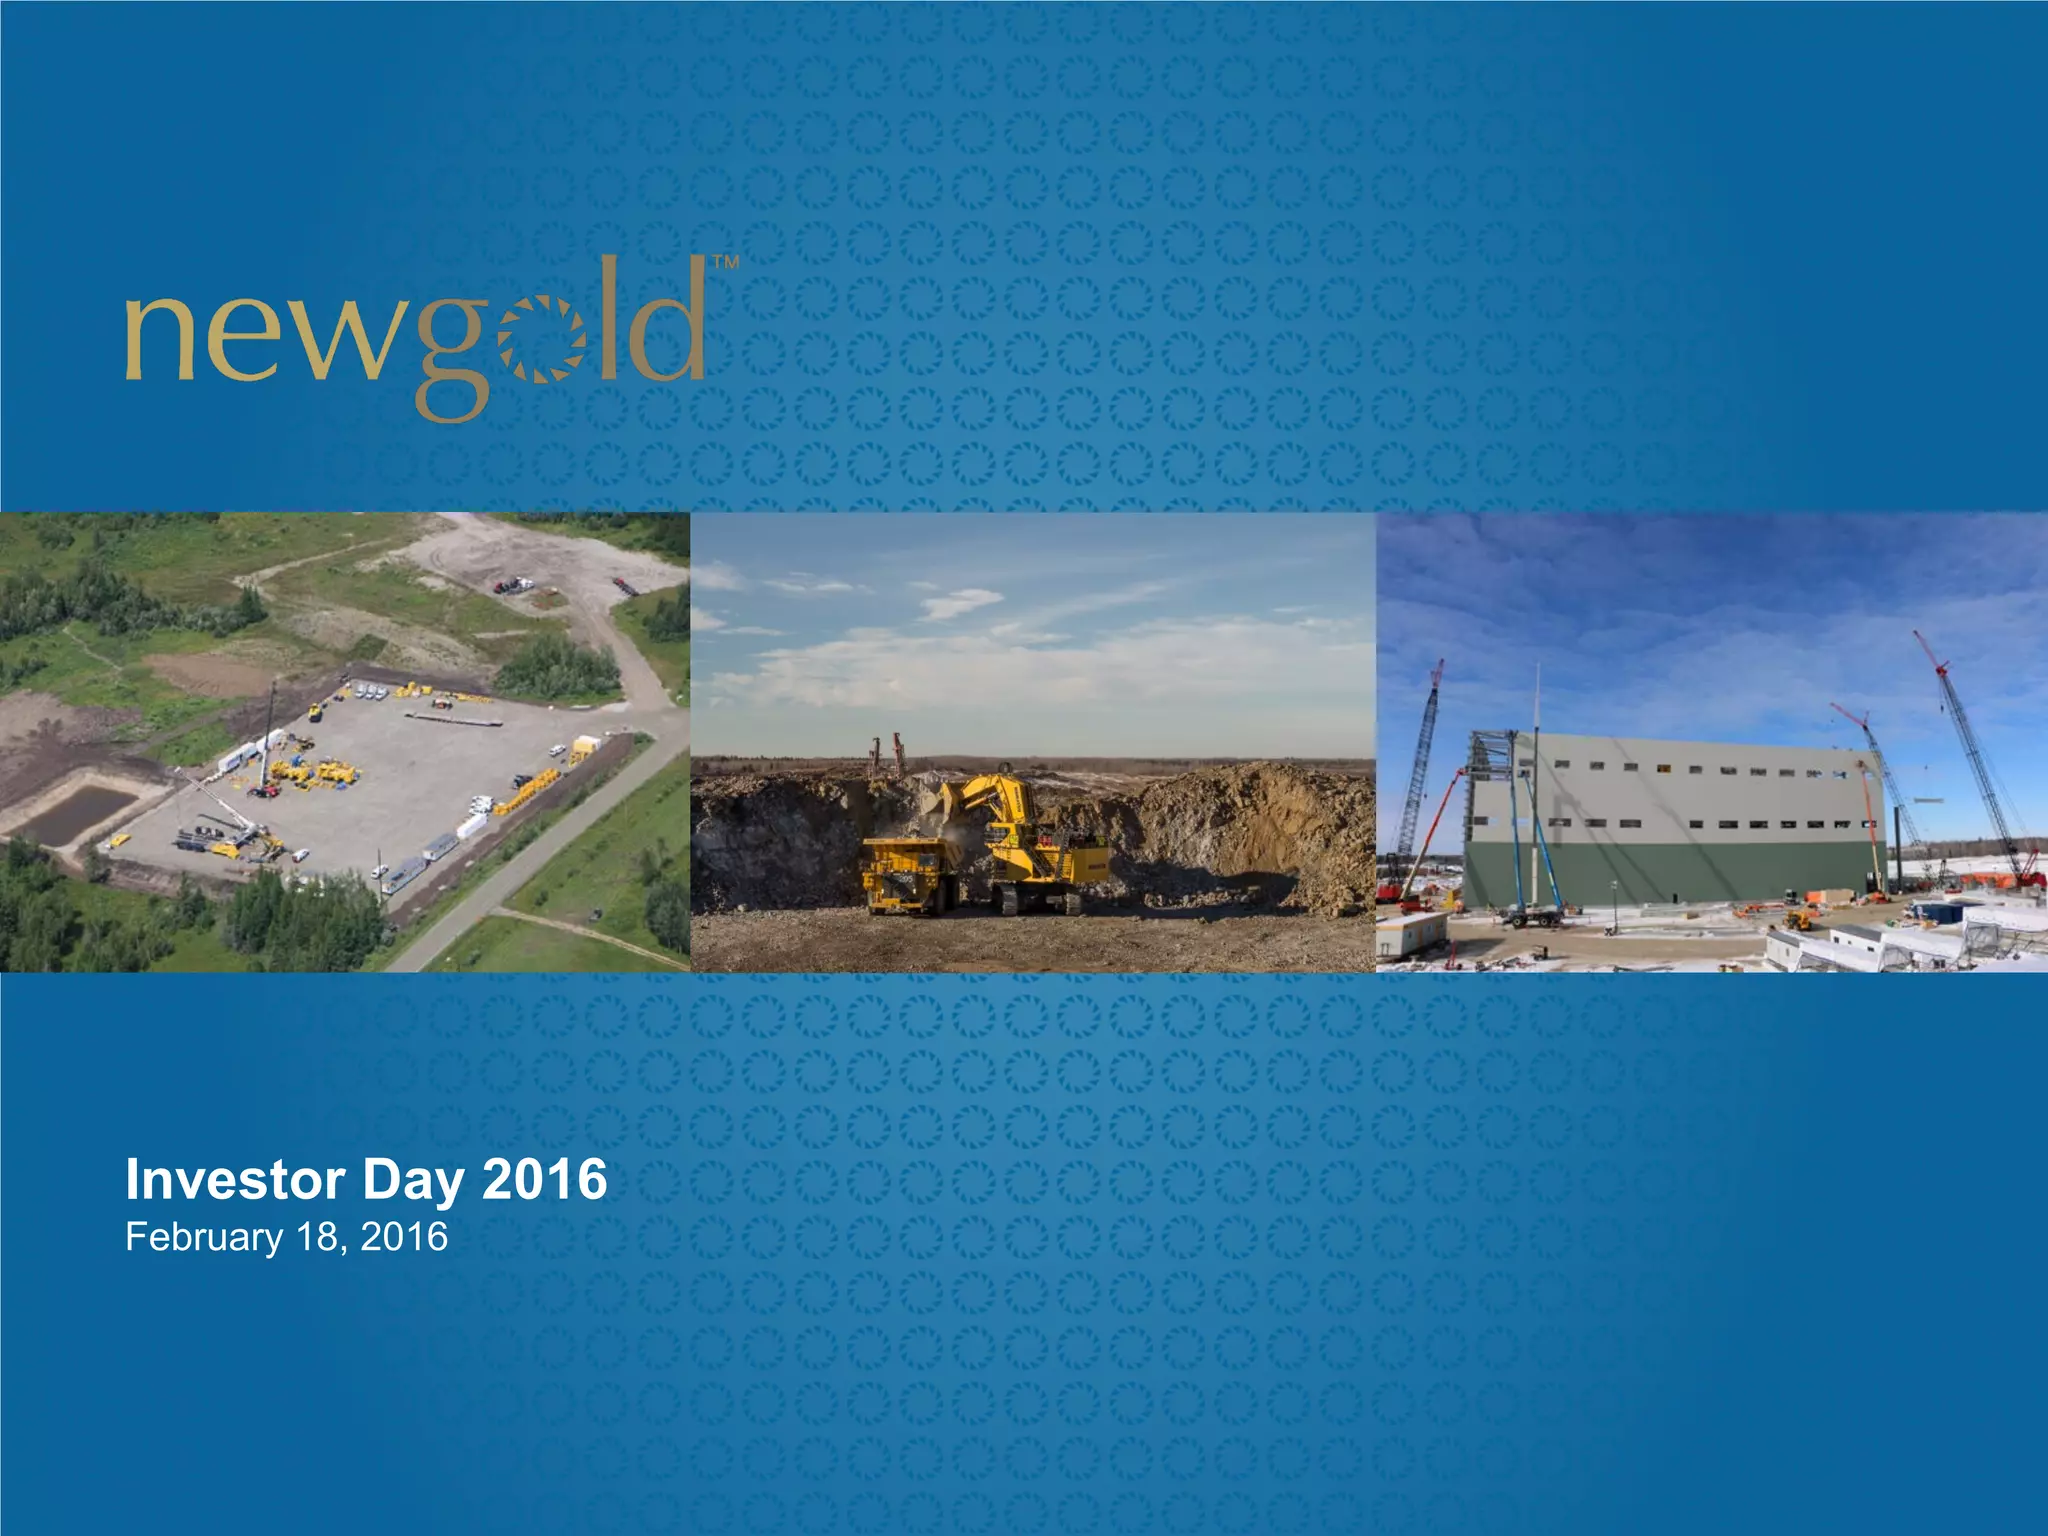
The presentation opens with high-resolution imagery of active mining sites, immediately establishing the company's identity as a tangible, asset-heavy business. The title slide (Slide 1) dates the presentation to February 18, 2016, a period of significant transition for the gold market.
Slide 11 addresses the demand side of the equation. By focusing on India and China, New Gold identifies the primary drivers of gold consumption. The slide notes that India holds 15% of the world's gold stock and represents 24% of annual global demand. For China, it highlights the transition to the world's number one market in 2013, driven by a decade of rapid growth and middle-class affluence. The inclusion of gold price charts in local currencies (Rupees and Yuan) demonstrates a sophisticated understanding of how global buyers perceive value, which is essential for a company whose revenue is entirely dependent on commodity pricing.
Slides 21-31: Project Specifics and Operational Results
Slide 21 provides a summary of the Blackwater project in British Columbia, Canada. This slide is a model for project-level reporting. It covers four critical quadrants: Jurisdiction (ranking Canada #1 for mining investment), the 2013 Feasibility Study (projecting a 17-year mine life), Resource totals (8.2 Moz of Gold Reserves), and the 2016 Plan. By stating an All-in Sustaining Cost (AISC) of $590/oz for the first nine years, New Gold positions Blackwater as a high-margin future asset.
Slide 31 shifts from future projects to past performance, detailing the 2015 consolidated operational results. The company reports 436 Koz of gold production, which 'exceeded guidance.' This is a crucial phrase in investor relations; it builds credibility. The slide also lists AISC at $809/oz. In the context of 2016 gold prices, this figure tells investors exactly how much breathing room the company has before it stops being profitable. The use of color-coded boxes for gold, silver, and copper production helps distinguish the different revenue streams of what is primarily a gold company.
Slides 41-51: Capital Allocation and Resource Geography
Slide 41 is perhaps the most important slide for a capital-intensive business. It breaks down the 2016 capital expenditures by category across five different mines: Rainy River, Mesquite, New Afton, Peak Mines, and Blackwater. The dominance of Rainy River is clear, with a $500 million allocation. The slide distinguishes between 'Growth capital' and 'Sustaining capital,' allowing investors to see how much money is being spent to maintain current operations versus how much is being invested in future capacity. This level of transparency is vital for assessing the company's burn rate and long-term viability.
Slide 51 reinforces the 'Safe Jurisdiction' thesis. It shows that 88% of Gold Reserves and 81% of M&I (Measured and Indicated) Resources are located in Canada. In a sector often plagued by geopolitical instability in emerging markets, New Gold uses this geographic concentration as a competitive advantage. The pie charts are simple and effective, highlighting that while they have assets in the USA and Australia, the core of the company's value is firmly rooted in Canadian soil.
Slides 61-71: Physical Progress and Financial Health
Slide 61 moves away from spreadsheets and into the field. By showing construction photos of the Rainy River plant site from December 2015 and February 2016, the company provides visual proof of progress. For an investor, seeing a building go from a steel skeleton to a walled structure in two months is a powerful indicator of project management efficiency. It reduces the perceived risk of 'stalled projects' that often haunt the mining sector.
Slide 71 addresses the balance sheet. The company presents a 'Liquidity Position' of $595 million, composed of cash, undrawn credit, and remaining stream proceeds. Crucially, it places this figure directly next to the 'Remaining Rainy River capital of $590 million.' This is a 'fully funded' argument. By showing that their liquidity almost exactly matches their largest upcoming capital requirement, they signal to the market that they do not need to raise equity at potentially unfavorable terms to finish the project.
Slides 81-91: Value Creation and Technical Footnotes
Slide 81 is the 'Victory Lap' slide. It compares New Gold's performance since 2009 against the Gold Price and the S&P/TSX Global Gold Index. The data is stark: New Gold rose 106%, while the index fell 49%. This 155% outperformance is the ultimate justification for the management team's strategy. It suggests that even in a down market for the sector, New Gold's specific asset selection and operational execution have delivered alpha to shareholders.
Finally, Slide 91 provides the technical 'Reserves and resources notes.' While often ignored by casual observers, this slide is mandatory for regulatory compliance and for institutional analysts. It lists the metal price assumptions ($1,200/oz gold for reserves) and the exchange rates used for calculations. This ensures that the data presented in the previous 90 slides is grounded in a consistent, disclosed methodology.
What New Gold Does Well
The deck excels at jurisdictional de-risking . By repeatedly emphasizing their Canadian assets, they appeal to conservative institutional capital. They also master the linkage of liquidity to liability ; by showing exactly how they will pay for their largest project (Rainy River), they remove a major source of investor anxiety. Furthermore, the use of comparative performance metrics on Slide 81 provides a clear 'Why Us' argument that is backed by seven years of data rather than just marketing slogans.
What is Missing
Despite its length, the deck is light on detailed ESG (Environmental, Social, and Governance) metrics , which, even in 2016, were becoming increasingly important. While they mention environmental assessments, a dedicated slide on water usage, community relations, or carbon footprint is absent from this selection. Additionally, there is no sensitivity analysis showing how a $100 drop in the price of gold would impact their liquidity position—a common request from stress-testing analysts.
Founder's Playbook: Lessons from New Gold
Match your 'Ask' to your 'Liquidity': If you are raising money for a specific milestone, show exactly how your current cash plus the new raise covers that milestone to the dollar, as seen on Slide 71. · Use Visual Proof: If you are building a physical product or infrastructure, use time-lapse or sequential photos (Slide 61) to prove that 'work is happening.' It is more convincing than a Gantt chart. · Benchmark Against the Bottom: Don't just show that you are up; show that you are up while your competitors are down (Slide 81). This proves that your success is due to your strategy, not just a rising tide in the industry. · Address the Macro: Even if you are a small player, show that you understand the global forces (Slide 11) that drive your customers. It demonstrates that you aren't operating in a vacuum.
Frequently asked questions
- How does New Gold justify its capital expenditure for 2016?
- New Gold justifies its $500 million spend on Rainy River by showing clear construction progress and a path to production. Slide 41 breaks down the costs into mining, infrastructure, and process facilities ($405 million) versus owners' costs ($95 million). By pairing this with Slide 71, which shows a liquidity position of $595 million, they demonstrate that the project is fully funded without needing immediate external dilutive capital.
- What is the significance of the India and China market data?
- Slide 11 serves as the 'Market Opportunity' or 'Macro' slide. By highlighting that India accounts for 24% of global demand and China became the number one market in 2013, New Gold anchors its production goals in global consumption trends. This suggests that despite price volatility, the underlying demand from the world's two largest consumers remains structurally sound due to 'traditional affinity' and 'middle class affluence.'
- What are the key operational metrics for a mining company according to this deck?
- The deck focuses on three primary pillars: Production volume (Koz for gold, Moz for silver), All-In Sustaining Costs (AISC), and Reserves/Resources. Slide 31 shows an AISC of $809/oz for 2015. For an investor, the gap between this cost and the spot price of gold represents the margin. Slide 51 further qualifies this by showing where those reserves are located, prioritizing 'safe' jurisdictions like Canada.
- How does the company communicate project risk and progress?
- New Gold uses a combination of technical data and visual evidence. Slide 61 shows side-by-side construction photos from December 2015 to February 2016 to prove physical progress at Rainy River. Meanwhile, Slide 21 uses a '2016 Plan' box to highlight regulatory milestones, such as completing the Federal Environmental Assessment process, which is a critical de-risking event for mining investors.
- Is the company's historical performance a reliable indicator of future value?
- Slide 81 makes a strong case for management's ability to create value, showing a 10.9% CAGR since 2009 compared to a -9.1% CAGR for the broader gold index. However, the deck also notes on Slide 71 that they have $590 million in remaining capital to spend on Rainy River alone. The 'value creation' narrative is used to build trust that management can successfully execute these large-scale, capital-intensive projects.