Launch Sequencing Slide Examples: How Startups Show Which
How to present a phased launch plan in a pitch deck: what each phase must prove, what triggers the next market, and how to show launches already done.
Launch Sequencing Slide: Show What Each Phase Proves Before the Next One Starts
Many decks contain a row of arrows labelled Phase 1, Phase 2, Phase 3. Investors read that row with one question: why this order, and what has to be true before you move on? A beachhead slide answers where you start. A launch sequencing slide answers what happens after the start: which market or customer group comes next, when, and on what evidence. This guide uses five real slides, from a property company that lists six city launches with dates and coverage to plans where each phase is just a bigger user number.
TL;DR
Show each phase with three things: the market or customer group, the date, and what the phase must prove before the next one begins. Launches already done should carry dates and a result. Propertymate lists six cities with launch months, from Austin in December 2020 to Tampa in October 2022, and a share of new-home inventory covered in each. Go Go Cannabiz ties its second state to 400 Oklahoma subscribers and $250,000 of subscription revenue. Verdis defines its phases by the evidence it will have, from named prospects to working units. HomeCooks and Roommatefax show dates and growing targets, but no reason why each step follows the last.
Five launch sequencing slides, read in full
Each example quotes the slide text, separates the company's claims from what the slide shows, and notes what to copy and what to avoid.
Propertymate (NewHomeMate) go to market slide — slide 10
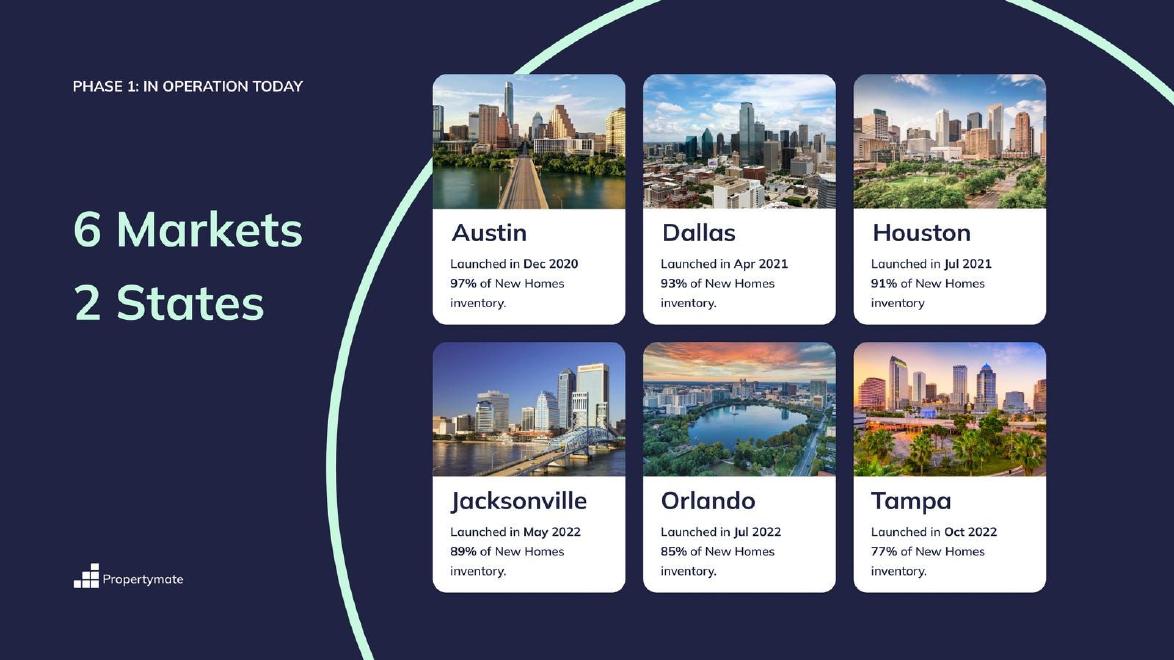
New-home search service. Slide headed "Phase 1: In operation today".
Propertymate (NewHomeMate) deck, slide 10. Exact stored slide matched to this analysis.
Our analysis: A completed sequence: three Texas cities, then three Florida cities, with gaps of 4, 3, 10, 2 and 3 months (our calculation).
Evidence and limitation: Company-reported launch dates and coverage; coverage method and usage not given.
What a founder can adapt: State what a city must reach before the next one opens, and how long it takes.
Supporting analysis
What the deck claims: "6 Markets 2 States"; Austin "Launched in Dec 2020", "97% of New Homes inventory"; Dallas Apr 2021, 93%; Houston Jul 2021, 91%; Jacksonville May 2022, 89%; Orlando Jul 2022, 85%; Tampa Oct 2022, 77%.
Presentation choice: Investors can see the order and pace of launches that already happened.
When it does not fit: Leaving investors to guess what the coverage figure measures.
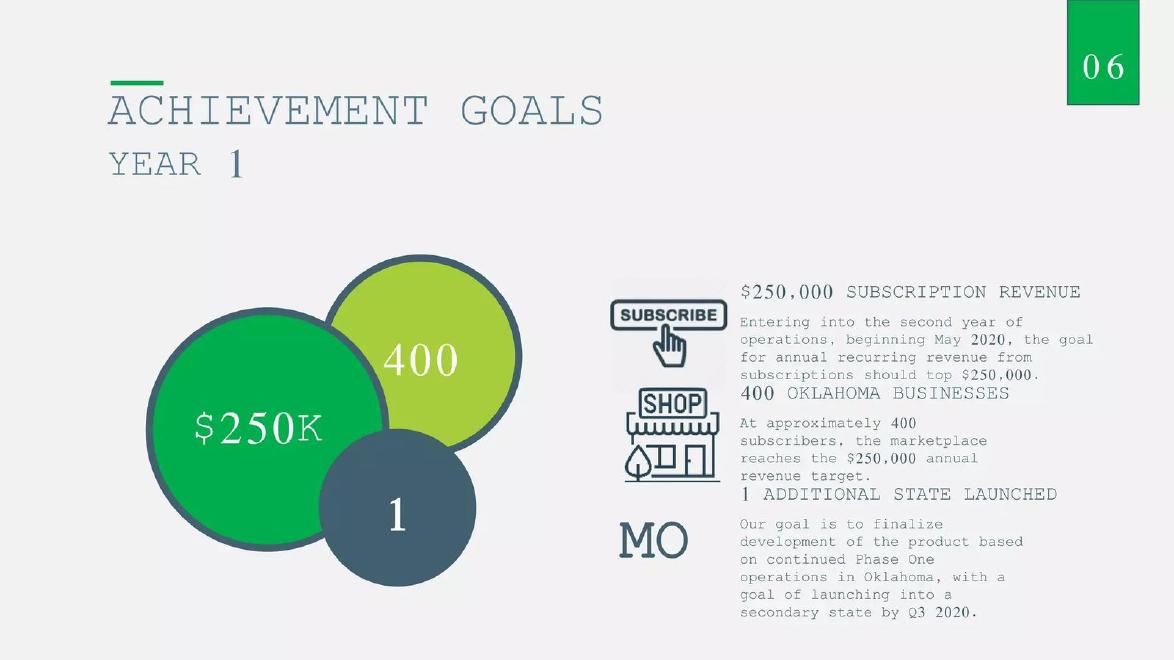
Marketplace for cannabis businesses. Slide headed "Achievement goals, Year 1".
Go Go Cannabiz deck, slide 7. Exact stored slide matched to this analysis.
Our analysis: Next market tied to a first-market target; implied revenue about $625 per subscriber a year (our calculation).
Evidence and limitation: Targets, not results; next state shown as MO.
What a founder can adapt: Make the trigger checkable: open state two when Oklahoma reaches a stated paid count.
Supporting analysis
What the deck claims: "$250,000 subscription revenue"; "400 Oklahoma businesses"; "at approximately 400 subscribers, the marketplace reaches the $250,000 annual revenue target"; "1 additional state launched": "launching into a secondary state by Q3 2020", based on "continued Phase One operations in Oklahoma".
Presentation choice: One market, a subscriber count, a revenue figure and a named next state.
When it does not fit: A trigger such as "finalize development" that nobody can measure.
Verdis deck, slide 32. Exact stored slide matched to this analysis.
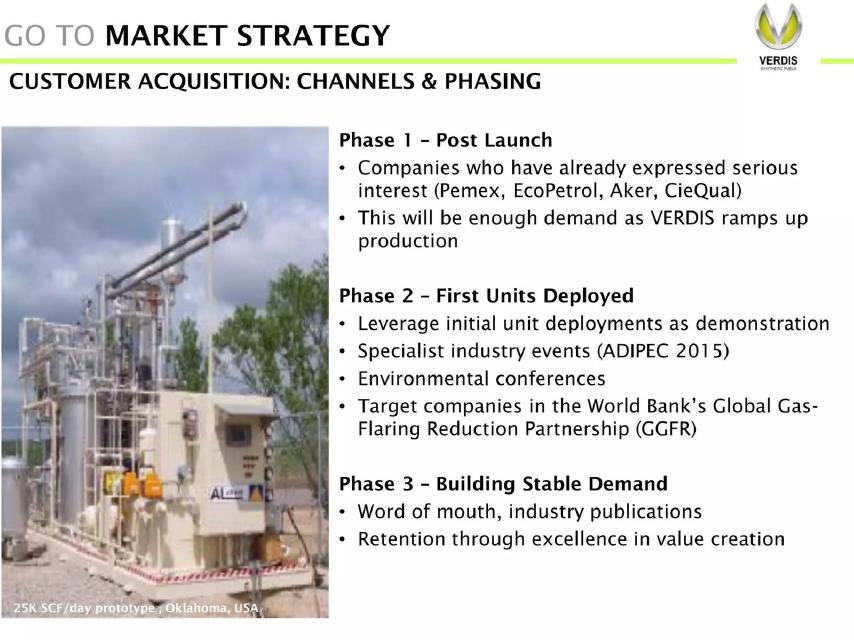
Our analysis: Phases defined by the evidence the company will hold, not by dates.
Evidence and limitation: Named prospects at an unstated stage; no volumes.
What a founder can adapt: Give each prospect's stage and the units Phase 1 must sell before Phase 2.
Supporting analysis
What the deck claims: Phase 1 "Post Launch": "Companies who have already expressed serious interest (Pemex, EcoPetrol, Aker, CieQual)"; "This will be enough demand". Phase 2 "First Units Deployed": demonstrations, "ADIPEC 2015", GGFR partnership companies. Phase 3 "Building Stable Demand": word of mouth, publications.
Presentation choice: Each phase produces the proof the next phase sells with.
When it does not fit: Calling four prospects "enough demand" without a volume.
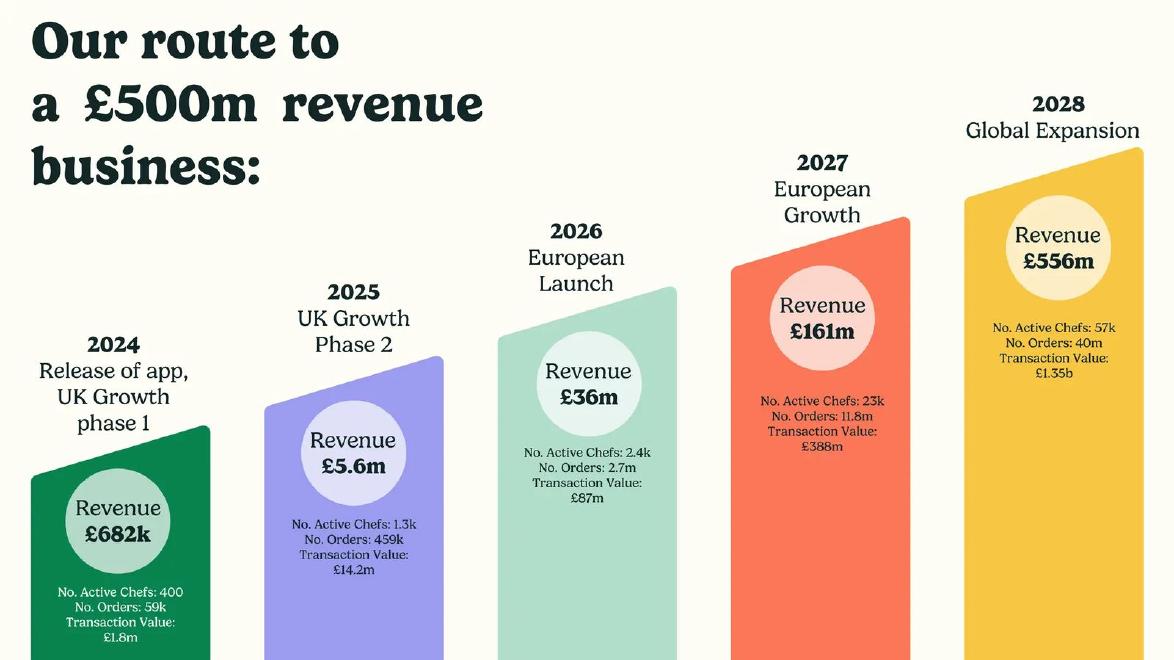
Home-cooked meal marketplace. Slide headed "Our route to a £500m revenue business".
HomeCooks deck, slide 22. Exact stored slide matched to this analysis.
Our analysis: Revenue is 38–41% of transaction value each year; European launch year has revenue up more than 6 times with chefs up less than 2 times (our calculations).
Evidence and limitation: All forecasts; revenue definition not given.
What a founder can adapt: Add the UK result that justifies opening Europe.
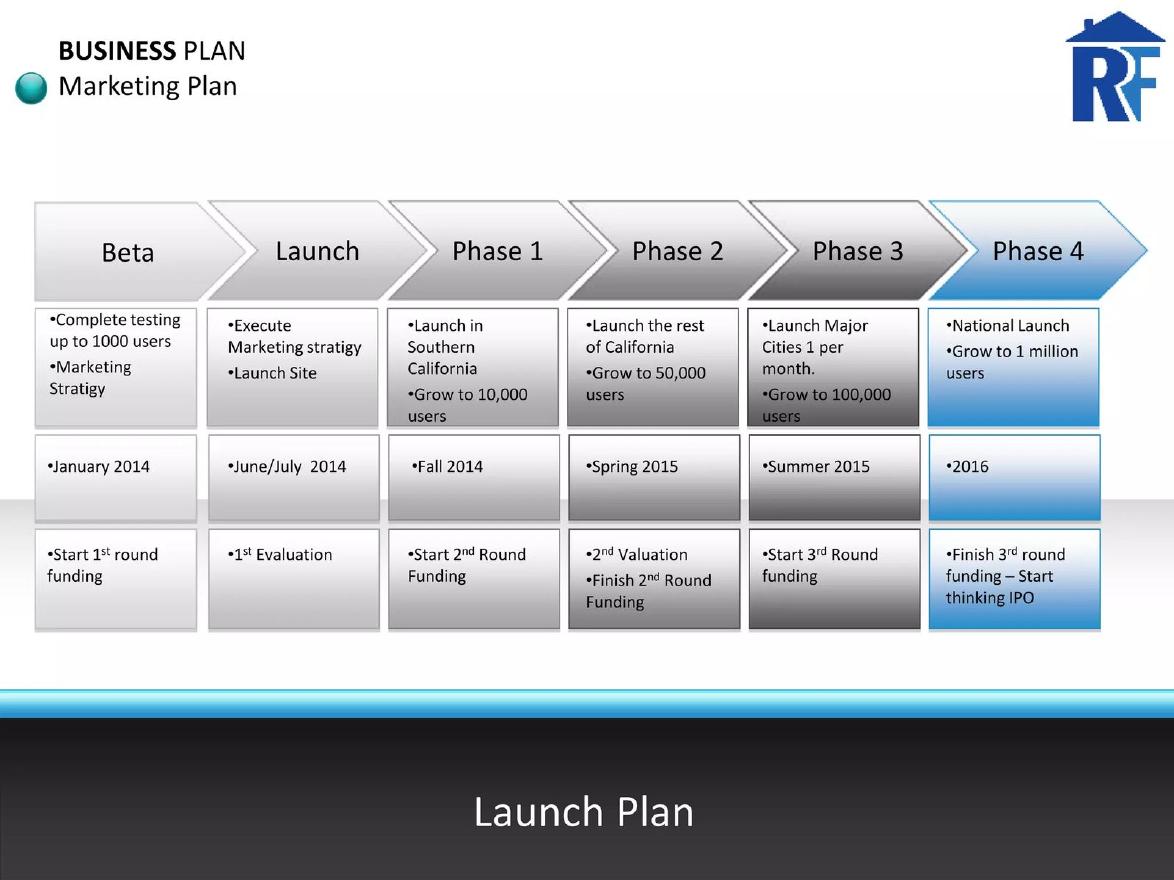
Roommatefax deck, slide 19. Exact stored slide matched to this analysis.
Our analysis: Clear geographic order and funding links, but each phase just multiplies users.
Evidence and limitation: Plan only; no channel, budget or retention.
What a founder can adapt: Add the condition each region must meet before the next opens.
Supporting analysis
What the deck claims: Beta Jan 2014, "up to 1000 users"; Phase 1 Fall 2014 "Launch in Southern California", "Grow to 10,000 users"; Phase 2 Spring 2015 "rest of California", 50,000; Phase 3 Summer 2015 "Major Cities 1 per month", 100,000; Phase 4 2016 "National Launch", "1 million users", "Start thinking IPO".
Presentation choice: Shows the order of regions and which round funds which phase.
When it does not fit: Targets that jump tenfold with no channel behind them.
Whether each slide shows completed launches, dates, and a test for moving to the next phase.
Example
Completed launches
Dates
Test for next phase
Propertymate
6 cities with coverage
Month per city
Not stated
Go Go Cannabiz
Oklahoma (no result shown)
Q3 2020 next state
400 subscribers, $250k (link unclear)
Verdis
None
Partial
Evidence per phase, no volumes
HomeCooks
None
Year per region
None
Roommatefax
None
Season per phase
None
Key Takeaways
Each phase needs a market, a date and a test.
Say what result unlocks the next phase.
Show completed launches with dates and a result.
A bigger number is not a reason to move on.
Keep projected phases visibly separate from done ones.
Build your launch sequencing slide
Answer these before you draw any arrows.
Done. Where have you launched, when, and what one result did each market reach?
Rule. What result must a market reach before you open the next one?
Next. Which market or customer group comes next, when, and why that one?
Funding. Which phases does this round pay for, and what will be proved by the next raise?
Copyable framework: Done: [market] launched [month], now [result]. We open the next market when the current one reaches [test], which took [time] last time. Next: [market] in [quarter], because [reason]. This round funds [phases].
Illustrative example 1 — written by us
Before: Phase 1: launch locally. Phase 2: expand regionally. Phase 3: go national and reach 1 million users.
After: Done: Leeds launched March, now 1,200 paying households, 62% reorder monthly. We open a new city when the last one passes 1,000 paying households and 55% monthly reorders, which took 7 months in Leeds. Next: Manchester in Q2, because 18% of current orders already come from there. This round funds Manchester and Sheffield.
What improved: Our illustrative rewrite; all figures are invented for the example. It shows a completed launch, a checkable rule for moving on, a reason for the next market and what the round pays for.
The question this guide answers
Founders usually know where they want to end up: national, European, global. The launch sequencing slide has to explain the route. Investors use it to judge three things. First, whether the founder has chosen an order for a reason, such as a market where the team already has customers or where regulation is simpler. Second, whether the company will learn something in each phase that makes the next one cheaper or safer. Third, whether the money being raised matches the phases it is supposed to fund.
This is a different question from the ones answered elsewhere in the library. The beachhead guide covers how to choose and size the first market. The international expansion guide covers moving into other countries. The roadmap guide covers product features over time. Here the subject is the order of launches, and the rule that moves the company from one launch to the next. That rule is what most phase slides leave out.
How we chose and read the examples
We searched the extracted text of the slide library for slides that set out launches or customer-acquisition steps in numbered phases, then read each candidate at full size. We kept five slides that between them show the main ways founders present a sequence: launches already completed, a next market tied to a stated target, phases defined by evidence, a financial forecast split into regions, and a user-growth timeline tied to funding rounds. We did not look for more companies once each lesson had a clear example.
We quote the text visible on each slide. We have not checked any company's launch dates, coverage, revenue or user figures against other sources, and we make no claim that any slide affected a fundraising result. Where we work out a figure, such as the months between launches or the revenue per subscriber, we say so and show the arithmetic.
Show launches already done, with dates and a result
Propertymate's slide is headed "Phase 1: In operation today" and states "6 Markets 2 States". Each city has its own card with a launch month and a coverage figure: Austin "Launched in Dec 2020", 97% of new homes inventory; Dallas, April 2021, 93%; Houston, July 2021, 91%; Jacksonville, May 2022, 89%; Orlando, July 2022, 85%; Tampa, October 2022, 77%.
This is the strongest kind of evidence a sequencing slide can carry: the sequence has already happened. Investors can see the order (three Texas cities, then three Florida cities) and the pace. Working from the dates on the slide, the gaps between launches were 4, 3, 10, 2 and 3 months. The ten-month gap between Houston and Jacksonville marks the move into a second state; after it, the three Florida cities launched within five months.
The coverage figures also fall in the order the cities launched, from 97% in the oldest market to 77% in the newest. That pattern is consistent with coverage building over time in each city, but the slide does not say so, and it does not say how coverage is counted or what share of buyers use the service. A founder with a slide like this should add one line explaining what a new city needs to reach before the next one starts, for example a coverage level or a revenue figure, and how long the latest cities took to reach it. That turns a list of launches into a repeatable method, which is what investors are paying to scale.
Tie the next market to a stated target
Go Go Cannabiz, a marketplace for cannabis businesses, uses a slide headed "Achievement goals, Year 1" with three figures: "$250,000 subscription revenue", "400 Oklahoma businesses" and "1 additional state launched". The text links them. Entering its second year of operations from May 2020, the goal for subscription revenue "should top $250,000"; "at approximately 400 subscribers, the marketplace reaches the $250,000 annual revenue target"; and the company aims "to finalize development of the product based on continued Phase One operations in Oklahoma, with a goal of launching into a secondary state by Q3 2020". The state abbreviation shown next to that goal is MO.
The structure is useful: one market, a subscriber count, a revenue figure and a named next state. The revenue and subscriber goals together imply about $625 per subscriber per year ($250,000 divided by 400), a figure the founder could state directly. The weakness is the trigger. The second-state launch depends on finalizing the product "based on continued Phase One operations", which is not a test anyone can check. It is also scheduled for Q3 2020, a few months into a year whose revenue target runs to the following spring, so the slide does not make clear whether the 400 subscribers must be reached before the second state opens. A clearer version would say: we open the second state when Oklahoma reaches a stated number of paying subscribers, or a stated renewal rate, whichever is the real test.
Define phases by the evidence each one creates
Verdis, which converts flared gas into synthetic fuel, titles its slide "Customer acquisition: channels & phasing". Phase 1, "Post Launch", targets "Companies who have already expressed serious interest (Pemex, EcoPetrol, Aker, CieQual)" and states "This will be enough demand as VERDIS ramps up production." Phase 2, "First Units Deployed", will "Leverage initial unit deployments as demonstration", attend specialist industry events ("ADIPEC 2015") and environmental conferences, and target companies in the World Bank's Global Gas-Flaring Reduction Partnership. Phase 3, "Building Stable Demand", relies on word of mouth, industry publications and "Retention through excellence in value creation".
The phases are not named after dates or regions but after what the company will have in hand: named prospects, then working units it can show, then a reputation. For an industrial product with long sales cycles, that is a sensible way to order a launch, because each phase produces the proof the next one sells with. The slide's picture caption, "25K SCF/day prototype, Oklahoma, USA", hints at the scale of the unit.
Two pieces are missing. The slide does not say what stage each named prospect has reached; "expressed serious interest" could mean one meeting or a signed letter of intent. And the claim that four prospects are "enough demand" has no volume behind it, so investors cannot tell how many units Phase 1 is expected to sell or when Phase 2 begins. Our climate go-to-market guide uses the same slide to discuss naming buyers; here the lesson is the structure of the phases themselves.
A forecast split into regions is not yet a sequence
HomeCooks, a marketplace for home-cooked meals, shows "Our route to a £500m revenue business" as five rising columns. 2024, "Release of app, UK Growth phase 1": revenue £682k, 400 active chefs, 59k orders, £1.8m transaction value. 2025, "UK Growth Phase 2": £5.6m revenue, 1.3k chefs, 459k orders, £14.2m transaction value. 2026, "European Launch": £36m revenue, 2.4k chefs, 2.7m orders, £87m. 2027, "European Growth": £161m, 23k chefs, 11.8m orders, £388m. 2028, "Global Expansion": £556m, 57k chefs, 40m orders, £1.35b.
Each column carries the same four measures, which makes the slide easy to read, and the regions follow a clear order: UK, then Europe, then the world. But every figure is a forecast, and the slide gives no reason why Europe opens in 2026 or what the UK must show first. Two calculations from the slide's own figures are worth noticing. Revenue is between 38% and 41% of transaction value in every year (for example £682k of £1.8m, and £556m of £1.35b), and the slide does not say what revenue includes. And the European launch year multiplies revenue by more than six while active chefs less than double (1.3k to 2.4k), which means orders per chef must rise sharply; the slide does not explain how.
A founder presenting a regional forecast like this should add the test for each move: for example, the UK order volume or chef retention that justifies spending on a second country, and how much of the round is reserved for the launch.
A timeline of user targets and funding rounds
Roommatefax, a roommate-matching service, calls its slide "Launch Plan". Six arrows run from Beta to Phase 4, each with a step, a date and a funding event. Beta, January 2014: "Complete testing up to 1000 users", "Start 1st round funding". Launch, June/July 2014: "Execute marketing strategy", "Launch site". Phase 1, Fall 2014: "Launch in Southern California", "Grow to 10,000 users", "Start 2nd round funding". Phase 2, Spring 2015: "Launch the rest of California", "Grow to 50,000 users". Phase 3, Summer 2015: "Launch major cities 1 per month", "Grow to 100,000 users". Phase 4, 2016: "National launch", "Grow to 1 million users", "Finish 3rd round funding – Start thinking IPO".
The geography has a logic, from one region to one state to major cities to national, and linking each phase to a funding round shows the founder has thought about money. What the slide lacks is any reason the targets are reachable or any condition for moving on. Each phase simply multiplies the user count: 10 times from Beta to Phase 1, 5 times, 2 times, then 10 times again from 100,000 to 1 million. There is no channel, budget or measure of whether users stay, so investors cannot tell whether Southern California needs to work before the rest of California starts, or whether the dates hold regardless. The slide's spelling errors ("stratigy") also cost credibility on the one slide meant to show planning discipline.
Comparing the five approaches
Set side by side, the slides fall into two groups. Propertymate, Go Go Cannabiz and Verdis each give investors something to test: completed launch dates and coverage, a subscriber and revenue target with a named next state, or a phase defined by evidence the company will hold. HomeCooks and Roommatefax give an order and a set of dates, but every step is a forecast and none says what has to happen first.
No slide in this set does everything. The strongest plan would combine Propertymate's record of completed launches with an explicit rule like the one Go Go Cannabiz points towards, and Verdis's idea that each phase should produce the evidence that sells the next.
How to build your own launch sequencing slide
Start with what has already happened. If you have launched anywhere, list each launch with its month and one result measured the same way for every market. Then state your rule for moving on in a single sentence: the result a market must reach, and roughly how long that has taken so far. Only then show the next phases, each with a market, a target date and the test it must pass.
Mark forecast phases clearly, for example in a lighter colour or under a heading such as "Planned", so investors never confuse a projection with a launch. Link the phases to the round: say which phases this money pays for and what the company will have proved by the time it raises again. If a phase depends on something outside your control, such as a licence, a partner or a regulation change, name it on the slide.
Finally, cut phases you cannot defend. Two or three phases with clear tests are more convincing than six arrows ending in an IPO.
Common mistakes
Phases without a test. Say what result unlocks the next phase.
Growth as the only reason. Explain why the next market follows the last.
Forecasts shown as plans done. Separate completed launches from projected ones.
Undefined measures. Explain coverage, revenue or "interest" in one line.
Too many phases. Two or three defensible phases beat six arrows.
Diagnostic checklist
Completed launches dated with one result each.
Rule for opening the next market stated.
Next market named with a reason.
Forecast phases visibly marked.
Phases linked to the round.
Frequently asked questions
What is a launch sequencing slide?
A slide that shows the order in which a startup will open markets or customer groups, with dates and the condition for moving from one to the next.
How is it different from a beachhead slide?
A beachhead slide explains the first market. A sequencing slide explains what comes after it and what must happen before each move.
What if I have not launched anywhere yet?
Define each phase by what it must prove, as Verdis does with prospects, then working units, then reputation, and add a figure for each test.
How we chose these examples
Corpus: published pitch deck teardowns on StartupFundraising.com. Founder-uploaded private decks are excluded.
Selection (2026-10-01): we searched extracted slide text for slides setting out launches or customer acquisition in numbered phases, read candidates at full size, and kept five slides that each show a distinct way of presenting a sequence. The Verdis slide also appears in a separate draft guide for a different lesson.
Review: all five stored slide images were read at full size on 2026-10-01 against company, deck and slide number, and our calculations were checked against the visible figures (editorial model review, with AI assistance in drafting). No person has yet completed an editorial review of this page. We did not verify any company's dates, coverage, revenue or user figures.