Pitch Deck Roadmap Slides: Real Examples and What Works
How real startups show the roadmap or milestones slide: dated metrics, funding stages, quarterly plans, expansion lists and phased theses.
Pitch Deck Roadmap Slides: Real Examples and What Works
Seven roadmap and milestone slides from real decks, shown in full, compare how founders show what they have done, what comes next, and what the money is expected to achieve. Two production-capacity slides then show how hardware and manufacturing companies separate what they can make today from what they plan to make.
TL;DR
A roadmap slide should show the next few milestones an investor can hold you to, with dates and, ideally, the metric each one moves. The examples below take five approaches: dated metric milestones, milestones tied to funding stages, a quarter-by-quarter plan, an expansion list, and a phased thesis. The most useful ones separate what is done from what is planned and connect the plan to this round. A list of features or a long-range vision with no dates tells an investor much less.
Roadmap and milestone slides from real pitch decks
Each example shows the exact stored slide above its analysis and links to the full teardown. Figures and dates are the companies' own; we have not verified them. Stage and year are not recorded in our collection for these decks unless the slide itself shows a date.
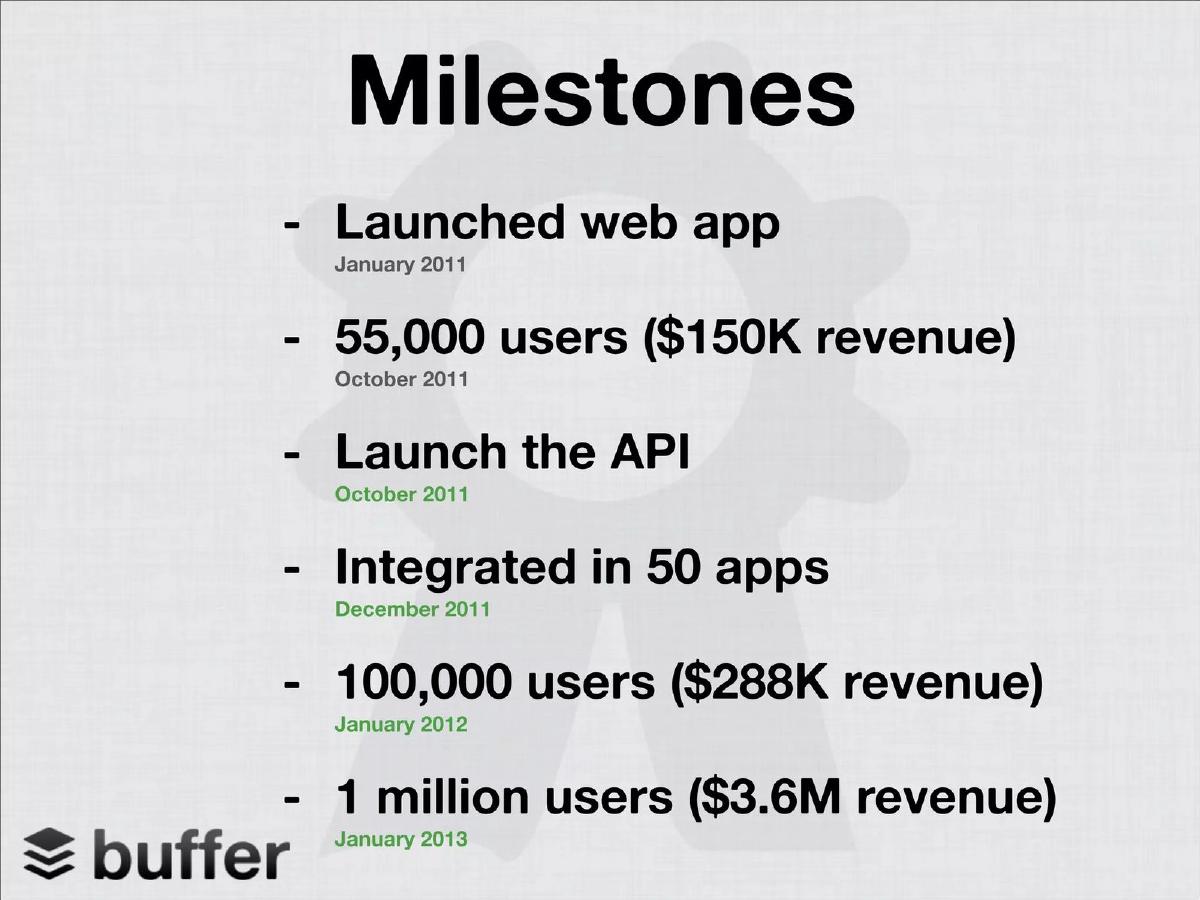
Buffer roadmap slide — slide 6
Social media scheduling. Deck year not recorded; the slide's dates run from January 2011 to January 2013.
Buffer deck, slide 6. Exact stored slide matched to this analysis.
Our analysis: Each line carries a date and most carry a user or revenue figure, so the slide reads as a growth curve without a chart. Product milestones (the API) sit next to the metrics they are meant to drive.
Evidence and limitation: Nothing on the slide separates achieved lines from targets; the tense changes ("launched" versus "launch") are the only hint. Mark planned milestones clearly so an investor does not mistake a goal for a result.
What a founder can adapt: Write each milestone as "[event or metric] by [month, year]" and include at least one revenue or usage number.
Supporting analysis
What the deck claims: "Milestones", six dated lines: launched web app (January 2011); 55,000 users ($150K revenue) (October 2011); launch the API (October 2011); integrated in 50 apps (December 2011); 100,000 users ($288K revenue) (January 2012); 1 million users ($3.6M revenue) (January 2013).
Presentation choice: Each line carries a date and most carry a user or revenue figure, so the slide reads as a growth curve without a chart. Product milestones (the API) sit next to the metrics they are meant to drive.
When it does not fit: Nothing on the slide separates achieved lines from targets; the tense changes ("launched" versus "launch") are the only hint. Mark planned milestones clearly so an investor does not mistake a goal for a result.
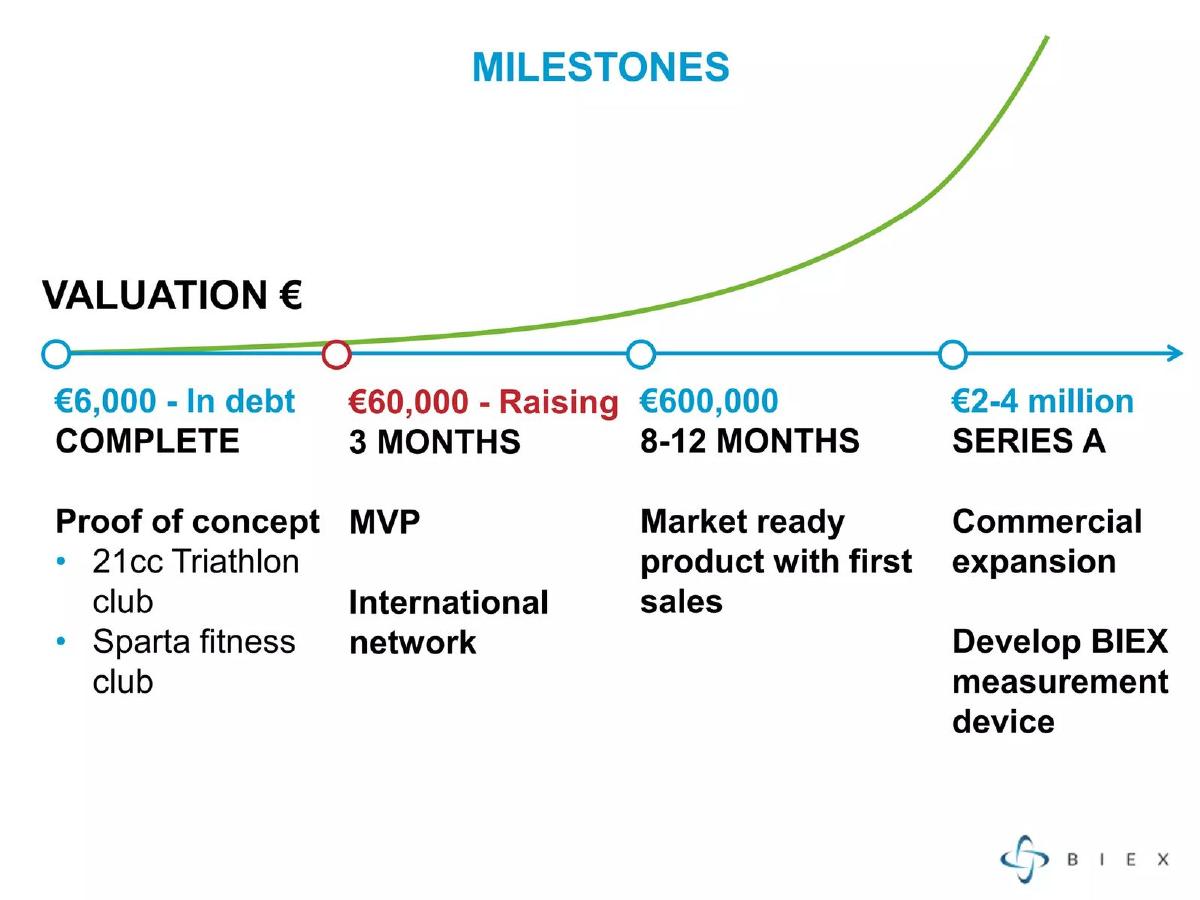
Sports measurement technology. Stage and year not recorded.
Biex deck, slide 6. Exact stored slide matched to this analysis.
Our analysis: It is the clearest link in this set between money and milestones: each funding amount sits above what it is expected to deliver, and the current raise is highlighted.
Evidence and limitation: The valuation label and curve imply values the slide does not justify; the figures read as amounts raised, not valuations, which is confusing. Rising curves without numbers can look decorative.
What a founder can adapt: Put your raise on the timeline and state the specific milestone it funds, then the next raise and what that funds.
Supporting analysis
What the deck claims: "Milestones" on a timeline under a rising valuation curve. Four steps: €6,000, in debt, complete (proof of concept with two named clubs); €60,000, raising, 3 months (MVP, international network); €600,000, 8–12 months (market-ready product with first sales); €2–4 million, Series A (commercial expansion, develop a Biex measurement device).
Presentation choice: It is the clearest link in this set between money and milestones: each funding amount sits above what it is expected to deliver, and the current raise is highlighted.
When it does not fit: The valuation label and curve imply values the slide does not justify; the figures read as amounts raised, not valuations, which is confusing. Rising curves without numbers can look decorative.
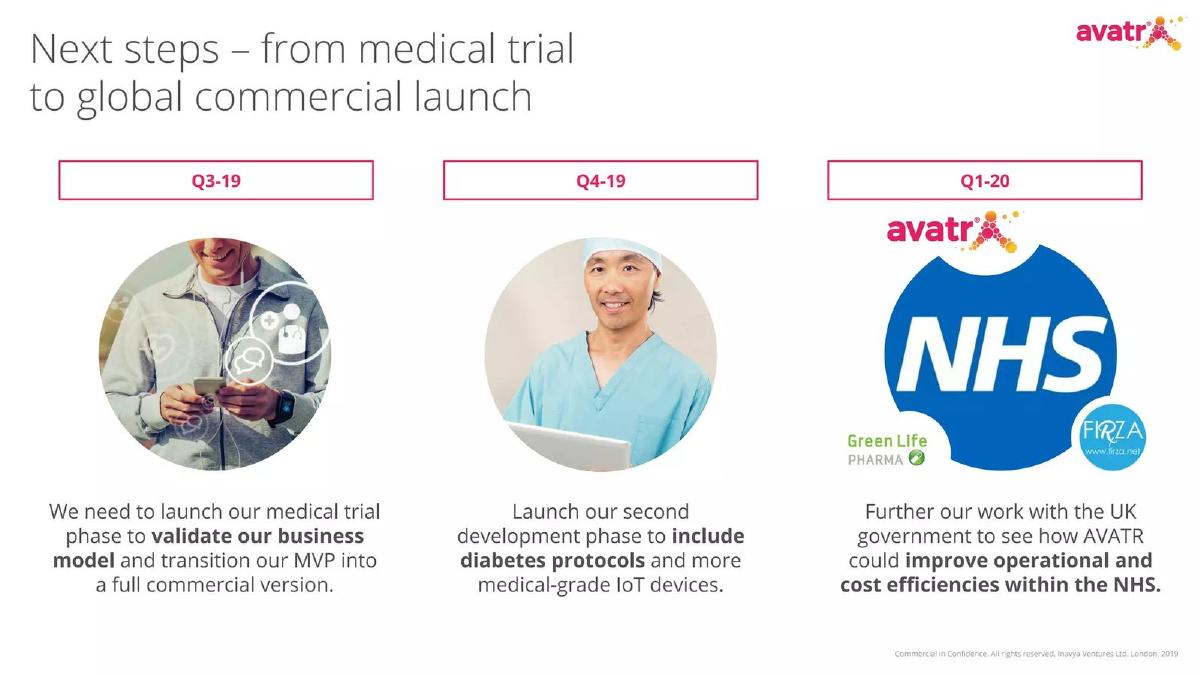
Medical-grade IoT for health monitoring. The deck is dated April 2019 in its title; the slide footer reads London 2019.
Avatr deck, slide 5. Exact stored slide matched to this analysis.
Our analysis: Three quarters, one outcome each, with a headline that states the direction. For a regulated product, naming the trial and the health-system relationship is the relevant progress.
Evidence and limitation: The NHS logo implies a relationship the text describes only as "further our work"; show the nature of the relationship precisely. There are no success measures for the trial.
What a founder can adapt: For regulated products, make each step a regulatory or validation gate rather than a feature.
Supporting analysis
What the deck claims: "Next steps – from medical trial to global commercial launch". Three quarters: Q3-19, launch the medical trial phase to validate the business model and move the MVP to a full commercial version; Q4-19, a second development phase to include diabetes protocols and more medical-grade IoT devices; Q1-20, further work with the UK government on operational and cost efficiencies within the NHS (shown with an NHS logo and partner marks).
Presentation choice: Three quarters, one outcome each, with a headline that states the direction. For a regulated product, naming the trial and the health-system relationship is the relevant progress.
When it does not fit: The NHS logo implies a relationship the text describes only as "further our work"; show the nature of the relationship precisely. There are no success measures for the trial.
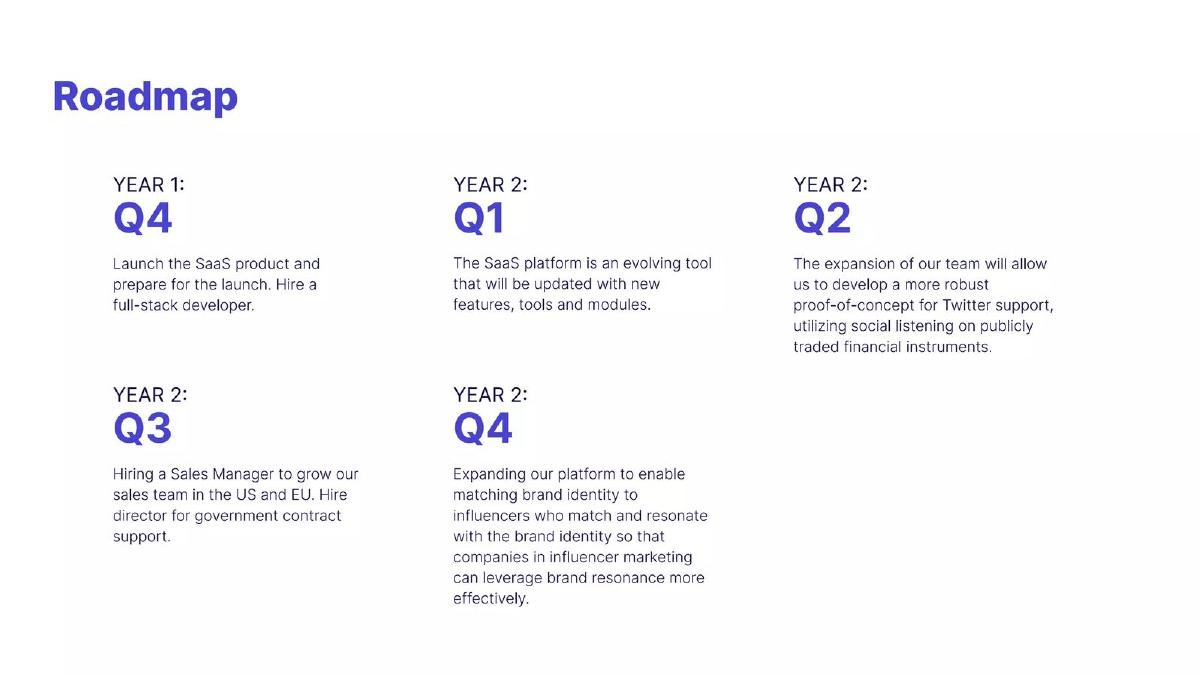
Cultural analytics software. The teardown title refers to a $1M raise; stage and year otherwise not recorded.
CulturePulse deck, slide 6. Exact stored slide matched to this analysis.
Our analysis: The quarter layout makes pacing visible, and including hires shows how the team will grow alongside the product.
Evidence and limitation: Relative dates ("Year 1", "Year 2") are hard to hold anyone to. The steps mix unrelated product directions and have no metrics, so an investor cannot tell what success looks like.
What a founder can adapt: Use quarters if you can commit to them; include the hires the round pays for.
Supporting analysis
What the deck claims: "Roadmap" in five quarter blocks: Year 1 Q4, launch the SaaS product and hire a full-stack developer; Year 2 Q1, update the platform with new features, tools and modules; Q2, a more robust proof of concept for Twitter support using social listening on traded financial instruments; Q3, hire a sales manager for the US and EU and a director for government contract support; Q4, expand the platform to match brand identity to influencers.
Presentation choice: The quarter layout makes pacing visible, and including hires shows how the team will grow alongside the product.
When it does not fit: Relative dates ("Year 1", "Year 2") are hard to hold anyone to. The steps mix unrelated product directions and have no metrics, so an investor cannot tell what success looks like.
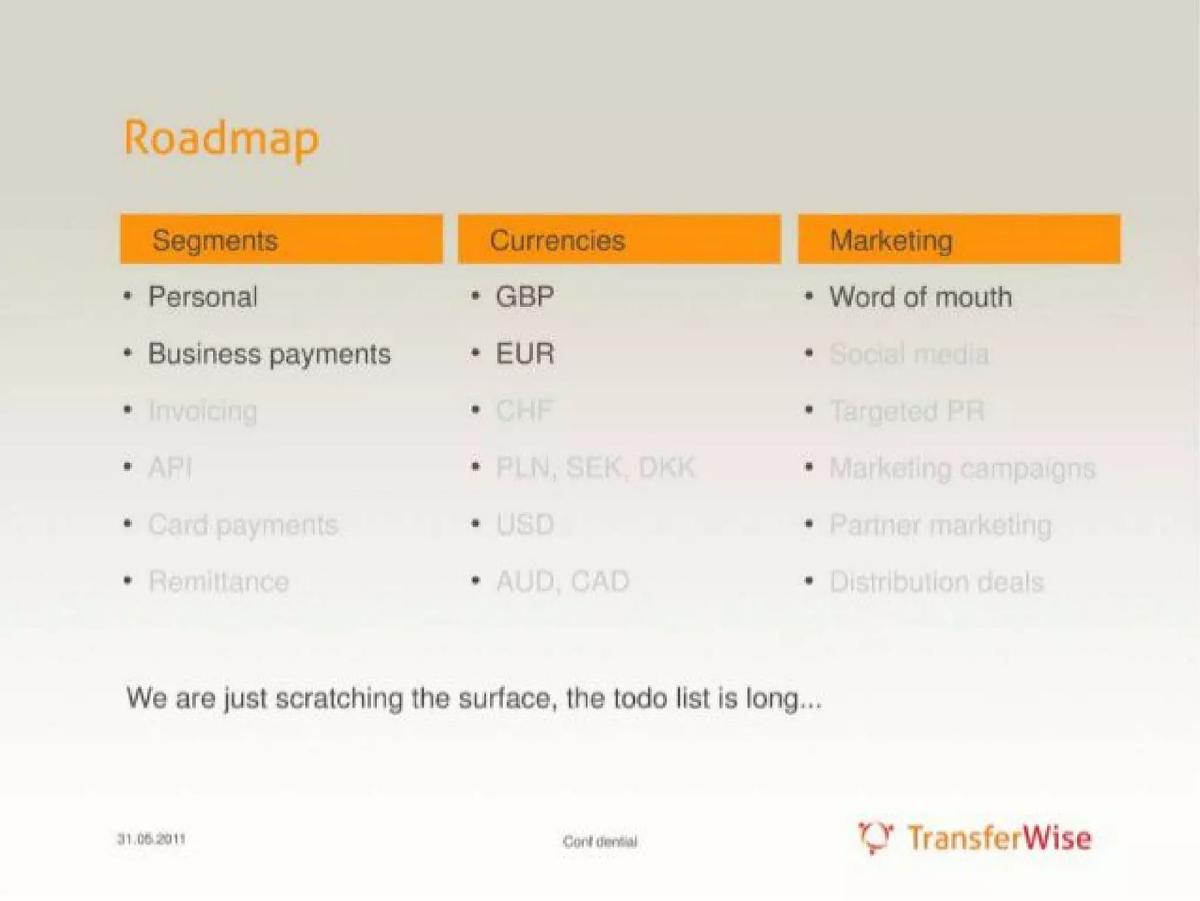
International money transfer (now Wise). The slide footer reads 31.05.2011.
TransferWise deck, slide 5. Exact stored slide matched to this analysis.
Our analysis: The fading shows what exists today and how much more could be added, in a single glance. For a product that expands by corridor or currency, this makes the size of the opportunity concrete.
Evidence and limitation: There are no dates or order, so it is a scope map rather than a plan. An investor still needs to know what the round pays for next.
What a founder can adapt: If you grow by adding segments, markets or integrations, show the current set in full and future ones faded.
Supporting analysis
What the deck claims: "Roadmap" in three columns. Segments: personal and business payments in full; invoicing, API, card payments and remittance faded. Currencies: GBP and EUR in full; CHF, PLN/SEK/DKK, USD and AUD/CAD faded. Marketing: word of mouth in full; social media, targeted PR, campaigns, partner marketing and distribution deals faded. Caption: "We are just scratching the surface, the todo list is long..."
Presentation choice: The fading shows what exists today and how much more could be added, in a single glance. For a product that expands by corridor or currency, this makes the size of the opportunity concrete.
When it does not fit: There are no dates or order, so it is a scope map rather than a plan. An investor still needs to know what the round pays for next.
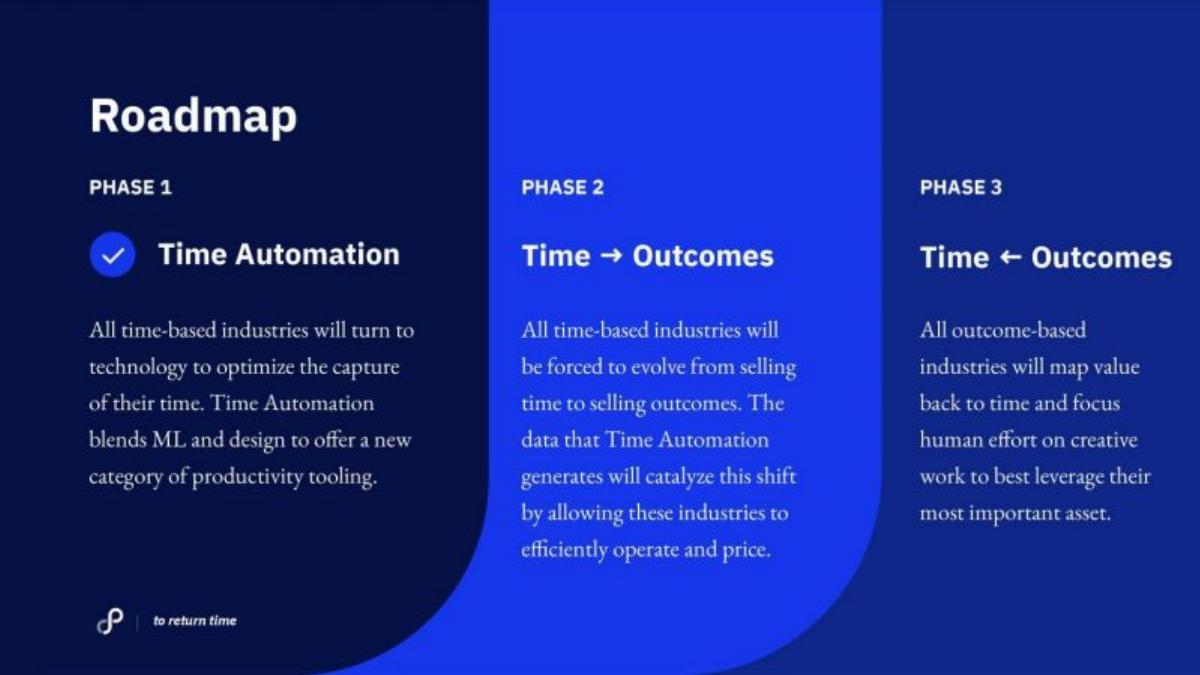
Automated time capture for professional services. Stage and year not recorded.
Time by Ping deck, slide 3. Exact stored slide matched to this analysis.
Our analysis: It turns the roadmap into a market thesis: each phase is a bigger shift in how an industry works, and the current product is the first step. That signals the long-term size of the company.
Evidence and limitation: No phase has a date, metric or product description, so it works more as a vision slide. Pair it with a dated plan elsewhere.
What a founder can adapt: Use phases when your plan is a sequence of markets or business models rather than features, and tick the one you have done.
Supporting analysis
What the deck claims: "Roadmap" in three phases. Phase 1 (ticked), Time Automation: time-based industries will use technology to capture their time. Phase 2, Time → Outcomes: those industries will move from selling time to selling outcomes, catalysed by Time Automation's data. Phase 3, Time ← Outcomes: outcome-based industries will map value back to time.
Presentation choice: It turns the roadmap into a market thesis: each phase is a bigger shift in how an industry works, and the current product is the first step. That signals the long-term size of the company.
When it does not fit: No phase has a date, metric or product description, so it works more as a vision slide. Pair it with a dated plan elsewhere.
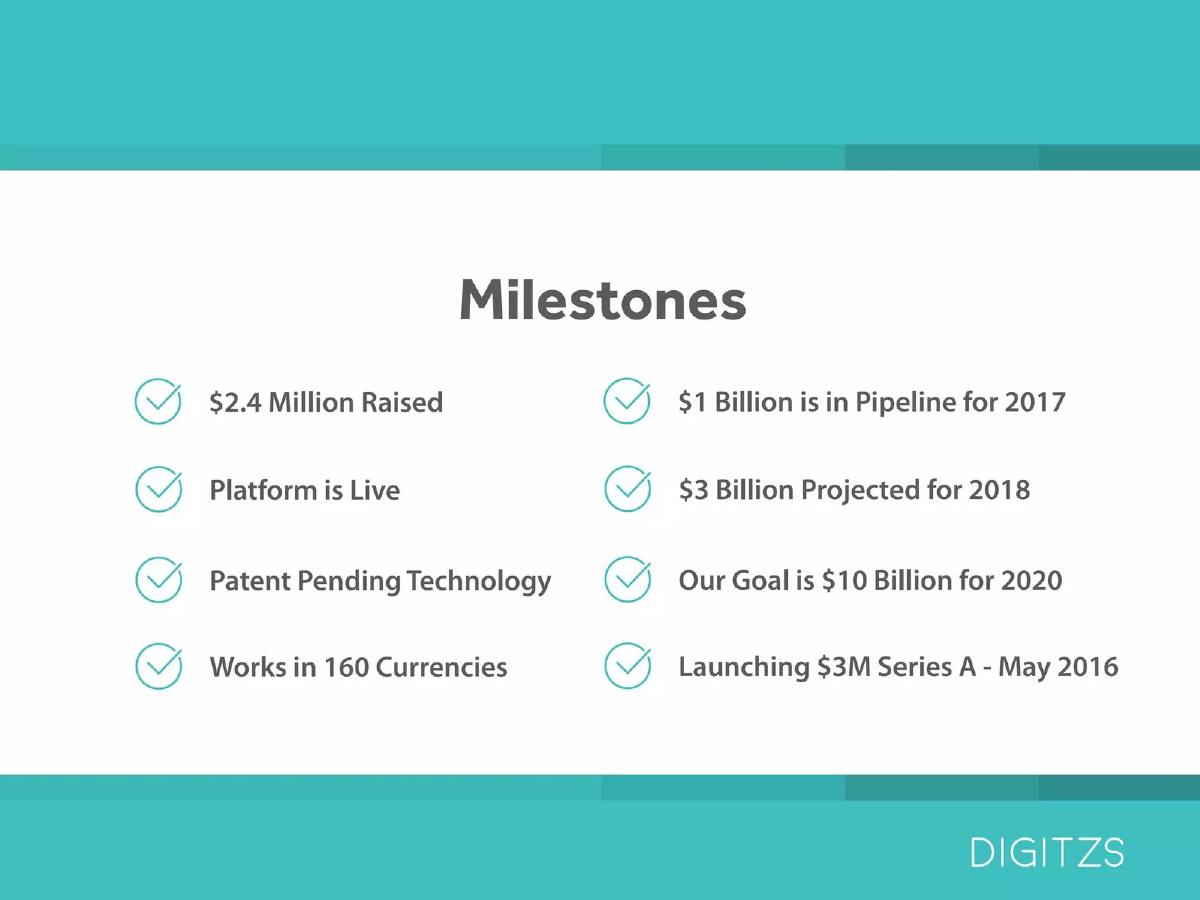
Payments platform. The deck file name suggests a November 2016 version; the slide mentions a Series A for May 2016.
Digitzs deck, slide 2. Exact stored slide matched to this analysis.
Our analysis: Included as a contrast. It shows both achievements and targets, which is what a milestone slide needs.
Evidence and limitation: Every line has the same tick, so a $10 billion goal looks like a completed milestone. The figures do not say what is measured (payment volume is likely but not stated).
What a founder can adapt: Keep the two groups but label them clearly: "done" on the left and "next, with dates" on the right.
Supporting analysis
What the deck claims: "Milestones" with eight ticked lines: $2.4 million raised; platform is live; patent pending technology; works in 160 currencies; $1 billion in pipeline for 2017; $3 billion projected for 2018; our goal is $10 billion for 2020; launching $3M Series A – May 2016.
Presentation choice: Included as a contrast. It shows both achievements and targets, which is what a milestone slide needs.
When it does not fit: Every line has the same tick, so a $10 billion goal looks like a completed milestone. The figures do not say what is measured (payment volume is likely but not stated).
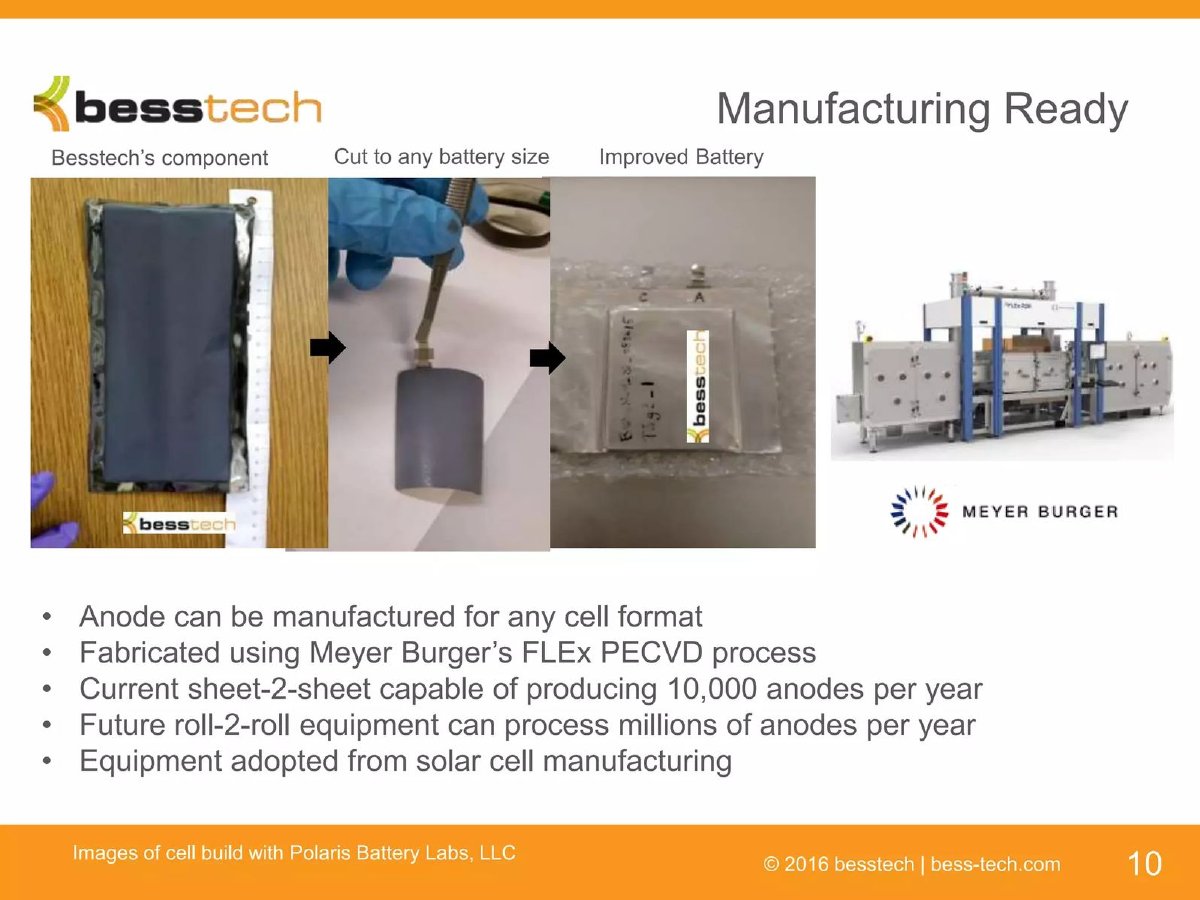
Besstech deck, slide 10. Exact stored slide matched to this analysis.
Our analysis: It separates today from the future in the wording itself: "current" equipment with a number, unit and period, and "future" equipment named by type. The enabling step is visible: moving from sheet-to-sheet to roll-to-roll processing, on equipment from solar-cell manufacturing.
Evidence and limitation: "Millions" is not a target anyone can check, and the slide gives no timing, cost or owner for the future equipment. "Capable of producing" is capacity, not output: the slide doesn't say how many anodes were actually made. Claims are as of 2016.
What a founder can adapt: Keep the current/future split, then give the future figure as a number, the date you expect the equipment, and what it depends on (for example, "roll-to-roll line funded by this round, installed by [quarter, year]").
Supporting analysis
What the deck claims: "Anode can be manufactured for any cell format"; "Fabricated using Meyer Burger's FLEx PECVD process"; "Current sheet-2-sheet capable of producing 10,000 anodes per year"; "Future roll-2-roll equipment can process millions of anodes per year"; "Equipment adopted from solar cell manufacturing".
Presentation choice: It separates today from the future in the wording itself: "current" equipment with a number, unit and period, and "future" equipment named by type. The enabling step is visible: moving from sheet-to-sheet to roll-to-roll processing, on equipment from solar-cell manufacturing.
When it does not fit: "Millions" is not a target anyone can check, and the slide gives no timing, cost or owner for the future equipment. "Capable of producing" is capacity, not output: the slide doesn't say how many anodes were actually made. Claims are as of 2016.
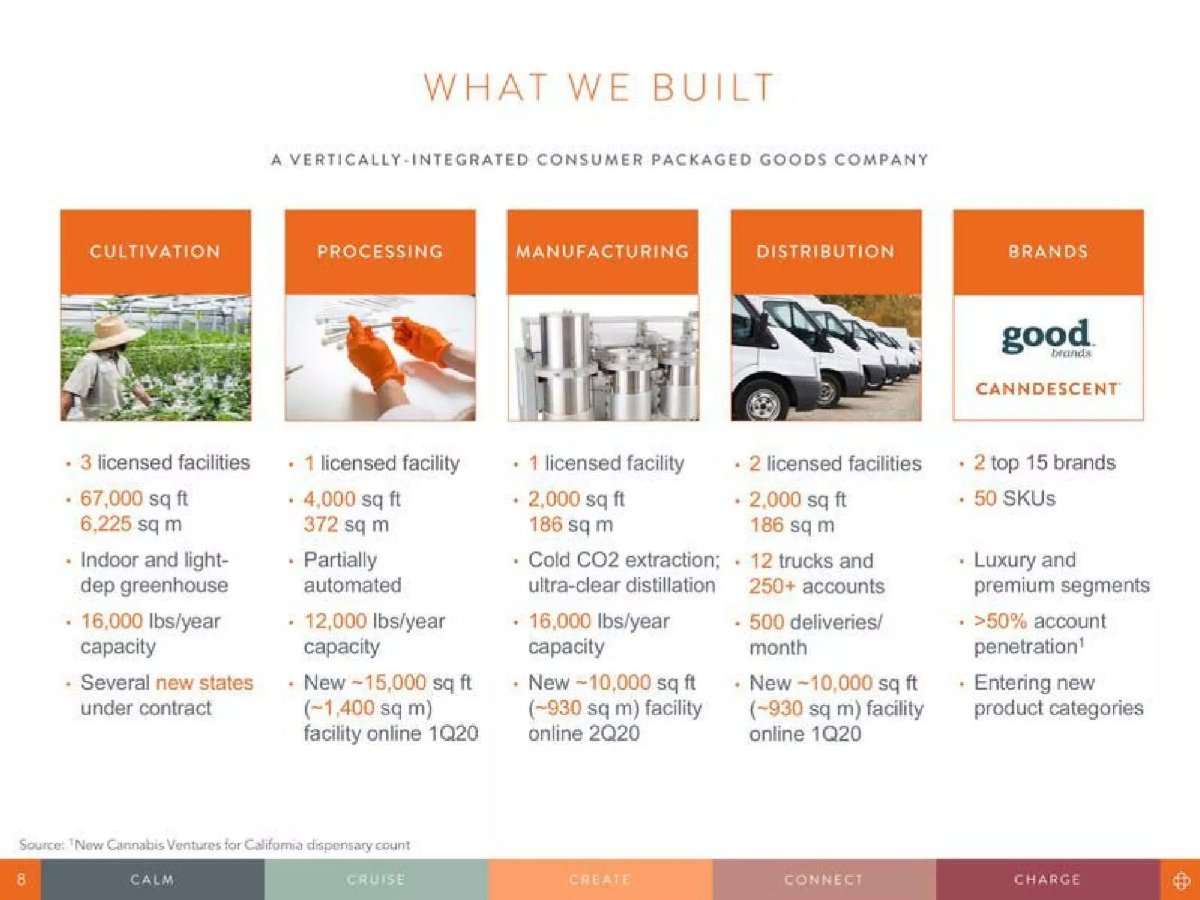
Vertically integrated cannabis products company, California. Our collection records the deck as a 2019 later-stage presentation; the slide's new facilities are dated 1Q20 and 2Q20, so they were planned at the time.
Canndescent deck, slide 8. Exact stored slide matched to this analysis.
Our analysis: Each stage has an operating baseline (licensed facilities, floor area, capacity per year) and a separate line for what is coming, with a quarter. An investor can see which stage is smallest (processing, at 12,000 lbs/year) and which stages have new space scheduled.
Evidence and limitation: The new facilities are given in square feet, not in lbs/year, so the planned capacity increase isn't stated. The slide doesn't give actual output, utilisation or cost. Don't add the stage figures together: the slide doesn't say whether they are separate or successive steps for the same product, so it gives no total.
What a founder can adapt: Give each stage current capacity and the new capacity each planned facility adds, not only its floor area, so the increase can be measured.
Supporting analysis
What the deck claims: "What we built", five columns. Cultivation: 3 licensed facilities, 67,000 sq ft, indoor and light-dep greenhouse, "16,000 lbs/year capacity", "Several new states under contract". Processing: 1 licensed facility, 4,000 sq ft, partially automated, "12,000 lbs/year capacity", "New ~15,000 sq ft (~1,400 sq m) facility online 1Q20". Manufacturing: 1 licensed facility, 2,000 sq ft, cold CO2 extraction, "16,000 lbs/year capacity", "New ~10,000 sq ft (~930 sq m) facility online 2Q20". Distribution: 2 licensed facilities, 12 trucks and 250+ accounts, "500 deliveries/month", new ~10,000 sq ft facility online 1Q20. Brands: 2 top-15 brands, 50 SKUs, ">50% account penetration" (footnoted to a dispensary count source).
Presentation choice: Each stage has an operating baseline (licensed facilities, floor area, capacity per year) and a separate line for what is coming, with a quarter. An investor can see which stage is smallest (processing, at 12,000 lbs/year) and which stages have new space scheduled.
When it does not fit: The new facilities are given in square feet, not in lbs/year, so the planned capacity increase isn't stated. The slide doesn't give actual output, utilisation or cost. Don't add the stage figures together: the slide doesn't say whether they are separate or successive steps for the same product, so it gives no total.
Most strong roadmaps combine a dated plan with a link to the round. Choose the format that makes your next milestones easiest to hold you to.
Approach
Best when
What it needs
Main risk
Examples
Dated metric milestones
You have traction to extend
A date and number per line; done versus planned marked
Targets read as results
Buffer
Milestones by funding stage
You want to show what the round buys
Amount, timing and deliverable per stage
Confusing labels (raised versus valuation)
Biex
Quarterly plan
You can commit to a near-term schedule
One outcome per quarter, real dates
Relative dates and mixed goals
Avatr; CulturePulse
Expansion map
Growth comes from new segments or markets
Current set shown distinctly from future
No order or timing
TransferWise
Phased thesis
The long-term story is a market shift
A clear first phase you have done
Reads as vision, not plan
Time by Ping
Key Takeaways
Attach a number and a date to each milestone. Buffer lists users and revenue next to each date, so the roadmap doubles as a growth story; it does not, however, mark which lines were achieved and which were targets.
Link milestones to the money. Biex places each stage (proof of concept, MVP, market-ready product, commercial expansion) against its funding step, so an investor sees what this round is meant to buy.
Quarterly plans work best when each quarter has one outcome. CulturePulse and Avatr give a quarter per step; CulturePulse's steps mix hires, features and a proof of concept, which makes progress harder to judge.
Show breadth by fading, not by listing. TransferWise shows today's segments and currencies in full and fades future ones, which communicates scope in one glance.
Keep achieved facts and projections visibly apart. Digitzs puts "$2.4 million raised" and "our goal is $10 billion for 2020" in the same list with the same tick marks.
If you make a physical product, show today's production capacity with a unit and a period, keep it separate from planned capacity, and name what unlocks the increase. Besstech gives "10,000 anodes per year" today against "millions" on future roll-to-roll equipment; Canndescent gives lbs/year for each stage and a quarter for each new facility.
Build your roadmap in four lines
Fill these in before choosing a layout. If you cannot put a date on line three, it does not belong on the slide yet.
Done. What have you already proven, with a number and a date?
This round. How much are you raising, and for how many months?
Next milestones. What two or three things will be true by the end of that period, with dates and metrics?
Next round. What will those milestones let you raise or prove next?
Copyable framework: Done: [milestone, metric, date]. Raising [amount] for [months]. By [date]: [milestone + metric]; by [date]: [milestone + metric]. That positions us for [next round / goal].
Illustrative example 1 — written by us
Before: Q1: new features. Q2: grow team. Q3: expand to US. Q4: scale.
After: Done: [x] paying customers, [month, year]. Raising [amount] for [18] months. By [month, year]: [y] customers and [product milestone]. By [month, year]: first [US] customers, [z] revenue run-rate.
What improved: Our illustrative rewrite, not any company's text. It separates done from planned, ties the plan to the round, and adds dates and metrics; bracketed values are placeholders.
What the roadmap slide has to answer
An investor reading a roadmap is asking three things: what has already been proven, what happens next, and what this round pays for. The roadmap is also a record they can return to; milestones you name here are the ones they will ask about at the next meeting.
The word varies: roadmap, milestones, timeline, next steps. The layouts below differ mainly in how clearly they separate the past from the plan and how directly they tie the plan to money.
Production capacity: what you can make today versus what you plan to make
For companies that manufacture, grow or process something, the roadmap question becomes a capacity question: how much can you make now, how much will you be able to make, and what has to happen in between. Answer it with a current figure in units per period, a planned figure, and the specific step that unlocks the increase: equipment, a facility, a licence, hires.
Keep six things apart. Capacity is what the operation could make in a period; production is what it actually made. Current capability is not proposed expansion. Annual throughput (units per year) is not inventory or cumulative output. A facility that is operating is not one scheduled to open. A measured baseline ("10,000 per year") is not an imprecise future claim ("millions"). And an expansion date shows when capacity should exist, not that customers will use it.
Neither example below states actual output, utilisation, the cost of expansion or the orders that would fill the new capacity, so none of those can be read from the slides. If you have them, they are what turns a capacity plan into evidence: current output against capacity shows how close you are to the limit, and signed orders or a pipeline show the new capacity will be used.
A format you can adapt (our editorial suggestion; neither deck supplied every field): Current capacity: [units] per [period], as of [date]. Current output or utilisation: [value], if measured. Planned capacity: [units] per [period]. Enabling step: [equipment, facility, hiring, approval]. Target timing and conditions: [date], assuming [funding, permit, supplier].
Common mistakes
Targets that look like results. Mark what is done and what is planned; do not use the same tick for both.
Relative dates. "Year 2, Q3" is harder to hold anyone to than a real month and year.
Feature lists. A roadmap of features without the metric each moves tells an investor little.
No link to the round. Say which milestones this raise pays for.
Borrowed logos. A partner's logo on a future step implies a commitment; describe the relationship accurately.
Capacity presented as demand. A new facility or machine shows what you could make, not what customers will buy; show output or orders separately if you have them.
Diagnostic checklist
Clearly separates achieved milestones from planned ones.
Every planned milestone has a date (month or quarter, with a year).
At least one milestone carries a metric, not just a feature.
Shows which milestones this round funds.
Covers roughly the period until the next raise.
Any partner logos match the actual relationship.
For physical products: current capacity has a unit and period, is separate from planned capacity, and names the step that unlocks the increase.
Frequently asked questions
How we chose these examples
Corpus: published pitch deck teardowns on StartupFundraising.com. Founder-uploaded private decks are excluded.
Selection (2026-09-24): we searched extracted slide text for slides 2–6 beginning with "roadmap", "milestones", "timeline" or "next steps" that also have a stored slide image, inspected eight candidates, and chose seven covering social software, sports tech, health IoT, analytics, payments and professional services. Digitzs is included partly as a contrast. Ourobio slide 6 was not selected because the biotech pipeline guide already covers product-pipeline roadmaps.
Review: all seven stored slide images were inspected on 2026-09-24 and matched to company, deck and slide number (editorial model review). No person has yet completed an editorial review of this page.
Figures and dates are shown as printed on the slides; we have not verified them, and we do not state which targets were later met.
We make no claim that any roadmap slide caused a fundraising outcome.
Capacity addition (2026-09-28): Besstech slide 10 and Canndescent slide 8 were found by searching recovered slide text for capacity wording, rendered from the original deck files in our library and checked against the images (editorial model review, not a person). Capacity figures, units and dates are as printed; we have not verified them and do not know whether either company reached the planned capacity. Canndescent's figures are shown per stage and are not added together, because the slide does not say whether they are additive.