Hiring Plan in a Pitch Deck: Roles, Timing and Cost. 7 Real
How to show which roles your round pays for, when each hire starts, what it costs and which milestone depends on it.
The Hiring Plan in Your Ask: Which Roles, When, at What Cost
Seven slides from real pitch decks that describe the hires a round will pay for. We record which of four facts each gives: the role, the start date, the cost and the milestone the hire is for.
TL;DR
A hiring plan answers four questions: which roles, when each starts, what each costs and what the hire is meant to achieve. Of these seven slides, only MySwimPro gives role, quarter and salary for every hire, and only Mattermark turns headcount into a quarterly cost that reconciles with its raise. None ties each hire to a specific milestone.
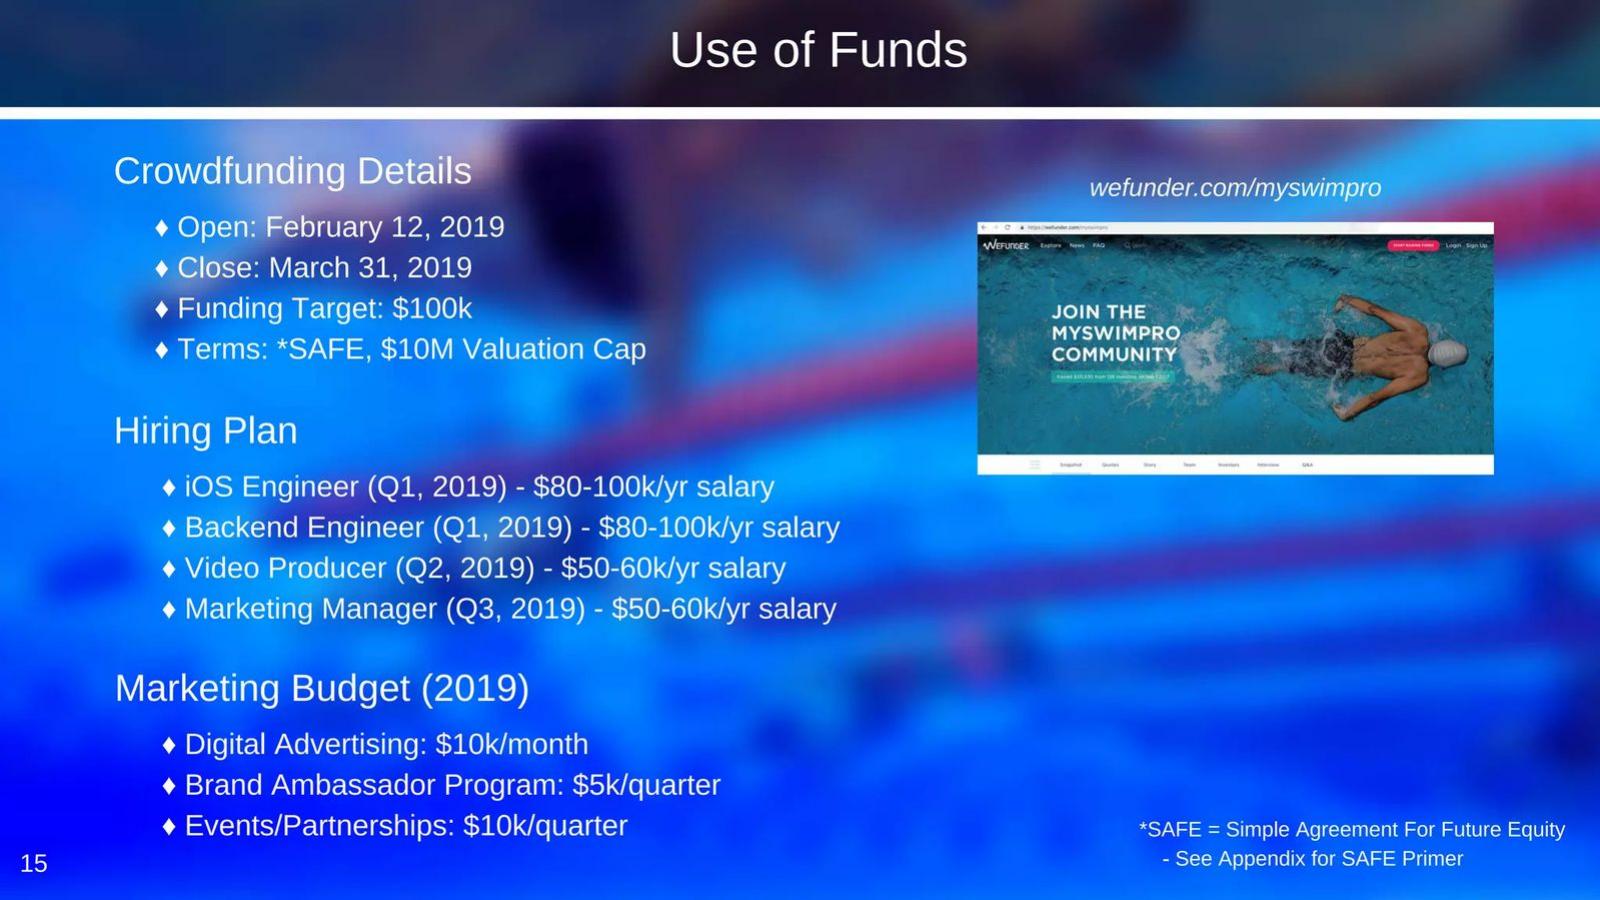
Checking a hiring plan against the raise needs the start dates as well as the salaries. MySwimPro lists four salaried hires next to a $100k crowdfunding target. If each hire starts at the beginning of its stated quarter and is paid the stated salary range for the rest of 2019, excluding taxes and benefits, their 2019 salaries total about $222,500 to $275,000 (our calculation). The slide does not say how the $100k target relates to these salaries, or what other funding or revenue is available.
Hiring plans from real pitch decks
Each example shows the exact page from the original public deck above its analysis and links to the full teardown. Figures are the companies' own; calculations are ours and labelled. Page numbers are PDF pages.
MySwimPro ask slide — slide 15
Swim-training app. "Use of Funds" slide for a crowdfunding round closing March 31, 2019.
MySwimPro deck, slide 15. Exact stored slide matched to this analysis.
Our analysis: The only slide here that gives role, start quarter and salary for every hire. That lets a reader cost the plan. Our calculation, assuming each hire starts on the first day of its stated quarter at the stated salary and excluding taxes and benefits: iOS and backend engineers 12 months each ($160,000–200,000), video producer 9 months ($37,500–45,000), marketing manager 6 months ($25,000–30,000), about $222,500–275,000 in 2019. The marketing budget adds $180,000 a year.
Evidence and limitation: The slide does not say how the $100k target relates to the planned salaries and marketing budget, or what other funding, cash or revenue is available. Salaries exclude taxes and benefits unless stated, and no hire is linked to a milestone.
What a founder can adapt: List each hire as role, start quarter and annual cost, then total the cost falling inside the runway.
Supporting analysis
What the deck claims: "Funding Target: $100k." "Hiring Plan: iOS Engineer (Q1, 2019) - $80-100k/yr salary; Backend Engineer (Q1, 2019) - $80-100k/yr salary; Video Producer (Q2, 2019) - $50-60k/yr salary; Marketing Manager (Q3, 2019) - $50-60k/yr salary." Marketing budget: digital advertising $10k/month, brand ambassadors $5k/quarter, events and partnerships $10k/quarter.
Presentation choice: The only slide here that gives role, start quarter and salary for every hire. That lets a reader cost the plan. Our calculation, assuming each hire starts on the first day of its stated quarter at the stated salary and excluding taxes and benefits: iOS and backend engineers 12 months each ($160,000–200,000), video producer 9 months ($37,500–45,000), marketing manager 6 months ($25,000–30,000), about $222,500–275,000 in 2019. The marketing budget adds $180,000 a year.
When it does not fit: The slide does not say how the $100k target relates to the planned salaries and marketing budget, or what other funding, cash or revenue is available. Salaries exclude taxes and benefits unless stated, and no hire is linked to a milestone.
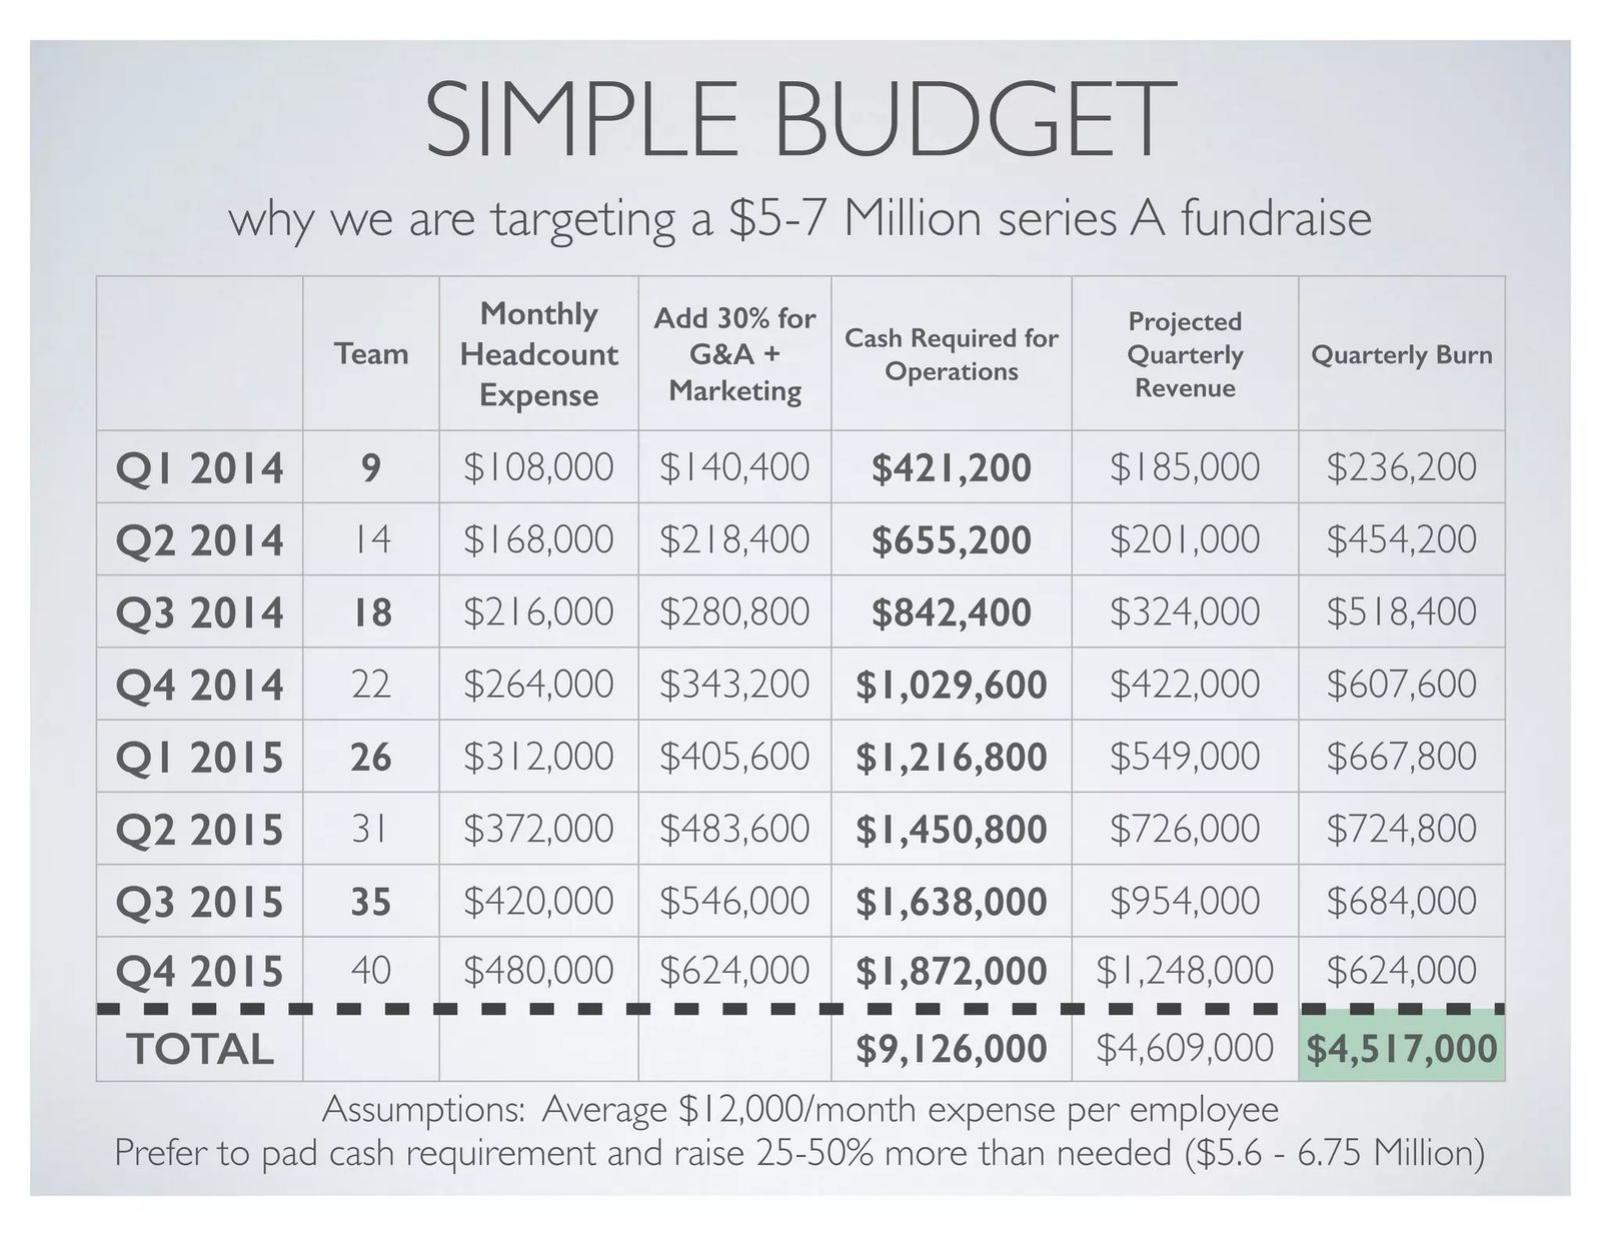
Startup data company. "Simple Budget" slide explaining a $5–7 million Series A target.
Mattermark deck, slide 31. Exact stored slide matched to this analysis.
Our analysis: It turns headcount into the raise, and every row reconciles by our calculation: team × $12,000 = monthly headcount expense; × 1.3 × 3 = quarterly cash required; minus revenue = quarterly burn. $4,517,000 plus 25–50% gives about $5.6–6.8 million, matching the stated range.
Evidence and limitation: No roles are named, so a reader cannot see which hires the milestones depend on, and one average cost covers every role. Revenue is a projection, so the burn depends on it.
What a founder can adapt: Build the ask from headcount by quarter × loaded cost per person, net of revenue, and state the padding.
Supporting analysis
What the deck claims: Team by quarter from 9 (Q1 2014) to 40 (Q4 2015); monthly headcount expense, "Add 30% for G&A + Marketing", cash required, projected quarterly revenue and quarterly burn. Totals: cash required $9,126,000; projected revenue $4,609,000; quarterly burn $4,517,000. "Assumptions: Average $12,000/month expense per employee. Prefer to pad cash requirement and raise 25-50% more than needed ($5.6 - 6.75 Million)."
Presentation choice: It turns headcount into the raise, and every row reconciles by our calculation: team × $12,000 = monthly headcount expense; × 1.3 × 3 = quarterly cash required; minus revenue = quarterly burn. $4,517,000 plus 25–50% gives about $5.6–6.8 million, matching the stated range.
When it does not fit: No roles are named, so a reader cannot see which hires the milestones depend on, and one average cost covers every role. Revenue is a projection, so the burn depends on it.
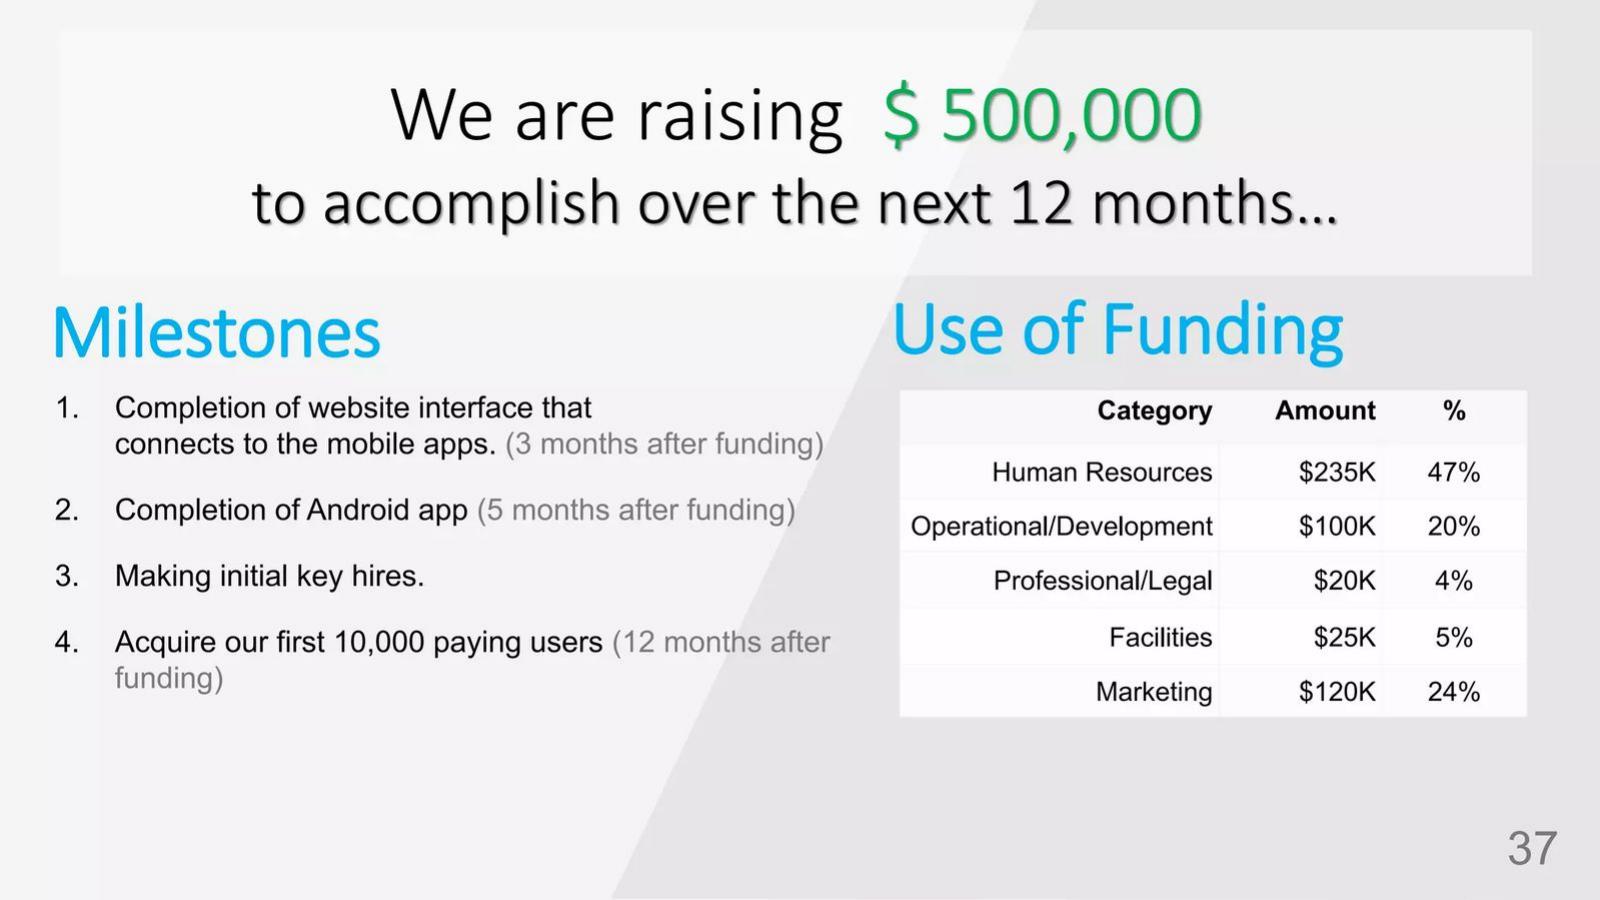
Mobile app. Raise slide (numbered 37 on the slide; PDF page 35).
Lincsphere deck, slide 35. Exact stored slide matched to this analysis.
Our analysis: People are the largest line and the allocation adds up ($500K, 100%). Most milestones carry a month after funding, which is the timing a hiring plan needs.
Evidence and limitation: The key-hires milestone is the only one without timing, and the roles and their costs are not named, so the $235K cannot be checked.
What a founder can adapt: Give the hiring milestone the same month-after-funding timing as the others.
Supporting analysis
What the deck claims: "We are raising $500,000 to accomplish over the next 12 months." Milestones: website interface (3 months after funding), Android app (5 months after funding), "Making initial key hires", first 10,000 paying users (12 months after funding). Use of funding: Human Resources $235K (47%), Operational/Development $100K (20%), Professional/Legal $20K (4%), Facilities $25K (5%), Marketing $120K (24%).
Presentation choice: People are the largest line and the allocation adds up ($500K, 100%). Most milestones carry a month after funding, which is the timing a hiring plan needs.
When it does not fit: The key-hires milestone is the only one without timing, and the roles and their costs are not named, so the $235K cannot be checked.
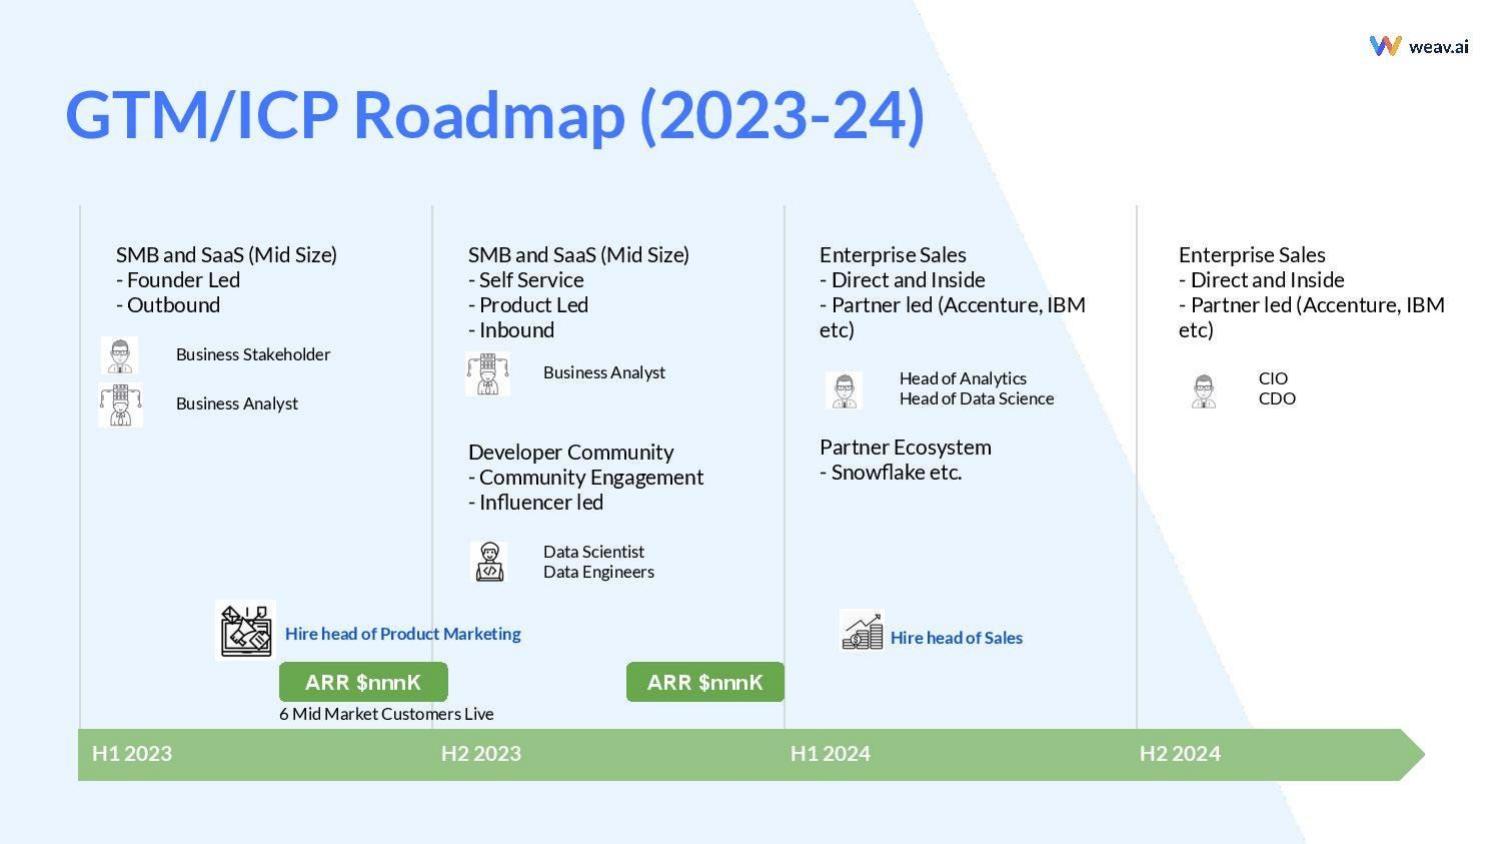
AI software company (the slide carries the weav.ai logo). "GTM/ICP Roadmap (2023-24)" slide.
Viso deck, slide 23. Exact stored slide matched to this analysis.
Our analysis: Each hire is placed at the point in the sales plan that needs it: product marketing ahead of the self-service, product-led phase in H2 2023, a sales head for the move to enterprise buyers.
Evidence and limitation: The revenue targets are blanked out as "$nnnK" and no costs are given, so a reader cannot judge whether each hire pays off or fits the raise.
What a founder can adapt: Put each senior hire on the timeline next to the milestone or sales motion it serves.
Supporting analysis
What the deck claims: Four half-year phases from H1 2023 to H2 2024, each with a sales motion and buyer. "Hire head of Product Marketing" appears in H1 2023 alongside "6 Mid Market Customers Live"; "Hire head of Sales" in H1 2024 when "Enterprise Sales - Direct and Inside" begins. Revenue markers read "ARR $nnnK".
Presentation choice: Each hire is placed at the point in the sales plan that needs it: product marketing ahead of the self-service, product-led phase in H2 2023, a sales head for the move to enterprise buyers.
When it does not fit: The revenue targets are blanked out as "$nnnK" and no costs are given, so a reader cannot judge whether each hire pays off or fits the raise.
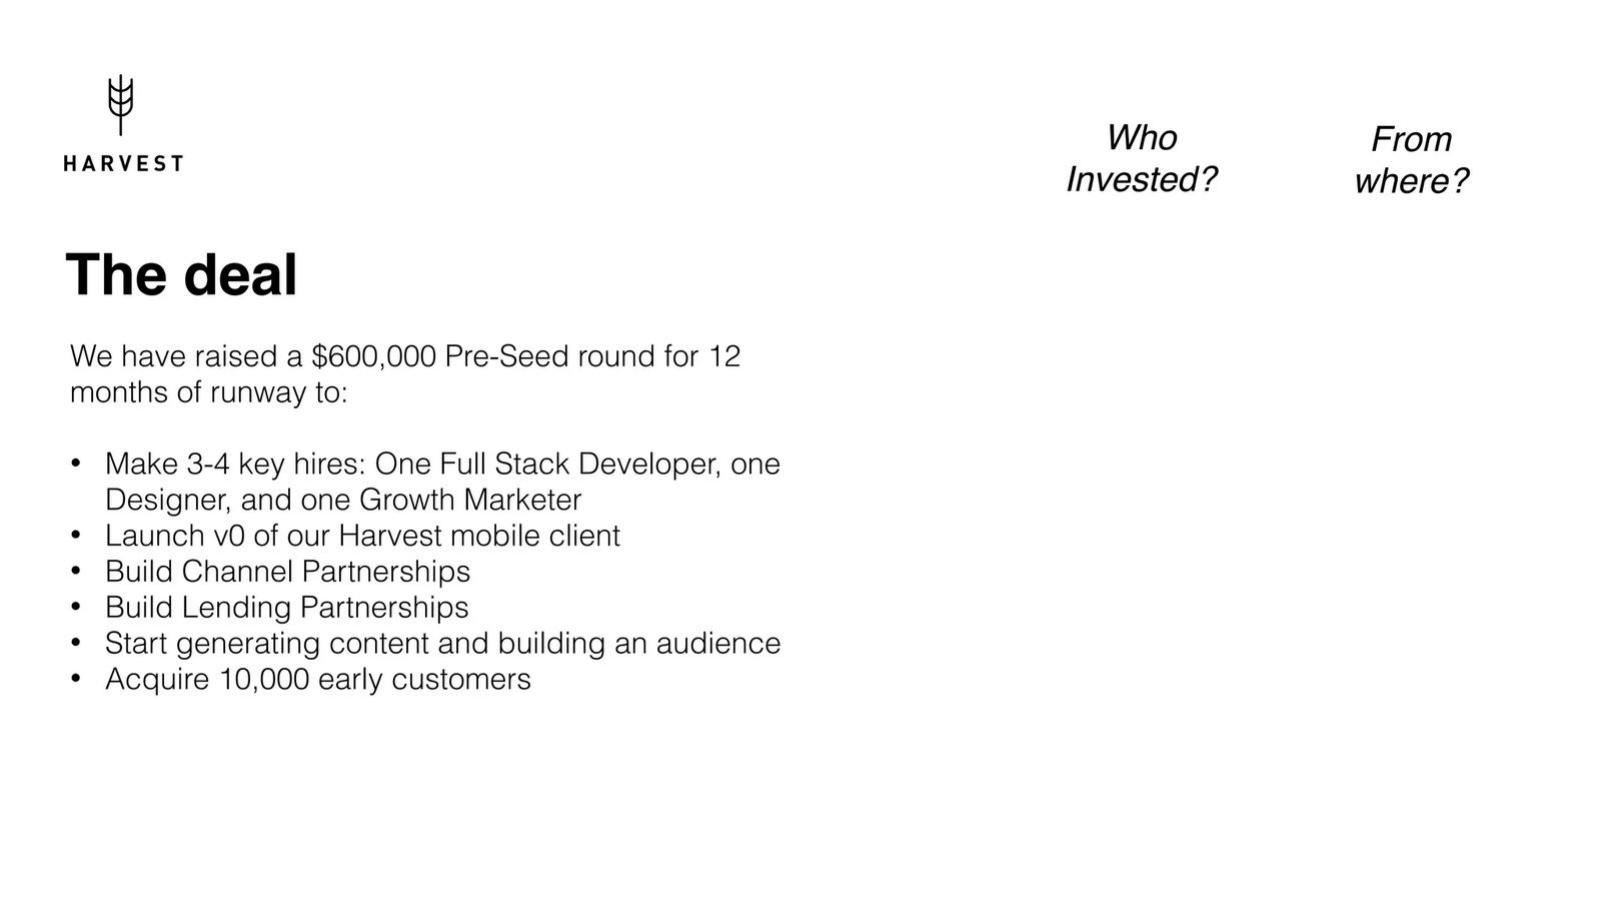
Consumer finance app. "The deal" slide describing a completed pre-seed round.
Harvest deck, slide 14. Exact stored slide matched to this analysis.
Our analysis: It names the roles next to the goals of the round. The previous page of the deck charts burn stepping up when three people are hired, which is the timing this slide omits (see the burn-and-runway guide).
Evidence and limitation: "3-4 key hires" names three roles; the fourth is unstated. No costs or dates, and the goals are not linked to particular hires.
What a founder can adapt: Put the start month and cost next to each named role, and say which goal each serves.
Supporting analysis
What the deck claims: "We have raised a $600,000 Pre-Seed round for 12 months of runway to: Make 3-4 key hires: One Full Stack Developer, one Designer, and one Growth Marketer; Launch v0 of our Harvest mobile client; Build Channel Partnerships; Build Lending Partnerships; Start generating content and building an audience; Acquire 10,000 early customers."
Presentation choice: It names the roles next to the goals of the round. The previous page of the deck charts burn stepping up when three people are hired, which is the timing this slide omits (see the burn-and-runway guide).
When it does not fit: "3-4 key hires" names three roles; the fourth is unstated. No costs or dates, and the goals are not linked to particular hires.
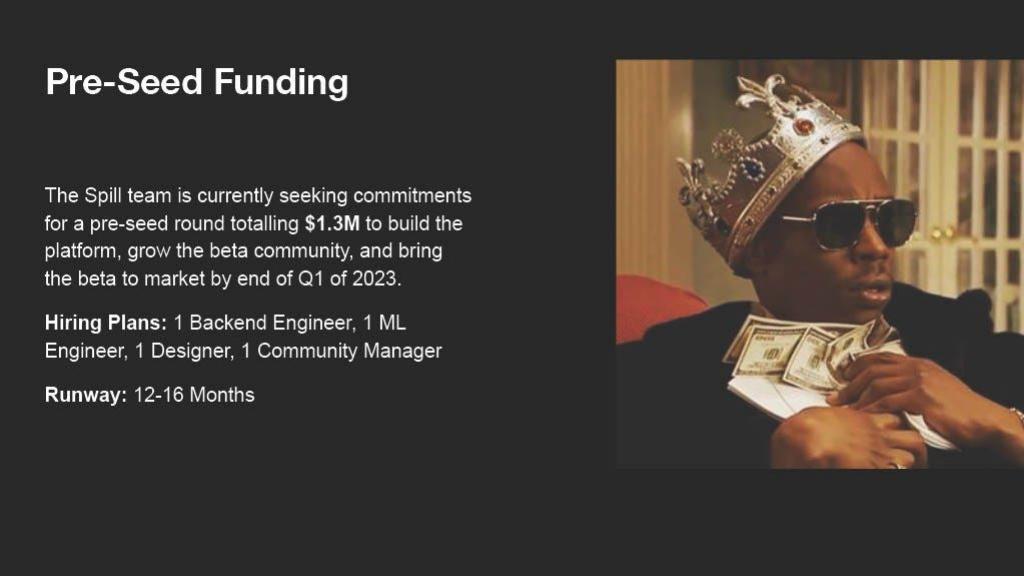
Spill deck, slide 13. Exact stored slide matched to this analysis.
Our analysis: Four specific roles, a dated milestone and a runway on one slide, so a reader can see the size of the team the round pays for.
Evidence and limitation: No costs or start dates, and the runway is a range with no burn to explain it. The slide does not say which hires the Q1 2023 beta depends on.
What a founder can adapt: Add each role's start date and cost; the four hires are probably most of the $1.3M, and the slide could show it.
Supporting analysis
What the deck claims: "Seeking commitments for a pre-seed round totalling $1.3M to build the platform, grow the beta community, and bring the beta to market by end of Q1 of 2023." "Hiring Plans: 1 Backend Engineer, 1 ML Engineer, 1 Designer, 1 Community Manager." "Runway: 12-16 Months."
Presentation choice: Four specific roles, a dated milestone and a runway on one slide, so a reader can see the size of the team the round pays for.
When it does not fit: No costs or start dates, and the runway is a range with no burn to explain it. The slide does not say which hires the Q1 2023 beta depends on.
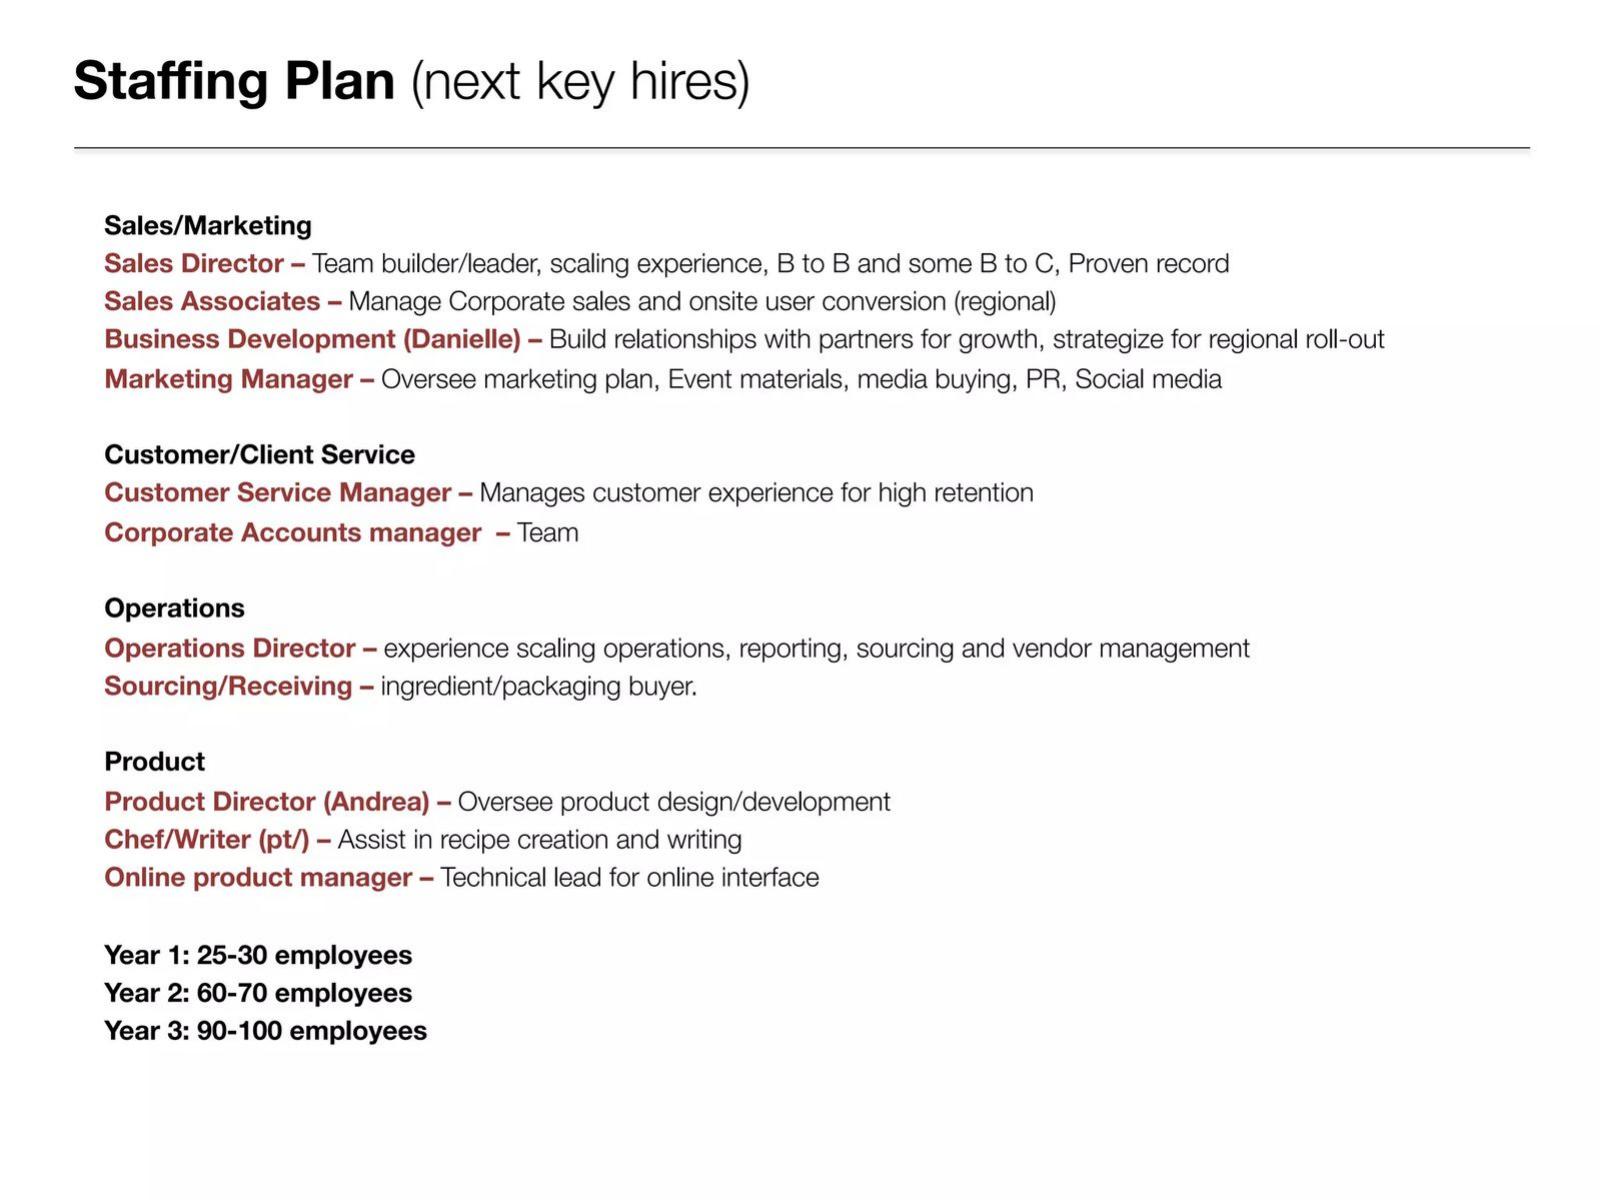
Food company. "Staffing Plan (next key hires)" slide.
Tomato Sherpa deck, slide 16. Exact stored slide matched to this analysis.
Our analysis: It describes what each role does and gives headcount growth over three years.
Evidence and limitation: No costs, no start dates within a year and no link to milestones; 25–30 employees in year one is far more than the eleven roles listed, and the slide does not say who the rest are.
What a founder can adapt: Mark which roles this round funds, in what order, and at what cost.
Supporting analysis
What the deck claims: Eleven roles in four groups (Sales/Marketing, Customer/Client Service, Operations, Product), each with a one-line responsibility; two are named people (Business Development: Danielle; Product Director: Andrea). "Year 1: 25-30 employees. Year 2: 60-70 employees. Year 3: 90-100 employees."
Presentation choice: It describes what each role does and gives headcount growth over three years.
When it does not fit: No costs, no start dates within a year and no link to milestones; 25–30 employees in year one is far more than the eleven roles listed, and the slide does not say who the rest are.
"Stated" means the slide gives it for every hire listed. Calculations are ours.
Example
Roles
Start timing
Cost
Milestone link
MySwimPro
Stated (4)
Stated (quarter)
Stated (salary range)
Not stated
Mattermark
Not stated (headcount only)
Stated (quarterly headcount)
Stated ($12,000/month average + 30%)
Not stated
Lincsphere
Not stated
Not stated
$235K in total
Listed as a milestone itself
Viso
Stated (2 senior hires)
Stated (half-year)
Not stated
Next to sales phase; revenue blanked
Harvest
3 of "3-4" stated
Not stated
Not stated
Goals listed, not linked
Spill
Stated (4)
Not stated
Not stated
One dated milestone, not linked
Tomato Sherpa
Stated (11)
Headcount by year only
Not stated
Not stated
Key Takeaways
Give each hire a role, a start quarter and a cost. MySwimPro does all three for four hires.
Show how headcount turns into burn. Mattermark multiplies team size by $12,000 a month, adds 30% and subtracts revenue, and every row checks out.
Say how the hires are paid for. Our estimate of MySwimPro's 2019 salaries exceeds its $100k target, and the slide does not say what else funds them.
Name the milestone each hire is for. Viso places a head of sales where enterprise sales begin, but its revenue targets are blanked out.
A list of roles is a start, not a plan. Harvest, Spill and Tomato Sherpa name roles with no start dates or costs.
Write your hiring plan
One line per hire, then a total that you check against the raise.
Role. The job title, not the department.
Start. Month or quarter after funding.
Cost. Annual salary and loaded monthly cost; say what the loading includes.
Milestone. What this hire makes possible, and what slips without it.
Total. Sum each hire's cost from its start date to the end of the runway. Does it fit the raise with the other costs?
Copyable framework: [Role], starts [month after funding], $[annual salary] ($[loaded monthly cost]), for [milestone by date]. Hires total $[cost within runway] of the $[raise].
Illustrative example 1 — written by us
Before: Hiring Plans: 1 Backend Engineer, 1 ML Engineer, 1 Designer, 1 Community Manager.
After: Backend Engineer, month 1, $[salary], for beta launch by [date]; ML Engineer, month 3, $[salary], for [feature]; … Hires total $[x] of the $[raise].
What improved: Each role gets a start, a cost and a purpose, and the total can be checked against the raise.
What this slide has to prove
For most early rounds, people are the largest cost. An investor wants to know whether the hires match the milestones the round promises, and whether their cost is inside the raise.
The main ask-slide guide suggests hiring as one line of the allocation and puts line-item hiring plans in the data room; the team guide says to name a gap and the hire that fills it; the roadmap guide shows CulturePulse placing hires in quarters. The burn-and-runway guide checks whether the raise, burn and runway agree. This page covers the hiring plan itself: which roles, when, at what cost, and for which milestone.
Four facts per hire
Role: a job title, not a department. "Backend Engineer" can be priced; "expand R&D team" cannot.
Start: a quarter or a month after funding. Without it, a reader cannot tell how much of a year's salary falls inside the runway.
Cost: salary or a loaded monthly cost, and whether it includes taxes, benefits and overheads. Mattermark states its average ($12,000 a month per employee) and adds 30% for G&A and marketing.
Milestone: what the hire is for. If a milestone slips without the hire, say so; if it doesn't, question whether the hire belongs in this round.
First-year cost versus full-year cost
Source fact: MySwimPro gives an annual salary range and a start quarter for each of its four hires. Our calculation: at full annual salaries the four roles cost $260,000–320,000 a year (two engineers at $80,000–100,000 and two roles at $50,000–60,000). The 2019 figure of $222,500–275,000 is lower only because the video producer and marketing manager start later in the year.
Practical point: a plan that shows only the first, partial year understates what the team costs once everyone is in place. If the round has to last past the end of the first year, the reader needs the full-year figure too, because every month after that is paid at the higher rate.
Employment costs a salary line leaves out
Source fact: MySwimPro's figures are labelled salary. The slide does not mention payroll taxes, benefits, equipment or recruiting fees. Mattermark instead uses one average of $12,000 a month per employee and adds 30% for G&A and marketing; the slide does not say what the $12,000 includes.
Assumption, for illustration only: if employment costs added 20% on top of salary, MySwimPro's 2019 range would become about $267,000–330,000 (our calculation). The 20% is not a benchmark and does not come from any slide here; use your own payroll and benefits quotes, and say on the slide whether your figure is salary or fully loaded cost.
What headcount growth does to monthly burn
Source fact: Mattermark's team grows from 9 people in Q1 2014 to 40 in Q4 2015 at an assumed $12,000 a month each. Our calculation: headcount expense rises from $108,000 a month to $480,000 a month, or about $140,400 to $624,000 once its 30% addition is applied. Monthly spending at the end of the plan is more than four times the starting level.
Harvest states that its $600,000 pre-seed round is for 12 months of runway, an average of $50,000 a month (our calculation). Lincsphere puts $235K of its $500,000 raise into people over 12 months, about $19,600 a month on average (our calculation). An average hides the timing: if hires arrive during the year, spending starts lower and ends higher, and the final months set the burn that the next round has to cover.
Tying later hires to milestones
Source fact: Viso places its head of sales in H1 2024, when direct and inside enterprise sales begin, and Spill ties its round to bringing the beta to market by the end of Q1 2023. Neither slide says what happens to a hire if the milestone slips.
Recommendation: split the plan into hires that start at funding and hires that start only when a stated milestone is met, such as a number of paying customers or a product release. Show the runway both ways. A reader can then see how long the money lasts if the later hires are delayed, and which milestone would trigger them.
Common mistakes
Departments instead of roles. "Expand R&D team" cannot be priced or timed.
Salaries without start dates. A reader cannot tell how much falls inside the runway.
Hires that exceed the raise. If the hires cost more than the round, say what else pays.
Hires with no purpose. Link each hire to the milestone it serves.
Headcount targets with no roles. "25-30 employees" needs the list that makes it up.
Diagnostic checklist
Every funded hire has a role, a start date and a cost.
Costs say whether they include taxes, benefits and overheads.
The total cost within the runway fits the raise, or the slide says what else pays.
Each hire is linked to a milestone.
The detailed plan is in the appendix or data room, with a summary on the ask slide.
Frequently asked questions
Should the hiring plan be on the ask slide or in the appendix?
The main ask-slide guide suggests keeping line-item hiring plans in the data room. MySwimPro and Spill fit a short plan on the ask slide; Mattermark gives the whole budget its own slide. A short list of key hires with timing and cost on the slide, and the detail behind it, works for either.
What cost per hire should I use?
These slides cannot tell you market salaries. Use your own offers or quotes, and say whether the figure is salary or loaded cost, as Mattermark does with its $12,000 monthly average.
How we chose these examples
Search (2026-09-30): the durable corpus index (docs/seo/artifacts/corpus-search, 70,729 unique pages across every deck page, deduplicated by deck-file sha256 + page) was searched for hiring plan, key hires, headcount and staffing with a role, date or amount.
Eleven pages were rendered from the original public deck files and ten were read against the text; seven are used: MySwimPro 15, Mattermark 31, Lincsphere 35, Viso 23, Harvest 14, Spill 13, Tomato Sherpa 16. All are founder pitch decks recorded in our deck inventory.
Checked and not used: DataCamp 17 (future key hires listed with no timing or cost; same lesson as Harvest and Spill), The Lumber Market 12 (year-one ramp from month 5 on a team slide, no costs), Venyoo 12 (roles only). Not rendered: Homecooks 21 (deck file unavailable). Leafly 43 and Yelp 3 are from listed or SPAC companies. CulturePulse 6 is already used in the roadmap guide.
All sums and pro-rated salaries marked "our calculation" are ours; MySwimPro's 2019 cost counts each hire from the start of its stated quarter. How we built this: drafted and checked with AI assistance (editorial model review against the original slide images); no human editor has reviewed this guide.