Tomato Sherpa entered the meal kit market with a distinct distribution thesis: instead of high-CAC direct-to-consumer shipping, they targeted corporate campuses to achieve 'delivery efficiency.' By partnering with large employers like LinkedIn and Adobe, they aimed to drop off bulk orders at offices for employees to take home. The deck highlights a $400k revenue run rate and a 65% retention rate from their 2014 pilot. Seeking $1.5M in convertible debt, the company projected a rapid scale-up to $57M in gross revenue by Year 4. While the B2B2C model offers lower acquisition costs, the deck reve…
Key takeaways
- The company identifies a $18B addressable market by multiplying a target population of 22 million by an $800 LTV (Slide 5).
- Tomato Sherpa claims a 65% annual retention rate and a $400k revenue run rate from its 2014 results (Slide 8).
- The business model relies on 'Group delivery' to offices to cut costs compared to home-shipping competitors like Blue Apron or HelloFresh (Slide 7).
- Unit economics cited include a $120 COA (Cost of Acquisition) against an $800 LTV, resulting in a 6.6x LTV/CAC ratio (Slide 4).
- The 'Investment Opportunity' is a $1.5M convertible debt raise with a 20% discount and a 24-month term (Slide 18).
- Financial projections suggest the company would reach profitability in the SF Bay Area within 8-9 months at a 2,500 customer threshold (Slide 9).
- The deck lists actual corporate partners including GoPro, LinkedIn, Workday, Pandora, and Adobe (Slide 5).
- The staffing plan projects a massive headcount increase from 22 employees in 2015 to 90-100 by 2017 (Slide 10).
Tomato Sherpa: The B2B2C Meal Kit Strategy
Tomato Sherpa presents a detailed 19-slide deck that attempts to solve the 'dinner dilemma' through a unique distribution lens. Unlike the venture-backed giants of the mid-2010s that spent heavily on Facebook ads and shipping cardboard boxes to doorsteps, Tomato Sherpa focused on the corporate office as a hub. This teardown examines the mechanics of their model, their financial projections, and the operational hurdles inherent in their plan.
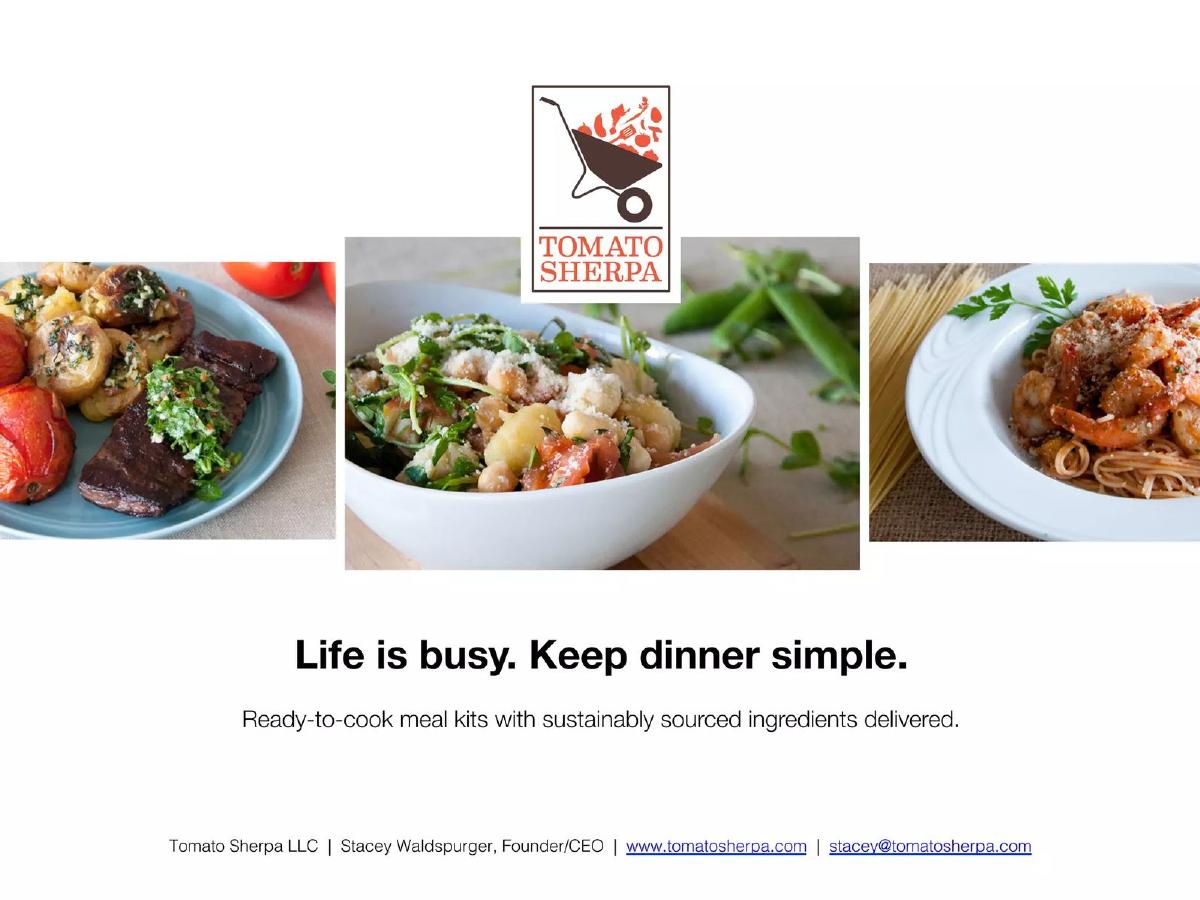
Slide 1: Title and Mission
The cover slide establishes the brand identity with a logo featuring a wheelbarrow full of produce. The tagline, "Life is busy. Keep dinner simple," positions the product as a convenience play. It identifies the founder and CEO as Stacey Waldspurger and provides a clear value proposition: "Ready-to-cook meal kits with sustainably sourced ingredients delivered."
Slide 2: The Problem and Solution
The deck identifies a 'Dinner dilemma' based on three statistics: 27% of American adults cannot cook, 79% enjoy cooking, and 85% want to eat more healthfully. The slide argues that while the desire to cook is high, the barriers of time and skill are higher. The solution is described as a "fail-proof" subscription service delivered in reusable packaging.
Slide 3: Product Details
This slide outlines the mechanics of the service. Subscriptions are flexible, offering two or four portions at a price point of $9-$12 per portion. The menu includes 6-8 choices weekly, covering meat, vegetarian, gluten-free, and dairy-free options. A key operational note is the "30 min" cooking time and the use of "reusable insulated tote and ice packs," which hints at a circular logistics model.
Slide 4: Go-to-Market and Unit Economics
This is a critical slide for the B2B2C thesis. The strategy is to sell to corporate wellness teams who then promote the service to employees. The customer profile is 28-54 year old professionals. The unit economics are stated as follows: Ave. customer value: $44 weekly , 12 month retention: 65% , COA: $120 , and LTV: $800 . They target a 5% user penetration rate per company.
Slide 5: Market Size and Partners
The company claims a $18,000,000,000 Addressable Market . This is calculated by taking 40,000 target companies in the US, estimating a 22,000,000 target user population, and multiplying by the $800 LTV. Notably, the slide lists "Actual partners" including LinkedIn, GoPro, 2K, Adobe, and Workday, which lends significant credibility to their pilot phase.
Slide 6: Growth Areas
Tomato Sherpa positions itself at the intersection of three trends: Corporate Wellness (15% y/y growth), Online Grocery (13% y/y growth), and Conscientious Consumption (15% growth in organic/local). They list competitors and peers in these spaces, such as Mercer and Zipongo for wellness, and Amazon Fresh and Instacart for grocery.
Slide 7: Competition
The competitive matrix uses two axes: Sustainable Sourcing and Delivery Efficiency. Tomato Sherpa places itself in the top-right quadrant, claiming superior delivery efficiency due to "Group delivery" and superior sustainability due to "Reusable packaging." Competitors like Blue Apron, HelloFresh, and Plated are placed in the lower-left quadrant (lower efficiency, lower sustainability).
Slide 8: 2014 Results
The deck provides proof of concept from 2014. Key metrics include 30,000 meals delivered , a $400K Revenue run rate , and >65% retention per year . They also note 20+ partnerships and 50+ companies in the sales pipeline.
Slide 9: The Next 12 Months
This slide transitions from the pilot to the scale-up phase. The goal is to break even at 2,500 customers in the SF Bay Area within 8-9 months. They project a $4M revenue period and plan to onboard 20 team members. A chart shows the intersection of revenue, COGS, and SGA/OPS, with revenue reaching approximately $468k monthly by month 12.
Slide 10: Aggressive Growth Projections
The three-year outlook is ambitious. They project gross revenue growing from $4,041,229 in Year 2 to $57,174,890 in Year 4 . The model assumes a 1.5M investment and launching in a new market every 8 months. Gross profit margins are expected to improve from 39% to 48% over this period.
Slide 11: The Team
The leadership team consists of Stacey Waldspurger (CEO), Andrea Barrow (Product Development), and Danielle Boule (Sales). The slide also lists a robust group of advisors, including the CEO of The Fruit Guys and the Head of Market Intel at Google. This suggests a strong network in both the food industry and the corporate tech world they are targeting.
Slide 12-17: Appendix and Operational Depth
The appendix slides provide a granular look at the business. Slide 13 breaks down Key Growth Activities , totaling $635,640 in investment requirements for staff and infrastructure. Slide 14 details the Acquisition funnel, from commission sales teams to ambassador programs. Slide 15 provides a full 3 Year Financial Model , showing a transition from a $911k operating loss in Year 2 to a $15.5M operating income in Year 4. Slide 16 outlines the Staffing Plan , and Slide 17 lists Strategic Partners in discussion, such as Laundry Locker and Farmigo.
Slide 18: Investment Opportunity
The 'Ask' is clearly defined: $1.5M in convertible debt . The funds are split between reaching profit in the SF Bay Area ($800k) and beginning a rollout in a new region ($700k). The terms are a 20% discount and a 24-month term. Exit scenarios include acquisition by a strategic partner in years 5-8 or dividend payouts.
Slide 19: Contact and Testimonial
The final slide includes a customer testimonial and contact information for the CEO. The testimonial emphasizes the emotional benefit: "excited to come home to cook."
What Works in This Deck
The most compelling aspect of the Tomato Sherpa deck is the B2B2C distribution thesis . By naming actual corporate partners like LinkedIn and Adobe (Slide 5), the founders prove that their 'delivery efficiency' model isn't just theoretical—they have successfully bypassed the high CAC of the open web by going through HR departments. The inclusion of a detailed 3-year financial model (Slide 15) and a pre-profit cost breakdown (Slide 13) shows a level of fiscal maturity often missing in early-stage decks. They clearly understand that their business is a logistics game as much as a food game.
What Is Missing or Weak
The deck is light on unit economics at the meal level . While they provide a price per portion ($9-$12 on Slide 3), they do not explicitly break down the COGS per meal (food cost vs. packaging vs. labor). Given the 'reusable packaging' model, the cost of cleaning, tracking, and replacing lost totes is a significant operational risk that isn't addressed. Furthermore, the Market Size calculation (Slide 5) is somewhat aggressive; multiplying a total population by a lifetime value (LTV) is a common but often criticized way to calculate TAM, as it assumes 100% market capture over a long duration.
Founder Takeaways
Leverage B2B for B2C: If you are in a crowded consumer space, find a 'hub' (like an office or a school) to lower your acquisition and delivery costs. · Show, Don't Just Tell, Your Partners: Listing recognizable logos of pilot partners (Slide 5) is the fastest way to build investor trust. · Detail the 'Ask': Tomato Sherpa didn't just ask for $1.5M; they explained exactly how that money would be split between regional profitability and expansion (Slide 18). · Operational Transparency: Including a staffing plan (Slide 16) and a breakdown of infrastructure costs (Slide 13) shows investors you have a plan for the 'unsexy' parts of scaling.
Frequently asked questions
- What is Tomato Sherpa's primary competitive advantage?
- According to Slide 7, their advantage is 'Delivery Efficiency.' By utilizing group delivery to corporate offices and a reusable packaging system, they aim to lower the high logistics costs that plague traditional direct-to-home meal kit services like Blue Apron and Plated.
- How does the company acquire customers?
- The strategy is B2B2C. As shown on Slide 4 and Slide 14, they sell to corporate wellness and employee services teams first. These employers then promote the service to staff, allowing Tomato Sherpa to sign up users via on-site events and direct email.
- What are the specific terms of the investment being sought?
- Slide 18 specifies a $1.5M convertible debt raise. The terms include a 20% discount on the next round and a 24-month term for conversion into preferred shares. They also list potential exit scenarios as acquisition or dividend payouts.
- What were the company's historical financial results?
- Slide 8 details the 2014 results, which served as a 12-month proof of concept. The company delivered 30,000 meals, achieved a $400k revenue run rate, and maintained a retention rate of over 65%.
- What are the projected margins for the business?
- Slide 15 provides a 3-year financial model. Gross margins are projected to grow from 33% ($0.33 per dollar) in Year 2 to 47% ($0.47 per dollar) in Year 4 as the company scales and optimizes operations.