Biotech Pitch Deck Pipeline Slides: Real Examples and What
How biotech startups present a drug pipeline in a pitch deck: phase charts, milestones, catalysts and platform slides.
Biotech Pitch Deck Pipeline Slides: Real Examples and What Works
Compare nine real biotech pipeline and platform slides, then connect each programme’s present stage to a dated catalyst, ownership, and the milestone this round funds.
TL;DR
A biotech pipeline slide should show each programme’s current development stage, the next dated catalyst, and which milestones the financing reaches. These examples show how clinical, platform, and pre-seed companies adapt that structure without presenting plans as achieved progress.
Pipeline slides from real biotech decks
Each example pairs the exact pipeline or platform slide from its public deck with specific analysis when the image is available. Stage, milestone, and market claims remain company statements; missing exact images are recorded and never substituted.
AgomAb Therapeutics roadmap slide — slide 4
Growth-factor-targeting therapeutics, Series B.
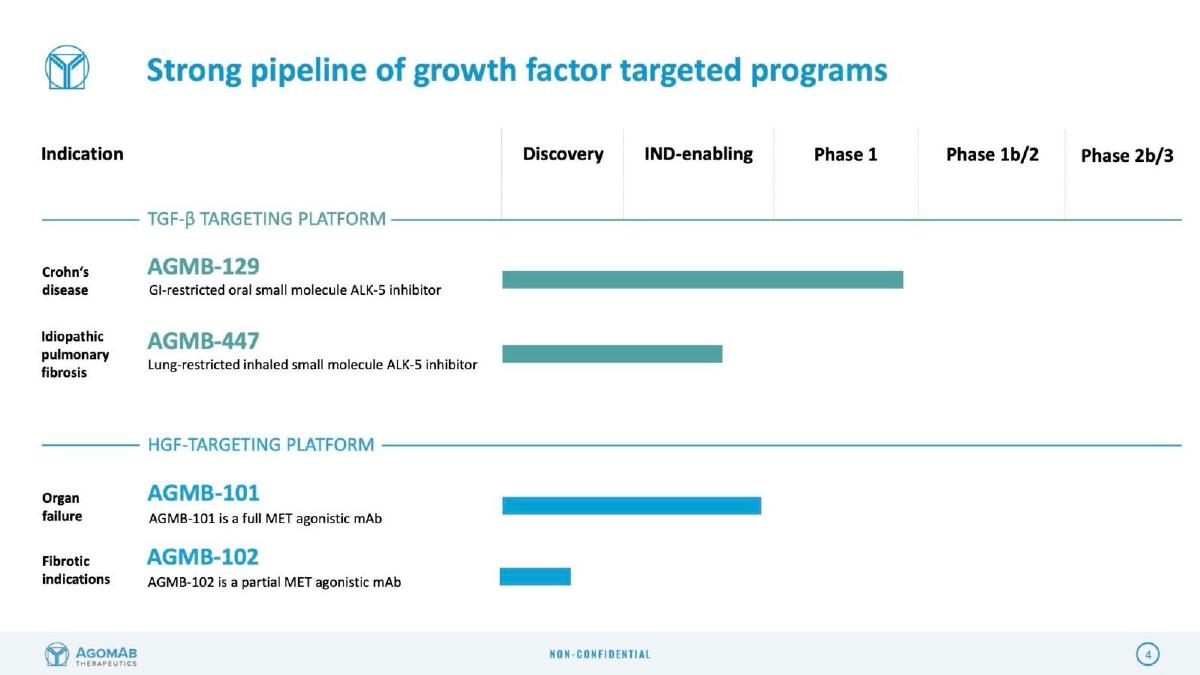
AgomAb Therapeutics deck, slide 4. Exact stored slide matched to this analysis.
Our analysis: Each row names the modality and the delivery approach, which tells a specialist investor the scientific thesis for each programme in a few words.
Evidence and limitation: Merged phase columns (Phase 1b/2) should be explained in a footnote, since they imply a specific trial design.
What a founder can adapt: Group rows by platform so investors see how programmes relate to each other and to the core science.
Supporting analysis
What the deck claims: "Strong pipeline of growth factor targeted programs" with columns for discovery, IND-enabling, Phase 1, Phase 1b/2 and Phase 2b/3, and rows grouped by platform, including a gut-restricted oral small molecule for fibrostenotic Crohn's disease and a lung-restricted inhaled small molecule ALK-5 inhibitor.
Presentation choice: Each row names the modality and the delivery approach, which tells a specialist investor the scientific thesis for each programme in a few words.
When it does not fit: Merged phase columns (Phase 1b/2) should be explained in a footnote, since they imply a specific trial design.
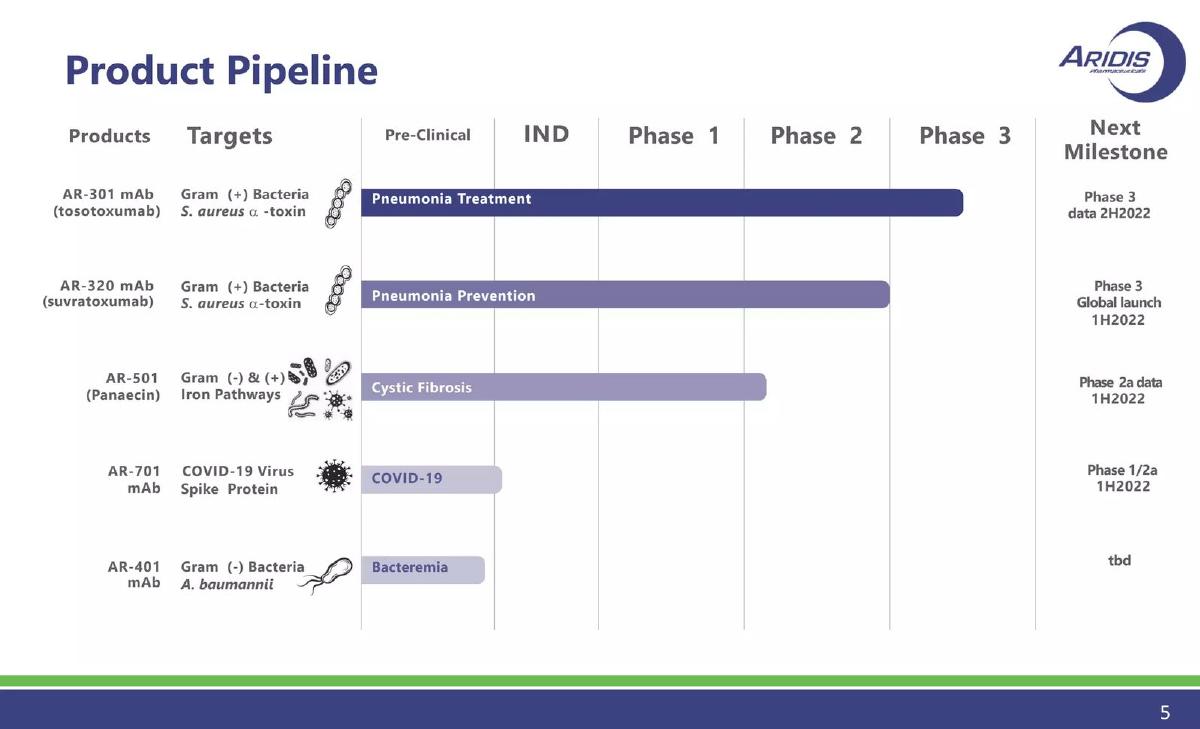
Aridis Pharmaceuticals deck, slide 5. Exact stored slide matched to this analysis.
Our analysis: The milestone column with half-year dates is exactly what investors look for: the next data event per programme.
Evidence and limitation: Many programmes across very different targets can blur focus; make the lead asset visually distinct.
What a founder can adapt: Add a dated milestone to every clinical programme, using half-year precision if exact dates are uncertain.
Supporting analysis
What the deck claims: A product pipeline with pre-clinical, Phase 1, Phase 2 and Phase 3 columns, targets for each programme (including S. aureus alpha-toxin and a COVID-19 spike-protein antibody), and a milestone column with dated half-year catalysts.
Presentation choice: The milestone column with half-year dates is exactly what investors look for: the next data event per programme.
When it does not fit: Many programmes across very different targets can blur focus; make the lead asset visually distinct.
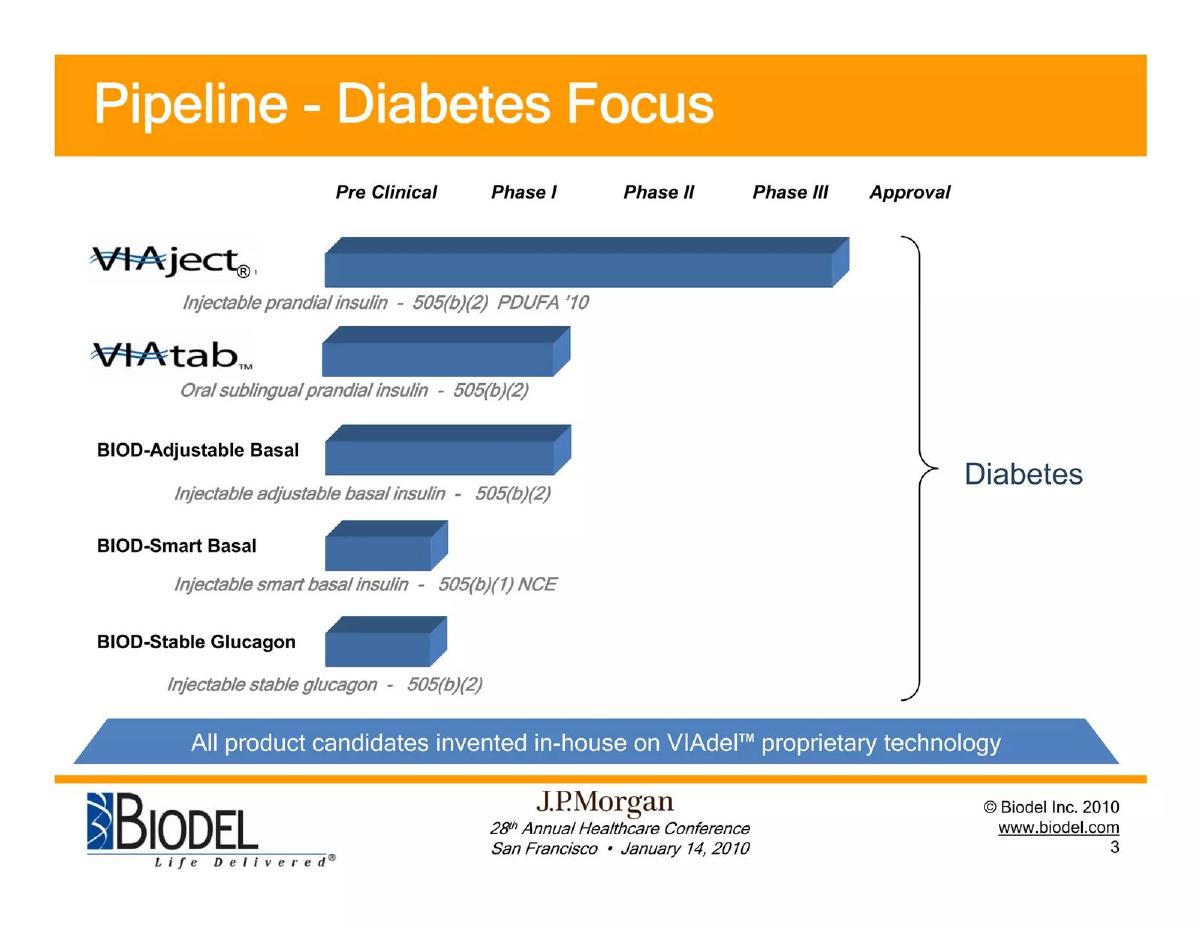
Biodel deck, slide 4. Exact stored slide matched to this analysis.
Our analysis: Naming the regulatory pathway on each row tells investors how much new clinical evidence each programme needs.
Evidence and limitation: A single therapeutic focus is a strength, but show how programmes differentiate from each other.
What a founder can adapt: If you are using an abbreviated pathway, show it on the row; it changes cost and timeline expectations.
Supporting analysis
What the deck claims: "Pipeline — Diabetes Focus" with pre-clinical, Phase I, Phase II, Phase III and approval columns, listing injectable and oral sublingual prandial insulins and basal insulins, each tagged with the 505(b)(2) regulatory pathway and a PDUFA date for the lead.
Presentation choice: Naming the regulatory pathway on each row tells investors how much new clinical evidence each programme needs.
When it does not fit: A single therapeutic focus is a strength, but show how programmes differentiate from each other.
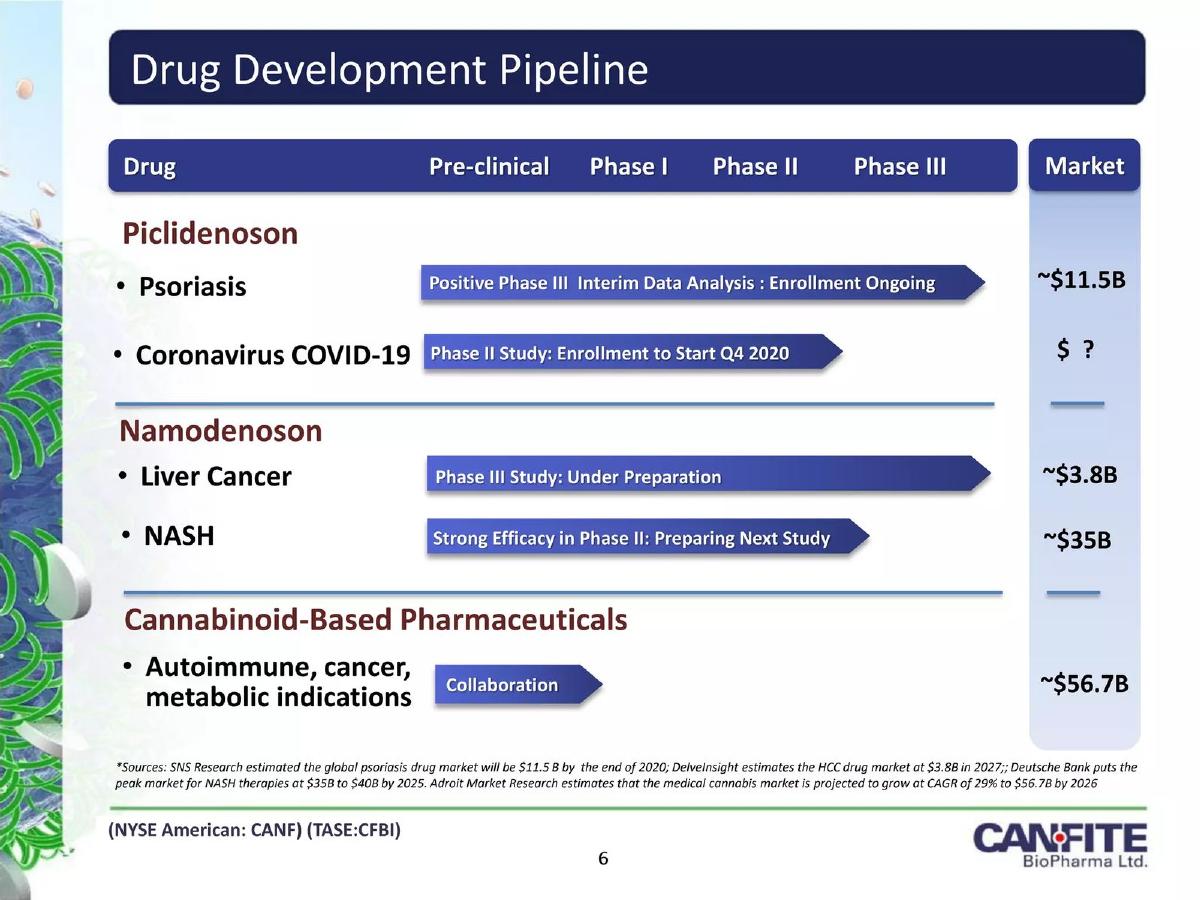
Can-Fite BioPharma deck, slide 6. Exact stored slide matched to this analysis.
Our analysis: Short status notes on each bar tell the investor what has happened and what is next without a separate slide.
Evidence and limitation: Market sizes on the same slide need sources; otherwise move them to a market slide.
What a founder can adapt: Write a one-line status for each programme: the last result and the next step.
Supporting analysis
What the deck claims: A drug development pipeline with pre-clinical to Phase III columns and a status note per programme — for psoriasis, positive Phase III interim data with enrolment ongoing; for NASH, strong efficacy in Phase II and preparation of the next study — plus an estimated market size per indication.
Presentation choice: Short status notes on each bar tell the investor what has happened and what is next without a separate slide.
When it does not fit: Market sizes on the same slide need sources; otherwise move them to a market slide.
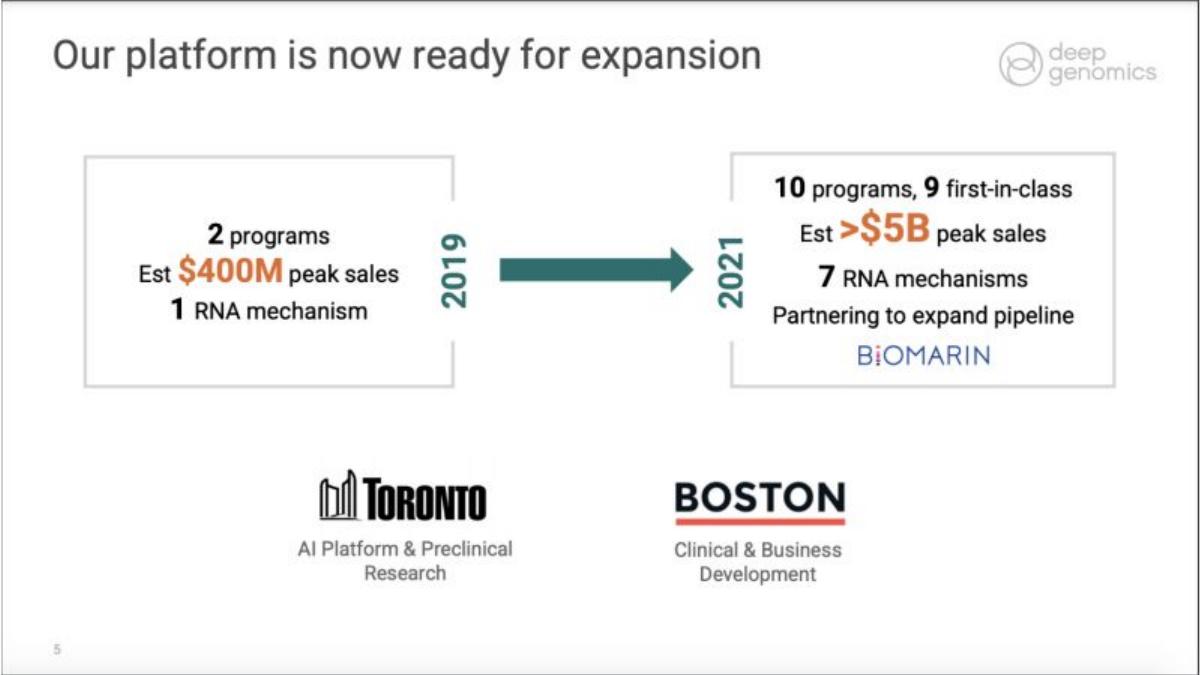
Deep Genomics deck, slide 5. Exact stored slide matched to this analysis.
Our analysis: For a platform company, a count of programmes produced is evidence that the platform works, which is the real investment thesis.
Evidence and limitation: Aggregated peak-sales estimates across early programmes should be clearly labelled as estimates with stated assumptions.
What a founder can adapt: If you are a platform company, show how many candidates the platform has generated and how quickly.
Supporting analysis
What the deck claims: "Our platform is now ready for expansion": ten programmes, nine described as first-in-class, estimated peak-sales ranges for groups of programmes, and a note on partnering to expand the pipeline, naming partners.
Presentation choice: For a platform company, a count of programmes produced is evidence that the platform works, which is the real investment thesis.
When it does not fit: Aggregated peak-sales estimates across early programmes should be clearly labelled as estimates with stated assumptions.
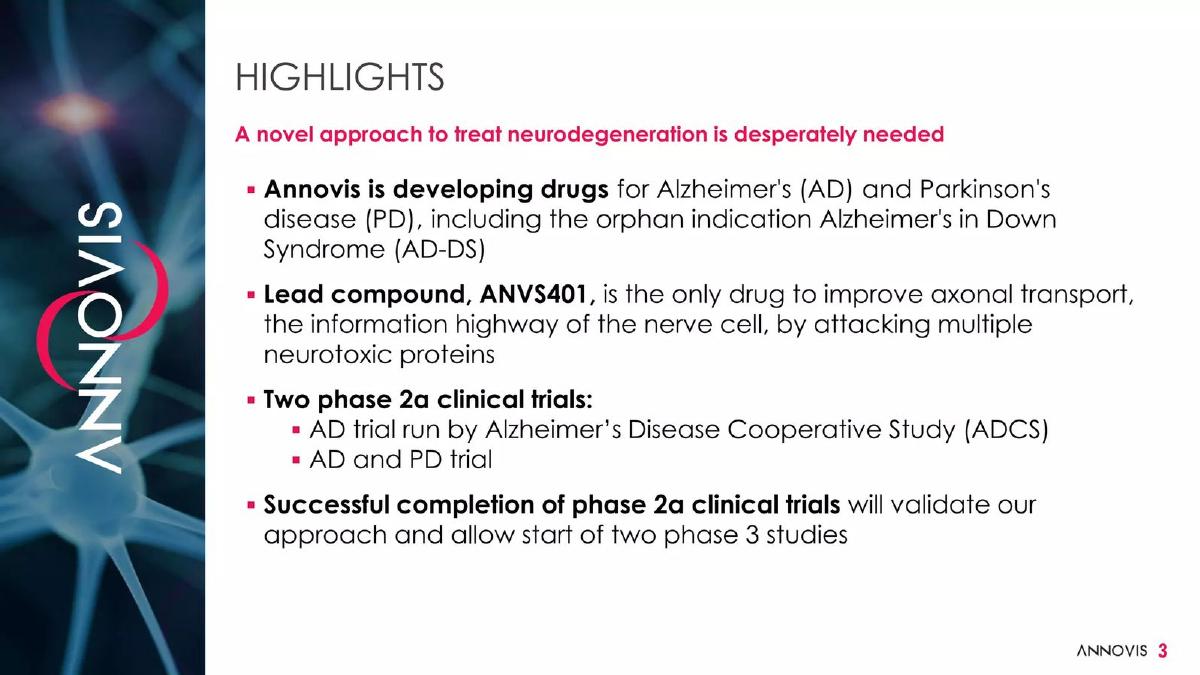
Annovis Bio deck, slide 3. Exact stored slide matched to this analysis.
Our analysis: It connects the current trials to the next value step in one sentence, which is the core of a pipeline argument.
Evidence and limitation: Mechanism claims like "the only drug to" need to be precise and supportable; specialist investors will test them.
What a founder can adapt: State explicitly what a successful readout unlocks: the next phase, a partnership or a financing.
Supporting analysis
What the deck claims: A highlights slide: drugs for Alzheimer's and Parkinson's disease including an orphan indication, a lead compound described as improving axonal transport by attacking multiple neurotoxic proteins, two Phase 2a trials, and the statement that successful completion would allow the start of two Phase 3 studies.
Presentation choice: It connects the current trials to the next value step in one sentence, which is the core of a pipeline argument.
When it does not fit: Mechanism claims like "the only drug to" need to be precise and supportable; specialist investors will test them.
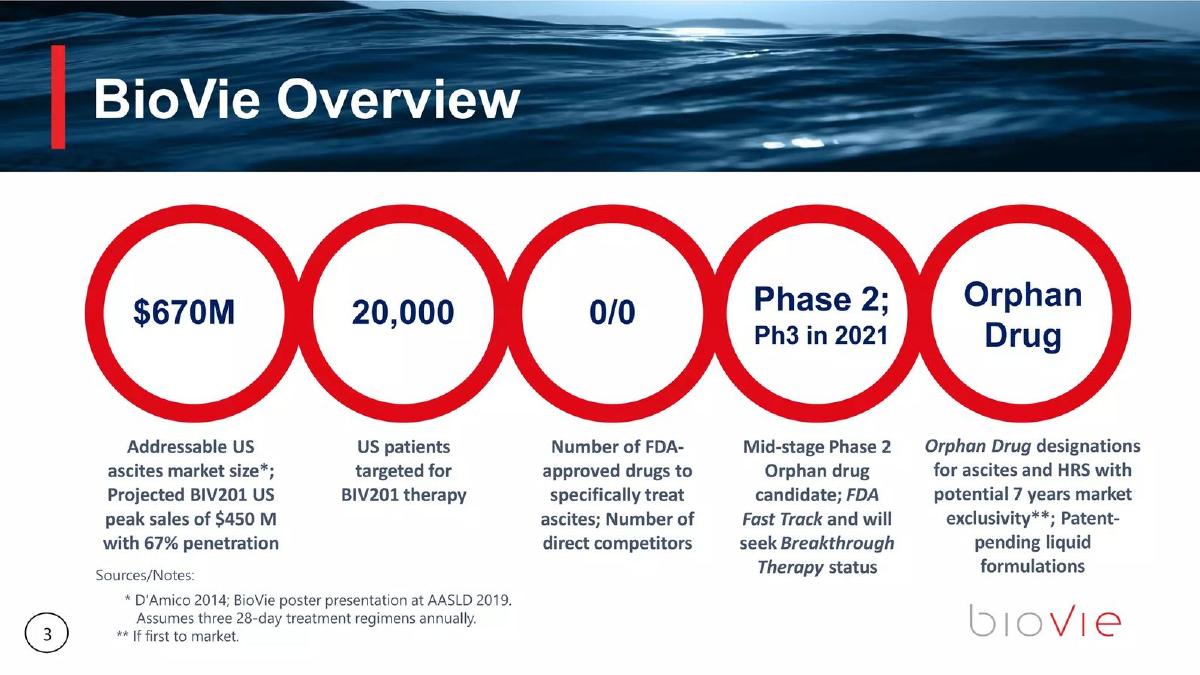
BioVie deck, slide 3. Exact stored slide matched to this analysis.
Our analysis: It shows designations, stage and market in one place and footnotes the assumptions behind the sales projection.
Evidence and limitation: Penetration assumptions in peak-sales projections are often challenged; show a range rather than a single figure.
What a founder can adapt: When you cite designations, state whether each is granted or sought, as this slide does for fast track.
Supporting analysis
What the deck claims: An overview listing a mid-stage Phase 2 candidate, orphan drug designations for ascites and hepatorenal syndrome, fast track status sought, an addressable US market estimate, US patient numbers, a targeted Phase 3 year and projected peak sales, with footnoted assumptions.
Presentation choice: It shows designations, stage and market in one place and footnotes the assumptions behind the sales projection.
When it does not fit: Penetration assumptions in peak-sales projections are often challenged; show a range rather than a single figure.
Protein and molecular engineering platform, Series A.
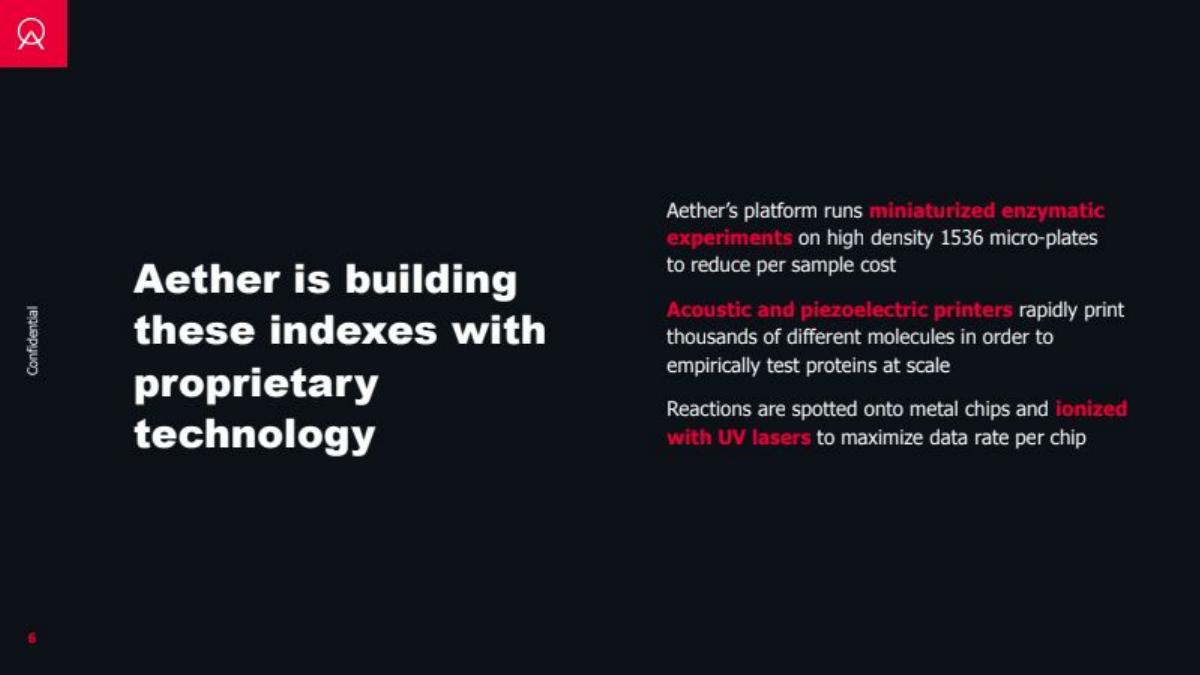
Aether deck, slide 6. Exact stored slide matched to this analysis.
Our analysis: For a platform outside drug development, the roadmap is about throughput and cost per experiment, and the slide quantifies both.
Evidence and limitation: Technical detail should be paired with the product lines the platform will produce and when.
What a founder can adapt: If your pipeline is a platform, show the capacity metric that drives output rather than a clinical chart.
Supporting analysis
What the deck claims: Describes building searchable protein-reaction indexes with proprietary technology: high-density 1536 micro-plates to reduce per-sample cost and rapid printing of thousands of molecules to test proteins at scale.
Presentation choice: For a platform outside drug development, the roadmap is about throughput and cost per experiment, and the slide quantifies both.
When it does not fit: Technical detail should be paired with the product lines the platform will produce and when.
Plans to sell bioreactor technology to researchers and CROs, market blood-brain-barrier testing to small-molecule companies, and, after side-by-side testing against animal data, enter the drug discovery process for pharmaceutical companies.
The exact biotech pipeline slide image is not present in the stored slide-image set. No substitute is used.
Our analysis: A pre-seed company without programmes shows a staged path — sell tools, validate against animal data, then integrate into discovery — instead of forcing a clinical chart.
Evidence and limitation: Put approximate dates or conditions on each stage; a sequence without timing is hard to fund against.
What a founder can adapt: At pre-seed, present validation milestones and the evidence each will produce.
Supporting analysis
What the deck claims: Plans to sell bioreactor technology to researchers and CROs, market blood-brain-barrier testing to small-molecule companies, and, after side-by-side testing against animal data, enter the drug discovery process for pharmaceutical companies.
Presentation choice: A pre-seed company without programmes shows a staged path — sell tools, validate against animal data, then integrate into discovery — instead of forcing a clinical chart.
When it does not fit: Put approximate dates or conditions on each stage; a sequence without timing is hard to fund against.
The right pipeline slide depends on what the company is actually raising on.
Company type
What the slide should emphasise
Common mistake
Single lead asset
Next dated catalyst, trial design, what this round funds
Padding with discovery programmes
Multi-asset clinical
Status and milestone per programme, ownership and partners
No visual priority for the lead
Discovery platform
Programmes generated, speed, partnerships
Clinical chart with every bar in column one
Pre-seed / tools-first
Validation steps and evidence each will produce
Implying drug-development timelines it cannot support
Abbreviated pathway
Regulatory route per programme and its evidence needs
Not naming the pathway
Key Takeaways
Put the next catalyst beside the current stage. Aridis uses half-year milestone dates, while Can-Fite adds a short status note for each programme.
Make the regulatory path explicit. Biodel labels 505(b)(2) on each relevant row, and BioVie distinguishes granted orphan designations from fast-track status sought.
Show what the platform produces. Deep Genomics uses programme count and partnerships as evidence of platform output; Aether uses throughput and cost per experiment.
Do not force a clinical chart too early. Genicell instead shows validation steps that could move its testing technology into drug discovery.
Build your biotech pipeline slide
Show present evidence and future catalysts without extending progress bars into planned work.
Programmes. For each row, name the asset, modality or mechanism, indication, and ownership or partner status.
Current stage. End each bar at the stage supported today; show planned work with a separate marker.
Catalyst. Add the next value-creating event and a realistic half-year or year.
Financing. Mark which catalysts this round is intended to fund and what evidence they will produce.
Copyable framework: [Programme] is at [current stage]; [next catalyst] is planned for [date], with [ownership/partner] and this round funding [scope].
Illustrative example 1 — written by us
Before: Lead programme moving toward Phase 2
After: Lead asset is completing Phase 1; topline safety data planned for 2H 2027, with this round funding the Phase 2-ready package
What improved: The rewrite separates present stage, dated catalyst, and intended use of financing.
Why biotech decks need a different roadmap slide
Most roadmap slides describe product features and launch dates. In drug development, value is created in discrete steps set by regulation and clinical evidence: filing an investigational new drug application, completing each clinical phase, and ultimately approval. The pipeline slide is organised around those steps because investors price the company largely on where its programmes sit and on the probability of moving to the next one.
The U.S. Food and Drug Administration describes the clinical phases in terms investors know well. Phase 1 typically involves 20 to 100 healthy volunteers or people with the condition, lasts several months and focuses on safety and dosage. Phase 2 involves up to several hundred people with the condition, lasts several months to two years and looks at efficacy and side effects. Phase 3 involves 300 to 3,000 volunteers with the condition over one to four years. Each column on a pipeline chart therefore implies a scale of cost, time and evidence.
The FDA also publishes approximate transition rates: roughly 70% of drugs move from Phase 1 to the next phase, about 33% from Phase 2, and about 25–30% from Phase 3. Investors carry figures like these in their heads when they read a pipeline, which is why a programme at Phase 2 is valued very differently from one in discovery, and why founders should not present early programmes as if they were near the market. (U.S. Food and Drug Administration)
The anatomy of a pipeline chart
Rows. One row per programme, with a code name, the target or mechanism, the modality (small molecule, antibody, cell therapy and so on) and the indication. Group rows by platform or therapeutic area if you have several.
Columns. The development stages that apply to your programmes. A common set is discovery, preclinical or IND-enabling, Phase 1, Phase 2 and Phase 3, sometimes with approval or commercial at the end. Use the stages that fit your modality; a medical device or diagnostic will use a different sequence.
Bars. Each bar ends where the programme is today. Do not extend bars to where you hope to be. If you want to show plans, add a separate marker or a milestone column with a date — for example "Phase 2 data 2H" followed by the year.
Partner and rights information. If a programme is partnered, licensed or funded by a grant, show it on the row. Investors need to know which programmes the company owns outright and which share economics with someone else.
Milestones: the part investors read first
Experienced biotech investors often read the milestone column before the bars. They want to know what the next catalyst is, when it will happen and how much it will cost to get there. A milestone column with dated events — IND filing, first patient dosed, interim data, topline data — turns the chart into a financing plan.
The IND step deserves precision. The FDA states that once an IND is submitted, the sponsor must wait 30 calendar days before initiating any clinical trials, during which the agency reviews it for safety. If your plan depends on starting a Phase 1 study soon after filing, show that you have accounted for this review period and for the preclinical work needed to support the filing.
Connect the milestones to the ask. The most persuasive pipeline slides make it obvious which milestones this round funds. A simple bracket or shading labelled "funded by this round" answers the investor's main question: if I invest now, what will the company have proven by the time it needs to raise again? (U.S. Food and Drug Administration)
Regulatory designations and how to show them
Designations such as orphan drug and fast track can be material to value, and many decks mention them on the pipeline slide or a nearby highlights slide. Show them accurately: state which designation, which programme, which indication and whether it has been granted or only applied for.
The FDA lists the incentives available for orphan drug designation, including tax credits for qualified clinical trials, exemption from user fees and potential seven years of market exclusivity after approval. The word potential matters; exclusivity depends on approval and other conditions.
Fast track, in the FDA's words, is a process designed to facilitate the development and expedite the review of drugs to treat serious conditions and fill an unmet medical need. It does not guarantee approval or change the evidence needed. Presenting a designation as if it shortens the path to market more than it does is a common way to lose credibility with specialist investors. (U.S. Food and Drug Administration, U.S. Food and Drug Administration)
Platform companies: when the pipeline is a product of the platform
Some biotech companies are raising on a discovery platform rather than a single asset. Their pipeline slide has a second job: to show that the platform produces programmes, not just that programmes exist. Deep Genomics' slide, for example, pairs a count of programmes with the statement that the platform is ready for expansion and names partners, turning the pipeline into evidence of the platform's output.
For a platform company, show how programmes were generated, how long it took the platform to reach each candidate, and which programmes are partnered. Investors will ask whether the platform is a real engine or a narrative wrapped around one asset; a pipeline that shows repeated output answers that question.
Early-stage platform companies with no clinical programmes should not force a clinical pipeline chart. A chart of discovery-stage bars all ending in the first column communicates little. Instead, show the platform's validation data and the milestones that will turn it into programmes, as Genicell's pre-seed deck does by describing how side-by-side testing against animal data would let it enter the drug discovery process.
Market numbers on pipeline slides
Many pipeline slides include estimated market size or peak sales per programme. These numbers attract scrutiny. If you include them, state the source and the assumptions — patient population, price, penetration and treatment duration — in a footnote or the appendix.
Market figures on older decks are especially risky, because treatment standards, competitor approvals and pricing change. An investor who finds a peak-sales estimate built on a competitor landscape that no longer exists will discount the rest of the slide.
When in doubt, put market sizing on its own slide and keep the pipeline slide focused on development stage, milestones and ownership.
Common mistakes
Bars that show hopes, not status. Each bar should end where the programme is today. Show plans as dated milestones.
No dated catalyst. Without a next milestone and date, investors cannot connect the pipeline to the round.
Too many early programmes. A long list of discovery-stage rows dilutes attention from the lead asset.
Overstating designations. State whether orphan or fast track status is granted or sought, and do not imply it guarantees approval.
Unsourced peak sales. Market and sales estimates need stated assumptions, or they undermine the slide.
Hiding partnerships. Show which programmes are licensed or partnered; economics matter to valuation.
Ignoring the IND review window. Plans to start trials must account for the FDA's 30-day review after an IND is submitted.
Diagnostic checklist
One row per programme with modality, target and indication.
Stage columns fit your modality and regulatory pathway.
Bars end at current status only.
Every clinical programme has a dated next milestone.
The milestones this round funds are clearly marked.
Designations are named with granted or sought status.
Partnered or licensed programmes are labelled.
Market estimates are sourced or moved to a separate slide.
Frequently asked questions
What is a pipeline slide in a biotech pitch deck?
A chart showing each programme in development, its target and indication, how far it has progressed through development stages, and the next milestones. It plays the role of the roadmap slide in other decks.
What stages should a drug pipeline chart show?
Typically discovery, preclinical or IND-enabling, Phase 1, Phase 2 and Phase 3, sometimes with approval. The FDA describes Phase 1 as mainly about safety and dosage, Phase 2 about efficacy and side effects, and Phase 3 as larger studies of efficacy and adverse reactions. (U.S. Food and Drug Administration)
How long after filing an IND can a trial start?
The FDA says the sponsor must wait 30 calendar days after submitting an IND before starting clinical trials, while the agency reviews it for safety. (U.S. Food and Drug Administration)
Should I include orphan drug designation on the pipeline slide?
Yes, if granted, and state which programme and indication. The FDA lists potential incentives including tax credits, user-fee exemption and potential seven years of market exclusivity after approval. (U.S. Food and Drug Administration)
How many programmes should a seed biotech show?
As many as are real, but make the lead asset or platform validation the clear focus. Investors fund the next catalyst, not the length of the list.
Do investors expect peak-sales figures on the pipeline slide?
Not necessarily. If included, give assumptions and sources. Many decks keep sizing on a separate market slide.
How we chose these examples
Corpus: published pitch deck teardowns on StartupFundraising.com in the biotech sector, plus therapeutics and pharma decks identified by company name. Founder-uploaded private decks are excluded entirely.
Selection: we searched extracted slide text for pipeline terms together with phase, preclinical, discovery or IND. We read the matching slides and chose nine that show a clear approach, including two platform and one pre-seed example where a clinical chart would not fit.
Review: examples were selected and described by our editorial model from the extracted slide text and checked against that text. No person has yet reviewed these examples for this page.
Stage, milestone and market claims are the companies' own statements, often from older decks; programmes may have progressed, changed or stopped since. We have not verified them.
Regulatory facts are cited to FDA pages retrieved on 2026-09-23. This page is not regulatory, legal or investment advice.
We make no claim that any pipeline slide caused a fundraising outcome.