How drug and therapeutics companies size their market: patients × annual treatment cost, existing drug sales, or disease-market reports.
Biotech Market Slide: Patients, Price and the Drugs You Replace
A drug company's market is not a download count or a subscription base. It is the number of patients who could receive the therapy, what a year of treatment costs, and how much of that the drug could realistically take from what doctors use today. The slides below size that in three different ways, and each leaves different questions open.
TL;DR
Size a therapy by patients × annual cost of treatment, then show the peak-sales share you assume. BioVie is the clearest example: 20,000 targeted US patients, a $670M addressable market with its dosing assumption footnoted, and projected peak sales of $450M at 67% penetration. The other common method, quoting current sales of the drugs you want to replace (IntelGenx, Georgiamune, Medgenics), tells investors the spend exists but not how much of it your drug can win.
Biotech market slides from real pitch decks
Each example shows the slide above its analysis and links to the full teardown. Slides that build the market from patients come first. Claims are as shown on the slides; comments and calculations are ours.
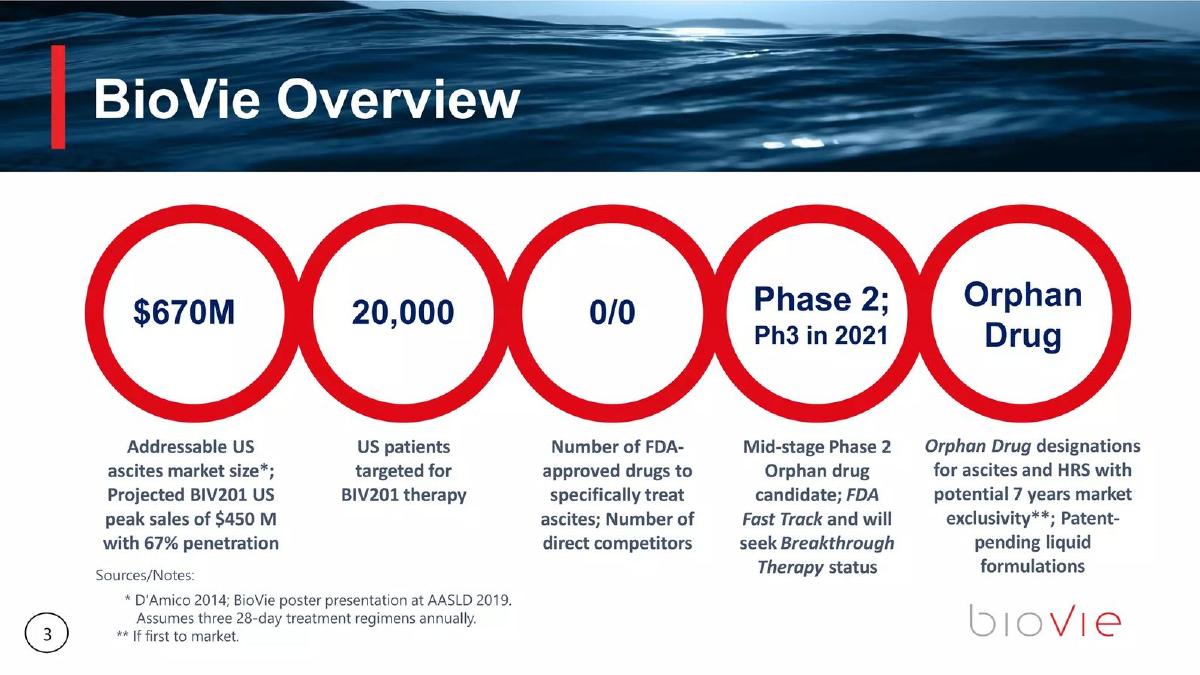
BioVie market slide — slide 3
Phase 2 drug candidate (BIV201) for ascites, US.
BioVie deck, slide 3. Exact stored slide matched to this analysis.
Our analysis: Patients × dosing, with peak sales as a separate, stated share.
Evidence and limitation: It gives a patient count, a dosing assumption and a source, and separates the addressable market from its own projected peak sales. Our calculation: $670M ÷ 20,000 patients ≈ $33,500 per patient per year, or about $11,200 per 28-day regimen at three regimens a year. The slide does not state a price, so that figure is implied, not quoted. $450M is about 67% of $670M, so the two headline numbers are consistent.
What a founder can adapt: "[N] patients × [courses]/year × $[price] = $[X] ([source]). Peak sales $[Y] at [share]%."
Supporting analysis
What the deck claims: "$670M Addressable US ascites market size*; Projected BIV201 US peak sales of $450 M with 67% penetration." "20,000 US patients targeted for BIV201 therapy." "0/0 Number of FDA-approved drugs to specifically treat ascites; Number of direct competitors." Footnote: "D'Amico 2014; BioVie poster presentation at AASLD 2019. Assumes three 28-day treatment regimens annually."
Presentation choice: Investors can rebuild the number and challenge each input.
When it does not fit: Leaving the implied price unstated.
Tissue-based platform for sustained protein therapy.
Medgenics deck, slide 6. Exact stored slide matched to this analysis.
Our analysis: Market of the incumbent therapy plus its cost per patient.
Evidence and limitation: For each product it pairs the annual market of the therapy it would replace with the current cost per patient per year. Our sum: $9.2B + $2.7B + $4.4B = $16.3B, matching the ">$16B" stated on the deck's previous page. It gives no patient counts or sources here, so investors cannot see how many patients sit behind each market.
What a founder can adapt: "[Incumbent] $[X]/yr market; $[cost]/patient/yr; [N] patients ([source])."
Supporting analysis
What the deck claims: "EPODURE (anemia) Sustained EPO therapy ($9.2B/yr market) could replace $15-30,000/yr/patient in injections." "INFRADURE (hepatitis) Sustained IFN-a therapy ($2.7B/yr mkt) could replace $35-85,000/yr/patient for current therapies." "HEMODURE (hemophilia) Sustained FVIII therapy ($4.4B/yr mkt) could replace >$100-250,000/yr/patient injections."
Presentation choice: Cost per patient shows the price room a replacement has.
When it does not fit: Market and price without patient counts.
T-cell therapies targeting oncogenic driver mutations in solid tumours.
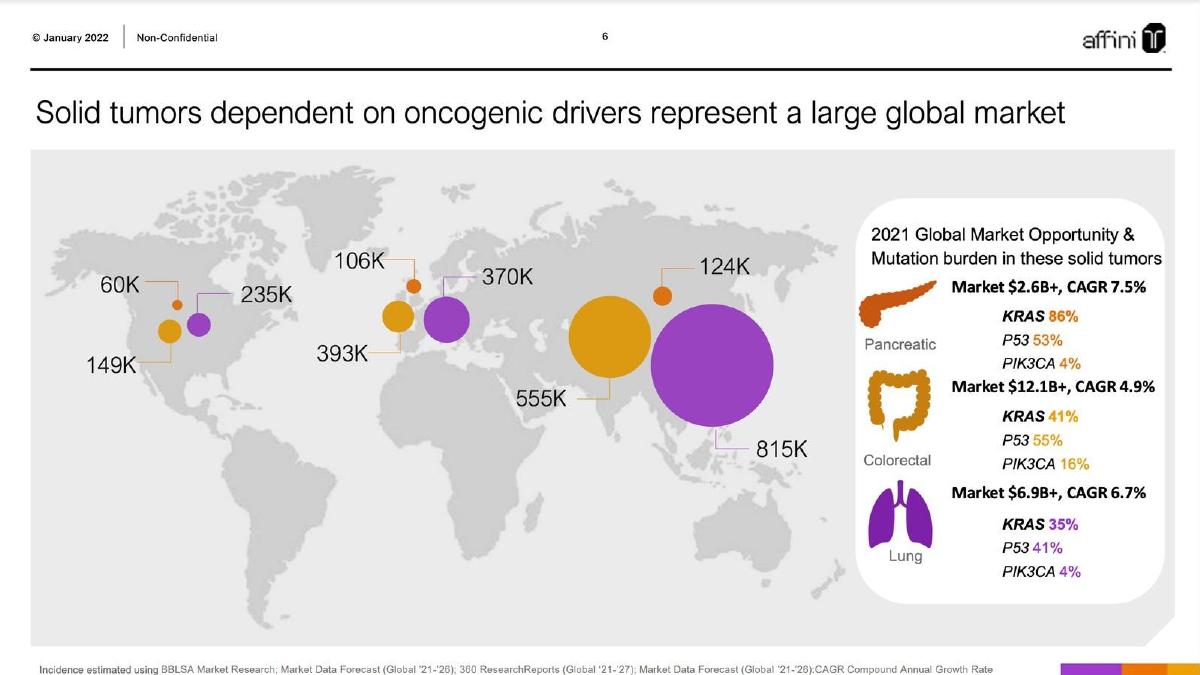
Affini-T Therapeutics deck, slide 6. Exact stored slide matched to this analysis.
Our analysis: Incidence × mutation share, with the multiplication left to the reader.
Evidence and limitation: It combines disease markets, regional incidence and the share of tumours carrying each mutation it targets, which is the step from all patients to the patients its therapy could treat. It stops before multiplying them: the slide does not show the mutation-positive patient count or market. The three markets total about $21.6B (our sum), but they are whole-indication figures, not the share that fits the targeted mutations.
What a founder can adapt: "[Indication]: [N] patients × [mutation]% = [M] eligible × $[price] = $[X]."
Supporting analysis
What the deck claims: "Solid tumors dependent on oncogenic drivers represent a large global market." "2021 Global Market Opportunity & Mutation burden in these solid tumors." Pancreatic "Market $2.6B+, CAGR 7.5%", KRAS 86%, P53 53%, PIK3CA 4%; Colorectal "Market $12.1B+, CAGR 4.9%", KRAS 41%, P53 55%, PIK3CA 16%; Lung "Market $6.9B+, CAGR 6.7%", KRAS 35%, P53 41%, PIK3CA 4%. Map of regional incidence figures from 60K to 815K. Sources footnoted.
Presentation choice: The mutation percentages are the right filter for a targeted therapy.
When it does not fit: Quoting whole-indication markets for a targeted therapy.
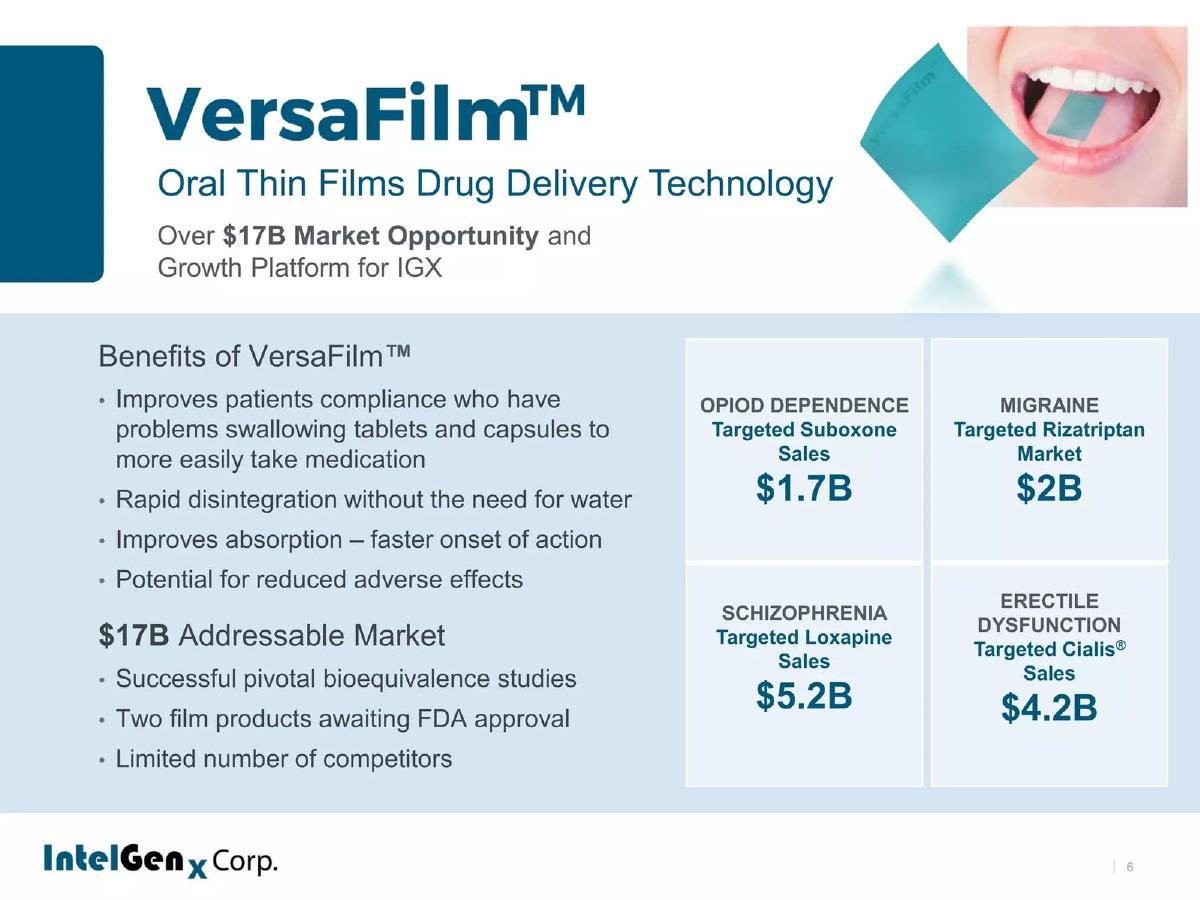
IntelGenx deck, slide 7. Exact stored slide matched to this analysis.
Our analysis: Reference-drug sales per indication; tiles don't reach the headline.
Evidence and limitation: It names the branded drug in each indication whose sales a film version would target. Our sum of the four tiles: $1.7B + $2B + $5.2B + $4.2B = $13.1B, about $3.9B short of the $17B headline. The slide doesn't show where the rest comes from; it may be other programmes, but the slide doesn't say. No sources or years are given.
What a founder can adapt: "[Drug] sales $[X] ([source, year]) × [expected share]% = $[Y]. Total of listed programmes: $[sum]."
Supporting analysis
What the deck claims: "Over $17B Market Opportunity and Growth Platform for IGX." "$17B Addressable Market." Tiles: "Opiod Dependence Targeted Suboxone Sales $1.7B"; "Migraine Targeted Rizatriptan Market $2B"; "Schizophrenia Targeted Loxapine Sales $5.2B"; "Erectile Dysfunction Targeted Cialis Sales $4.2B".
Presentation choice: Naming the reference drug is concrete for a reformulation company.
When it does not fit: A headline the listed figures don't add up to.
Immuno-oncology therapies aimed at checkpoint-inhibitor resistance.
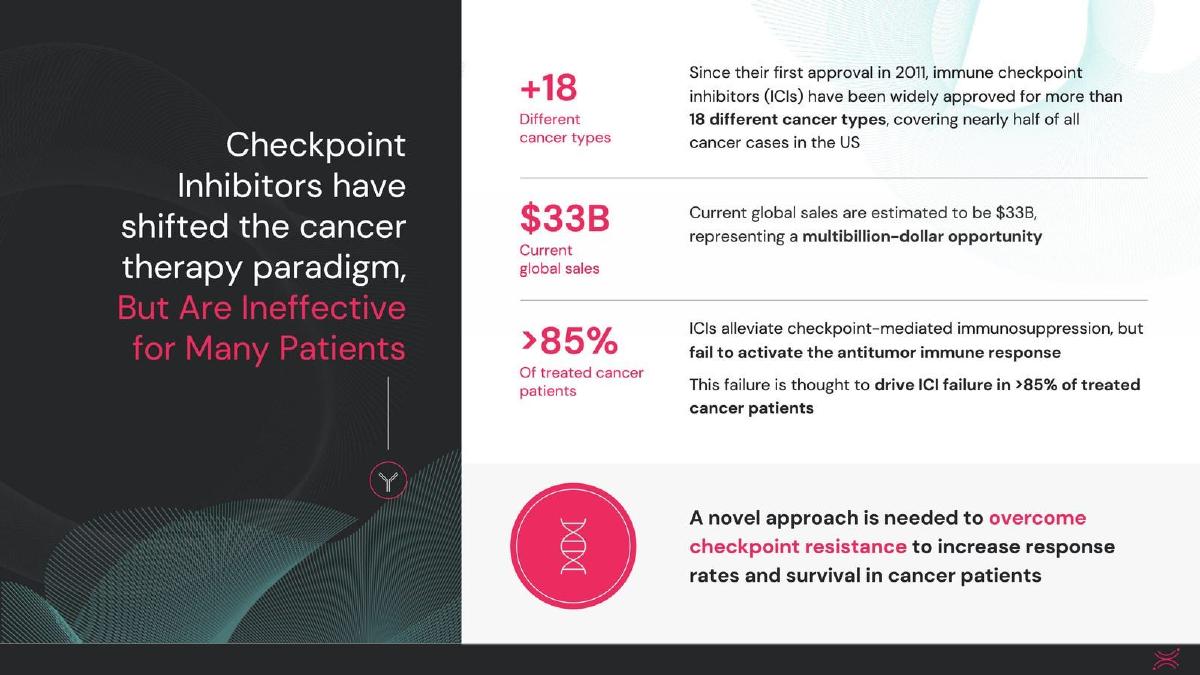
Georgiamune deck, slide 9. Exact stored slide matched to this analysis.
Our analysis: Drug-class sales as context, unmet need as a hypothesis.
Evidence and limitation: It uses current sales of an established drug class to show spend exists, and a failure rate to show unmet need. It does not size its own opportunity: the $33B is what existing drugs already earn, and >85% is presented as a hypothesis ("thought to"), not a patient count. No source is shown.
What a founder can adapt: "[N] patients treated with [class]; [share]% don't respond ([source]) × $[price] = $[X]."
Supporting analysis
What the deck claims: "Checkpoint Inhibitors have shifted the cancer therapy paradigm, But Are Ineffective for Many Patients." "+18 Different cancer types." "$33B Current global sales ... representing a multibillion-dollar opportunity." ">85% Of treated cancer patients": "This failure is thought to drive ICI failure in >85% of treated cancer patients."
Presentation choice: Useful framing on a problem slide; not yet a market size.
When it does not fit: Using incumbent sales as your own market.
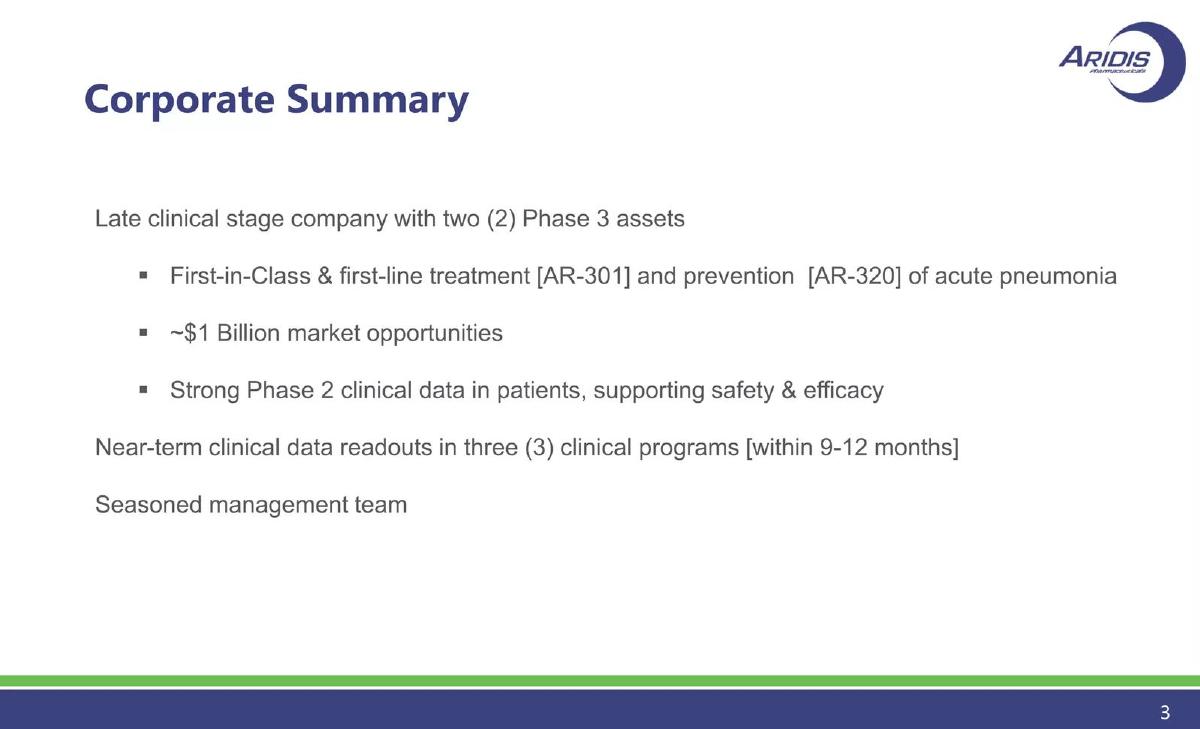
Late clinical-stage antibody treatments for acute pneumonia.
Aridis deck, slide 3. Exact stored slide matched to this analysis.
Our analysis: One unsupported figure.
Evidence and limitation: Weaker example. A single rounded figure, with no patients, price, source or split between the two assets. It is a corporate summary, so the detail may appear later in the deck, but on this slide the figure can't be checked.
What a founder can adapt: "[Asset]: [N] patients × $[price] = $[X]; [asset 2]: $[Y] ([source])."
Supporting analysis
What the deck claims: "Late clinical stage company with two (2) Phase 3 assets." "First-in-Class & first-line treatment [AR-301] and prevention [AR-320] of acute pneumonia." "~$1 Billion market opportunities."
Presentation choice: Investors can't tell whether $1B is per asset or combined.
When it does not fit: An unexplained round number.
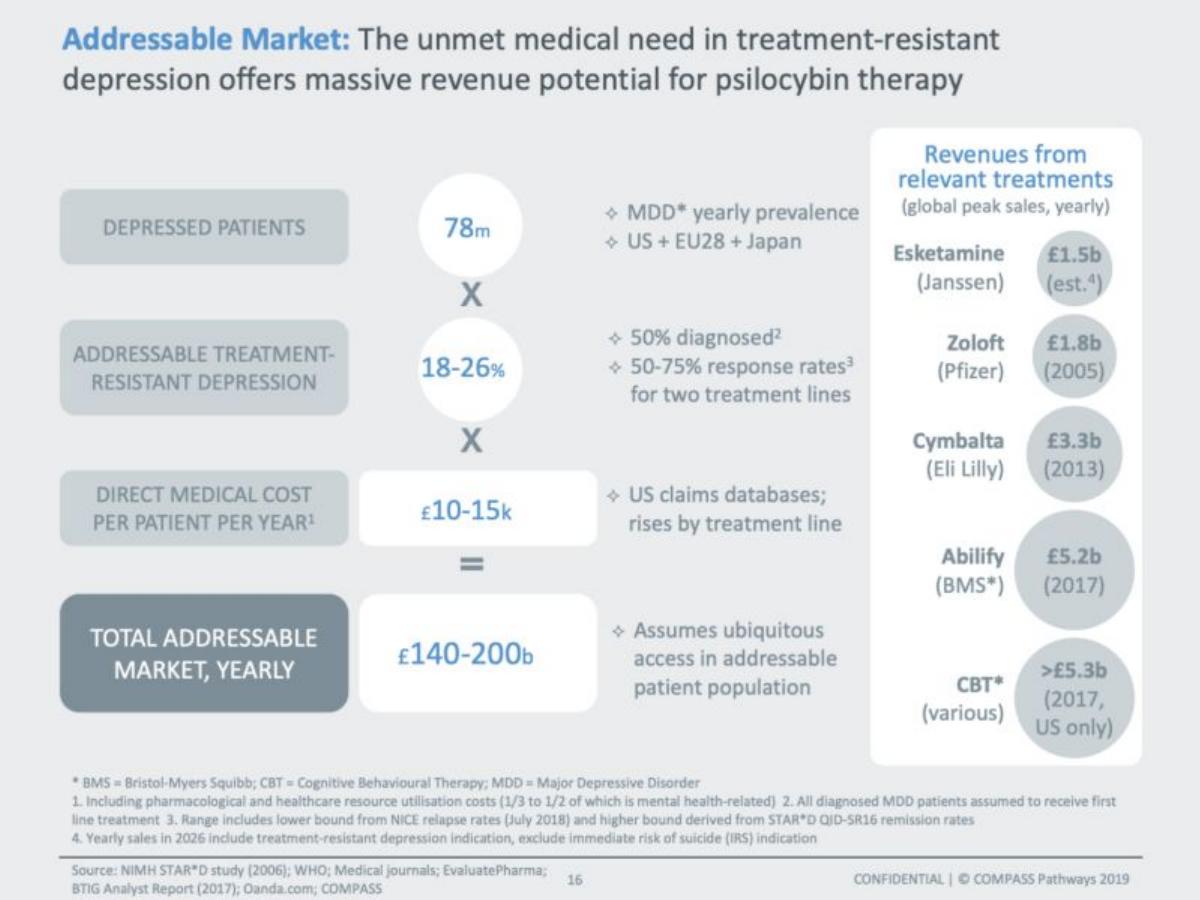
Psilocybin therapy for treatment-resistant depression (TRD). Deck cover dated January 2018, slide footer 2019; the company listed on Nasdaq in September 2020, after this deck.
Compass Pathways deck, slide 17. Exact stored slide matched to this analysis.
Our analysis: Patients × eligible share × annual cost, with reference-drug sales as a reality check.
Evidence and limitation: Every step is visible and footnoted. Our calculation: 78m × 18% × £10k ≈ £140b, matching the low end, but 78m × 26% × £15k ≈ £304b, so the stated £200b top end doesn't follow from its own inputs. The cost figure is total medical spend per patient, not a price for the therapy, and the reference sales are listed separately rather than used as the market.
What a founder can adapt: Recompute your range from your own inputs, and add the price you expect to charge, not only total medical cost.
Supporting analysis
What the deck claims: "Addressable Market: The unmet medical need in treatment-resistant depression offers massive revenue potential for psilocybin therapy." Depressed patients 78m (MDD yearly prevalence, US + EU28 + Japan) × addressable TRD 18-26% (50% diagnosed; 50-75% response rates for two treatment lines) × direct medical cost per patient per year £10-15k (US claims databases) = total addressable market, yearly, £140-200b ("assumes ubiquitous access"). Beside it, global peak yearly sales of reference treatments: Esketamine £1.5b (est.), Zoloft £1.8b, Cymbalta £3.3b, Abilify £5.2b, CBT more than £5.3b (US only). Sources: NIMH STAR*D, WHO, medical journals, EvaluatePharma, BTIG analyst report (2017).
Presentation choice: Investors can rebuild the number and compare it with what the best-selling depression drugs actually earn.
When it does not fit: A range whose top end doesn't match the inputs shown.
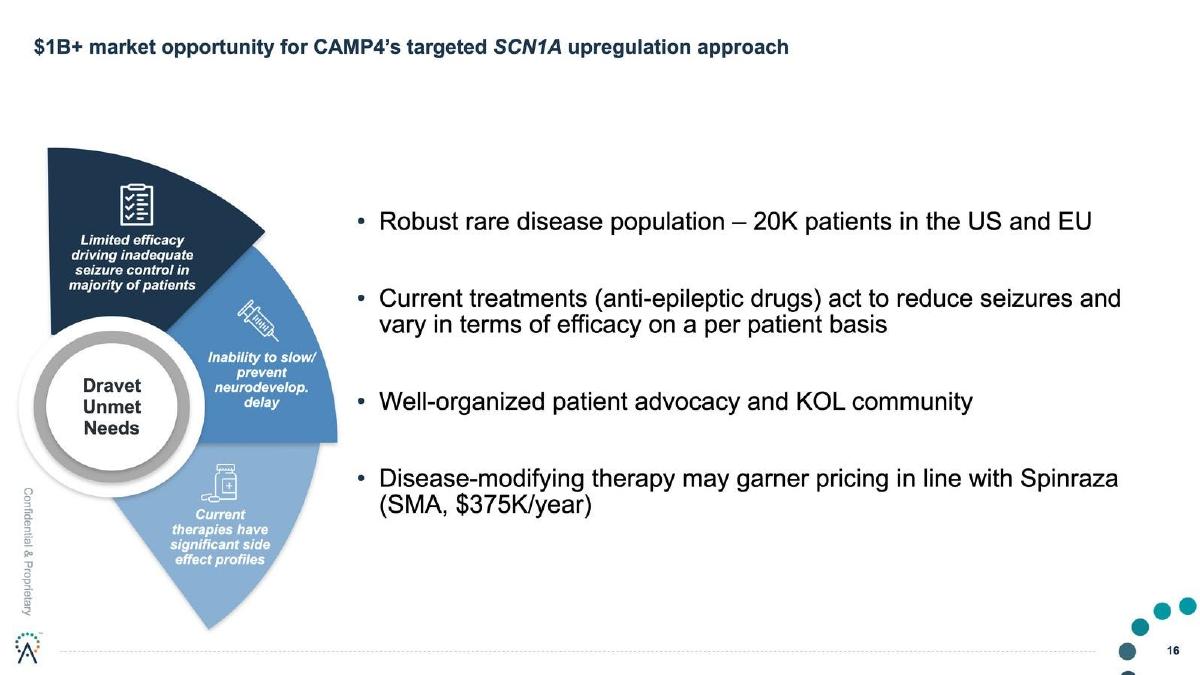
RNA-based therapies for genetic diseases; this slide covers Dravet syndrome. From the Series B deck published by Business Insider in July 2022; private then (Nasdaq listing October 2024).
CAMP4 Therapeutics deck, slide 16. Exact stored slide matched to this analysis.
Our analysis: Rare-disease sizing from patient count × a comparable drug's price.
Evidence and limitation: Patient count and a named price analogue are both shown. Our calculation: 20,000 × $375,000 ≈ $7.5B a year if every patient were treated at Spinraza pricing, so "$1B+" implies reaching roughly 13% of patients, a share the slide never states. No source is given for the patient count.
What a founder can adapt: Show the share you assume: "[N] patients × $[price] × [share]% = $[X]."
Supporting analysis
What the deck claims: "$1B+ market opportunity for CAMP4's targeted SCN1A upregulation approach." "Robust rare disease population – 20K patients in the US and EU." "Current treatments (anti-epileptic drugs) act to reduce seizures and vary in terms of efficacy on a per patient basis." "Well-organized patient advocacy and KOL community." "Disease-modifying therapy may garner pricing in line with Spinraza (SMA, $375K/year)." Wheel of unmet needs: limited efficacy, inability to slow neurodevelopmental delay, side effects.
Presentation choice: For a rare disease, a small patient count plus a sourced price analogue is more convincing than a large disease total.
When it does not fit: Leaving investors to work out which share produces the headline.
What improved: Our illustrative rewrite of Aridis's summary line; bracketed text is a placeholder, not company fact.
What's different about biotech market sizing
A therapy's revenue depends on how many patients are diagnosed and treated, the price per course or per year, and how long the drug stays protected. Disease-market reports and current drug-class sales describe spending that already exists; they don't show how a product still in trials would take a share of it. Pair market sizing with the development stage shown on your pipeline slide.
What investors check
Which population is counted (incidence, prevalence, or treated patients) and in which geography. Whether the price or number of courses per year is stated. Whether the headline is the whole market or projected sales of this drug. Whether the listed figures add up to the headline and have sources and dates.
How we read each slide
We quote the text on the slide images and mark our own arithmetic as ours. We have not checked any market figure, price or source. Page numbers are pages in the original deck file. Four images were already stored and were checked against the decks; two were rendered from the deck PDFs.
Common mistakes
Incumbent sales as your market. State the share you could replace.
No patient count. Show who is treated.
Hidden price. State the cost per year or course.
Tiles that don't add up. Reconcile to the headline.
Diagnostic checklist
Patient population defined.
Eligible share shown.
Price or dosing stated.
Peak share separate from market.
Sources cited.
Frequently asked questions
How should a biotech startup size its market?
Patients × annual treatment cost, with the source and dosing assumption, then projected peak sales as a separate share. BioVie shows 20,000 patients, a $670M market and $450M peak sales at 67%.
Can I use sales of existing drugs as my market size?
As context. Georgiamune's $33B checkpoint-inhibitor sales show spend exists, but investors will ask how many of those patients your drug could treat and at what price.
How we chose these examples
Corpus: published pitch deck teardowns on StartupFundraising.com. Founder-uploaded private decks are excluded.
Selection (2026-09-26): we searched teardown slide text for market-size wording together with patient, drug, phase or FDA terms, reviewed seven candidate slides from the deck files, and kept six.
Excluded: FyodorBio (a diagnostics market, not a therapy). Medgenics's ">$16B" total is on page 5 of its deck; we show page 6, where the per-product figures appear.
Page numbers are pages in the original deck files; IntelGenx's slide is page 7 of the file but printed as 6. BioVie, Medgenics, Affini-T and Aridis images were already stored and were checked pixel-for-pixel against fresh renders; Georgiamune and IntelGenx were rendered from the deck PDFs.
Market figures, prices and sources are quoted from the slides and not independently verified. Calculations (per-patient cost, sums) are ours and marked as such.
Update (2026-10-01): added Compass Pathways p17 (2018/2019 deck, 2020 IPO) and CAMP4 p16 (2022 Series B deck, 2024 IPO), each checked against the original deck page image (AI editorial model review, not human). Rejected: HMNC p9 (pipeline slide), Fluence p9 (training platform, not a therapy).
Review: slide images were checked on 2026-09-26 and matched to company, deck and page (editorial model review). No person has yet completed an editorial review of this page. We make no claim that any slide caused a fundraising outcome.