How healthcare startups size their market from patients, prevalence and spending, and where patient counts stop being customers.
Healthcare Market Slide: From Patient Counts to a Market
Healthcare market slides usually start from people: how many have a condition, how many are diagnosed, how many could use the product. A patient count is not a market until it is narrowed to the patients you can reach and multiplied by what someone will pay per patient. This guide compares eight real healthcare market slides on that step: does the slide get from patients or spending to a market the company can sell into, with a source?
TL;DR
Start from a sourced patient count, narrow it to the patients you can reach (diagnosed, eligible, in markets where you can be paid), and multiply by an annual amount per patient. Wandercraft comes closest on the narrowing: 30 million wheelchair users down to 2 million eligible patients in countries with reimbursement, sourced to a consultancy, though it doesn't show how 2 million becomes €50 billion. Strive Health sizes kidney care from spending per patient by disease stage ($213 billion diagnosed plus $199 billion undiagnosed, $412 billion total). Wrykr shows its revenue arithmetic, but the figures on the slide don't produce its £3 million a month. Invitae, Siren Care and Mowoot give prevalence without a price. SimplifiMed and Curve Health give a single number with no basis.
Healthcare market slides from real pitch decks
Each example shows the slide above its analysis and links to the full teardown. Slides that narrow patients to a reachable market with a source come first. Claims are as shown on the slides; checks and comments are ours.
Wandercraft market slide — slide 5
Self-balancing exoskeleton for people who cannot walk.
Wandercraft deck, slide 5. Exact stored slide matched to this analysis.
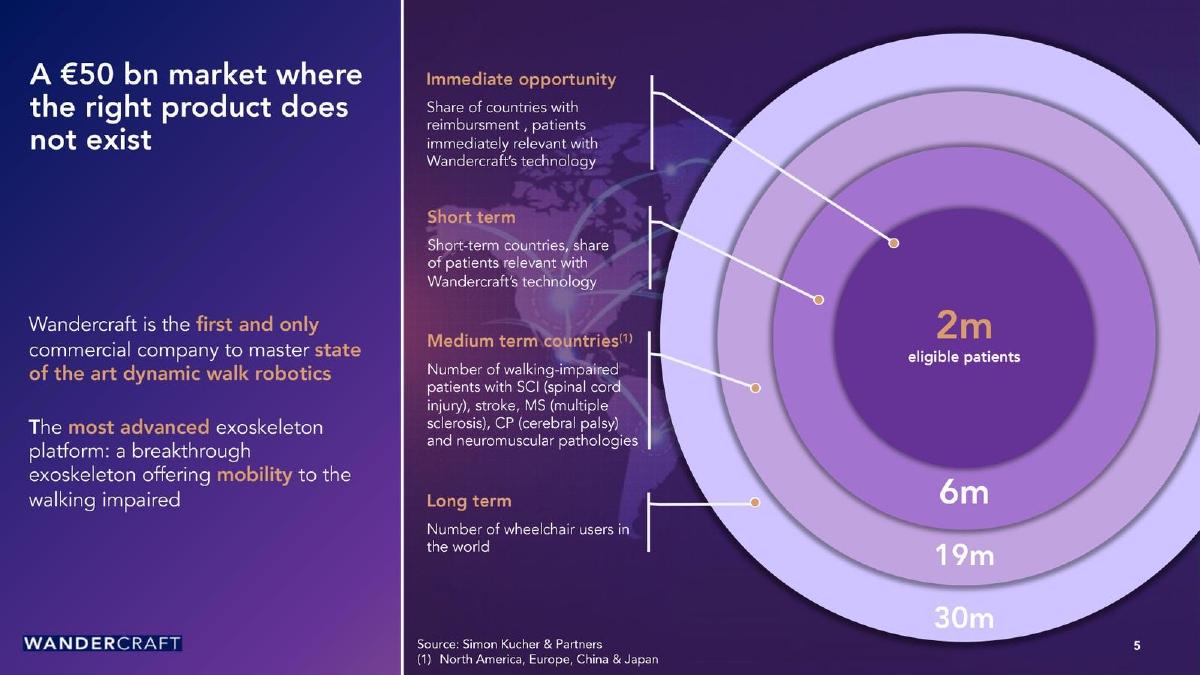
Our analysis: A narrowing from all wheelchair users to patients the company can be paid for today.
Evidence and limitation: Each ring is defined, and the inner ring is limited to countries with reimbursement, which is the step most healthcare slides skip. The slide doesn't say which ring the €50 billion applies to or what amount per patient produces it. If it applies to the 2 million eligible patients, it implies €25,000 each; if to 19 million, about €2,600. The slide doesn't say, and doesn't give the year of the source figures.
What a founder can adapt: Add the price step: "2 million eligible patients × €[X] per [device or year] = €[Y] billion (Simon Kucher, [year])".
Supporting analysis
What the deck claims: "A €50 bn market where the right product does not exist." Rings: long term, "Number of wheelchair users in the world" (30m); medium term countries, "Number of walking-impaired patients with SCI (spinal cord injury), stroke, MS (multiple sclerosis), CP (cerebral palsy) and neuromuscular pathologies" (19m); short term, "Short-term countries, share of patients relevant with Wandercraft's technology" (6m); immediate opportunity, "Share of countries with reimbursment, patients immediately relevant with Wandercraft's technology" (2m eligible patients). "Source: Simon Kucher & Partners"; medium-term countries are "North America, Europe, China & Japan".
Presentation choice: It separates the long-term population from the patients reachable now, with a named source.
When it does not fit: A headline figure with no stated link to any ring.
Value-based kidney care provider. The slide's printed page number is 6; it is page 7 of the deck file.
Strive Health deck, slide 7. Exact stored slide matched to this analysis.
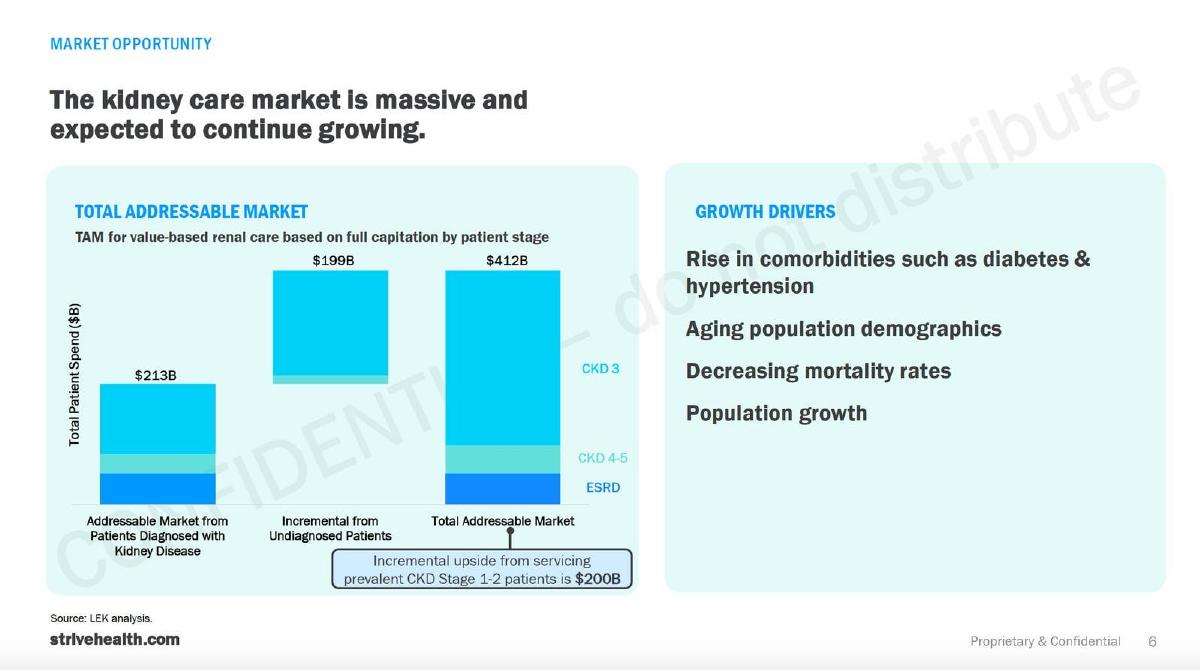
Our analysis: Market = patients × spending per patient, by disease stage, for a company paid per patient.
Evidence and limitation: $213 billion + $199 billion = $412 billion, so the bars add up. The basis is stated: total spending on these patients, because under full capitation a provider is paid a fixed amount per patient to cover all of their care. That makes spending a reasonable proxy for this model; it would not be for a product that captures a fee. The $200 billion for earlier-stage patients is kept outside the total, which is a useful distinction. Almost half the total comes from patients not yet diagnosed, who first have to be found. No year is given.
What a founder can adapt: Add the year, and a figure for patients in markets where you have contracts: "[N] patients in [regions] under contract, $[X] per patient per year".
Supporting analysis
What the deck claims: "The kidney care market is massive and expected to continue growing." "Total addressable market: TAM for value-based renal care based on full capitation by patient stage" (total patient spend, $B): "Addressable Market from Patients Diagnosed with Kidney Disease" $213B; "Incremental from Undiagnosed Patients" $199B; "Total Addressable Market" $412B, split by CKD 3, CKD 4–5 and ESRD. "Incremental upside from servicing prevalent CKD Stage 1–2 patients is $200B." Growth drivers: comorbidities, ageing, decreasing mortality, population growth. "Source: LEK analysis."
Presentation choice: The basis of the figure matches how the company is paid, and upside is kept apart from the headline.
When it does not fit: Using total spending as the market when you are paid a fee, not a capitated amount.
Staffing and payment app for NHS nurses in England.
Wrykr deck, slide 9. Exact stored slide matched to this analysis.
Our analysis: A buyer-based market (trusts, hospitals, agency hours) with a revenue example.
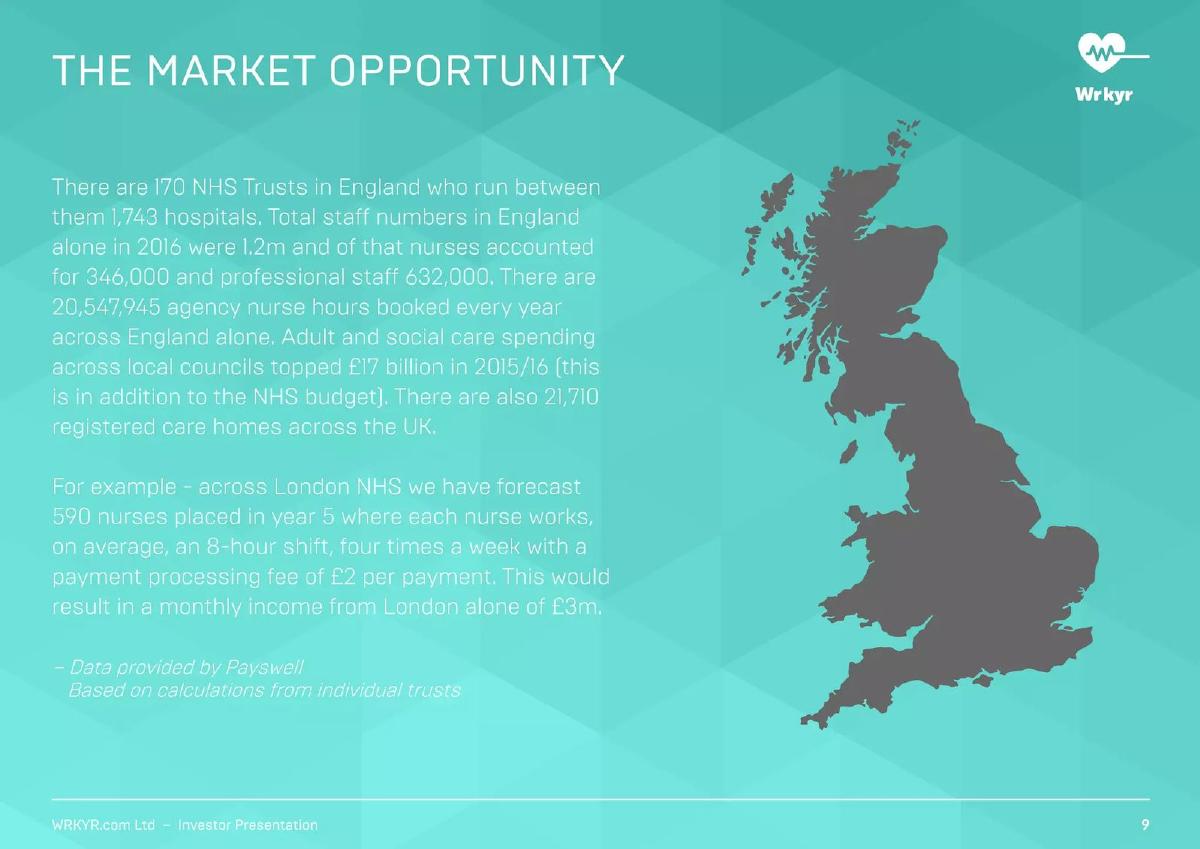
Evidence and limitation: The buyer counts are specific and dated. The worked example doesn't add up as written: 590 nurses × 4 shifts a week × about 4.3 weeks is roughly 10,200 shifts a month; at £2 per payment that is about £20,000 a month, not £3 million. The slide doesn't say what else is counted, for example whether £3 million is the value of payments processed rather than Wrykr's income.
What a founder can adapt: "590 nurses × [N] payments a month × £2 = £[X] a month in fees; payments processed £[Y] a month".
Supporting analysis
What the deck claims: "There are 170 NHS Trusts in England who run between them 1,743 hospitals. Total staff numbers in England alone in 2016 were 1.2m and of that nurses accounted for 346,000 and professional staff 632,000. There are 20,547,945 agency nurse hours booked every year across England alone. Adult and social care spending across local councils topped £17 billion in 2015/16… There are also 21,710 registered care homes across the UK." "For example – across London NHS we have forecast 590 nurses placed in year 5 where each nurse works, on average, an 8-hour shift, four times a week with a payment processing fee of £2 per payment. This would result in a monthly income from London alone of £3m." "Data provided by Payswell. Based on calculations from individual trusts."
Presentation choice: It counts buyers and hours, the units a staffing product sells into, and shows its working, which is how the gap can be spotted.
When it does not fit: A worked example whose inputs don't produce the stated total.
Invitae deck, slide 4. Exact stored slide matched to this analysis.
Our analysis: A reframing of rare conditions as common in total, to support a broad testing menu.
Evidence and limitation: Each figure is a prevalence, defined in a line of text. The percentages use different bases (share of cancers, of people, of births), so they can't be added. No sources on the slide. The two ~100% categories show why prevalence alone isn't a market: everyone carries such mutations, but few are tested or reimbursed.
What a founder can adapt: Follow with the priced step: "[N] tests a year in [indication] × $[price] reimbursed".
Supporting analysis
What the deck claims: "Genetic conditions affect everyone. 'Rare' genetic conditions are actually common in the aggregate." Hereditary cancer ~5–10% ("1 in 20 to 1 in 10 of all cancers are likely to have a hereditary basis"); cardiology 0.4%; hematology ~0.5–5%; neurology 0.3%; pediatric genetics ~2%; preventive ~2–5%; carrier ~100%; pharmacogenetics ~100%.
Presentation choice: Every percentage is explained in words, which makes clear what it counts.
When it does not fit: Letting ~100% prevalence stand in for demand.
Temperature-sensing socks for people with diabetes.
Siren Care deck, slide 5. Exact stored slide matched to this analysis.
Our analysis: A prevalence slide that names the sub-group the product serves.
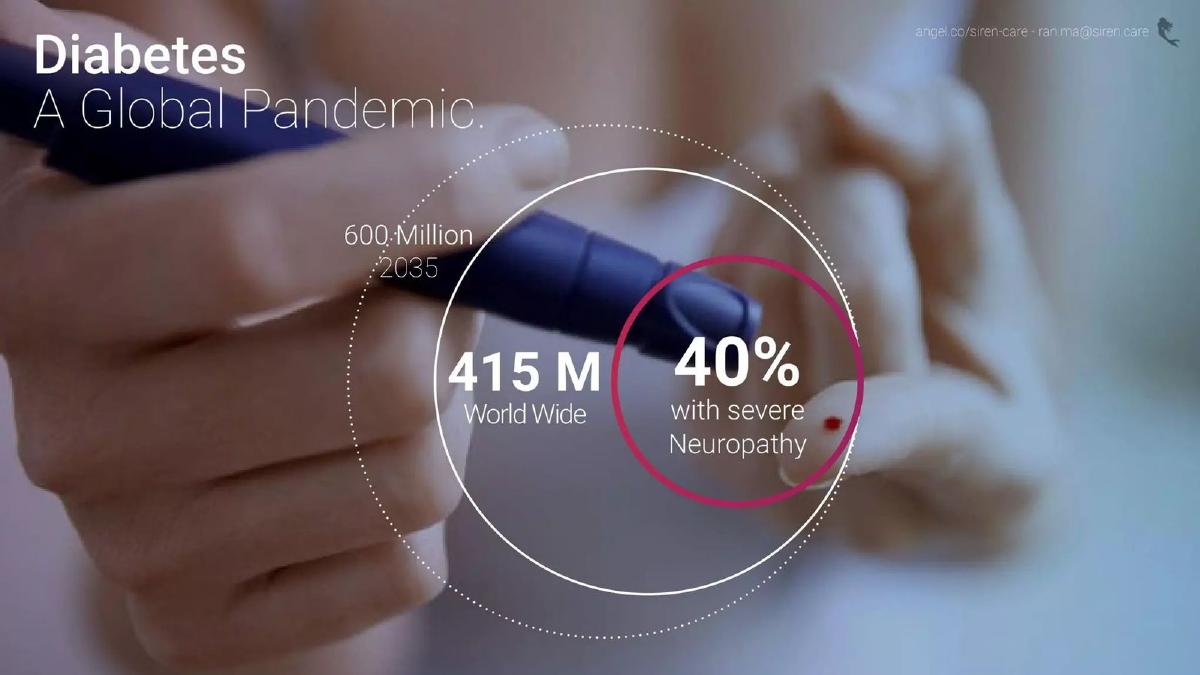
Evidence and limitation: Three figures with no source or year for the current count. "40% with severe neuropathy" is the step toward the product's users but is not sourced, and the slide doesn't apply it: 40% of 415 million would be about 166 million people. No price or region.
What a founder can adapt: "[N] people with diabetic neuropathy in [country] ([source, year]) × [X]% with insurance cover for the product × $[price] a year".
Supporting analysis
What the deck claims: "Diabetes – A Global Pandemic." "415 M World Wide"; "600 Million 2035"; "40% with severe Neuropathy".
Presentation choice: It identifies the relevant sub-population, the first narrowing step.
When it does not fit: Global prevalence for a product launching in one country.
Abdominal massage device for chronic constipation. Included as a weaker example.
Mowoot deck, slide 4. Exact stored slide matched to this analysis.
Our analysis: A problem-scale slide rather than a market size.
Evidence and limitation: Two prevalence rates with no source, region or patient count. The 80% group is the more specific target, but the slide doesn't say how many neurogenic disease patients there are.
What a founder can adapt: "80% of [N] neurogenic patients in [region] ([source]) = [M] patients".
Supporting analysis
What the deck claims: "Who suffers from constipation?" "80% of Neurogenic Disease Patients"; "15% of General Population".
Presentation choice: Included to show prevalence given as a percentage with nothing to multiply it by.
Patient communication software for clinics. Included as a weaker example.
SimplifiMed deck, slide 3. Exact stored slide matched to this analysis.
Our analysis: A scale statement.
Evidence and limitation: One number, with no source, country, year or definition of chronic. The product is sold to clinics, so the count of clinics and what each would pay would be the more relevant market.
What a founder can adapt: "[N] clinics in [segment] × $[X] per clinic per month".
Supporting analysis
What the deck claims: "133 M Chronic patients."
Presentation choice: Included to show a patient count for a product whose buyer is a provider.
When it does not fit: Counting patients when clinics pay.
Virtual care for assisted living and skilled nursing facilities. Included as a weaker example.
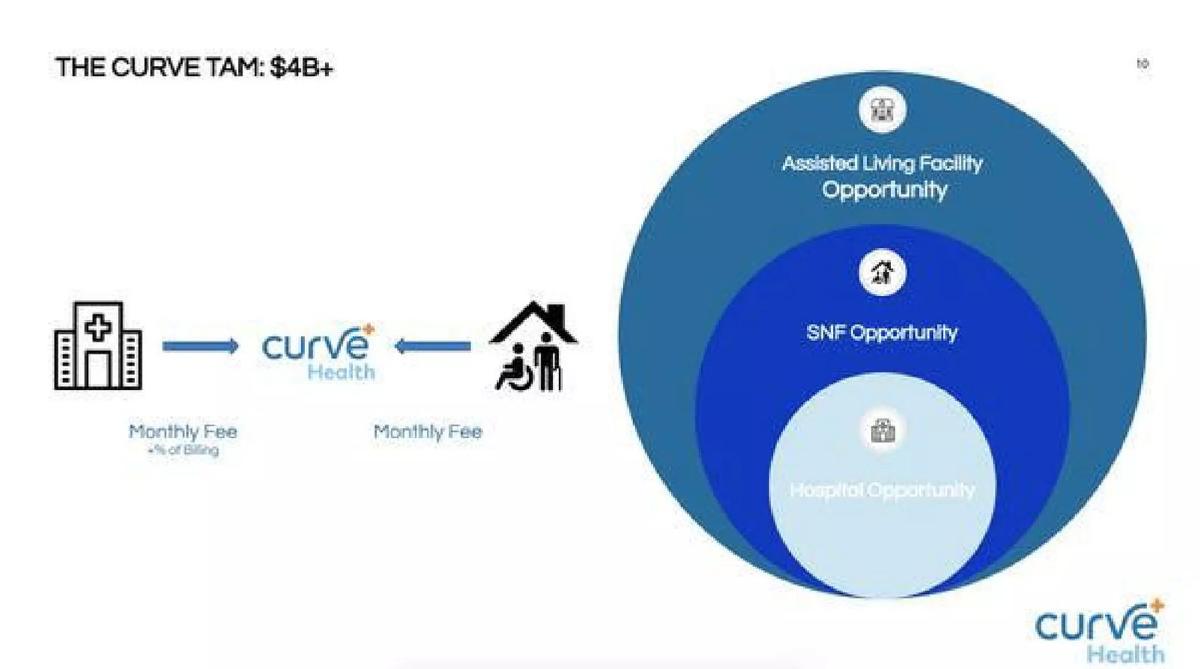
Curve Health deck, slide 10. Exact stored slide matched to this analysis.
Our analysis: A buyer-based market that names the buyers and fee types, without the numbers.
Evidence and limitation: The rings have no figures, so the $4 billion can't be traced to facility counts or fees. The payment flow is useful: two payers, a monthly fee from each and a share of billing from hospitals, but no rates.
What a founder can adapt: "[N] skilled nursing facilities × $[X] a month + [M] hospitals × ($[Y] a month + [Z]% of billing) = $[total]".
Supporting analysis
What the deck claims: "The Curve TAM: $4B+." Diagram: hospital → Curve Health ("Monthly Fee + % of Billing") ← facility ("Monthly Fee"). Rings: "Assisted Living Facility Opportunity", "SNF Opportunity", "Hospital Opportunity".
Presentation choice: Included to show a buyer-based structure that stops short of the arithmetic.
When it does not fit: Unlabelled rings under a headline figure.
Whether each slide gives a sourced starting count, narrows it, and applies an amount per patient or buyer.
Example
Starting point
Narrowed
Amount per unit
Source
Wandercraft
Wheelchair users
Yes, to 2m reimbursable
Not shown
Simon Kucher
Strive Health
Kidney patients by stage
By diagnosis and stage
Spending per patient (implied)
LEK
Wrykr
Trusts, hospitals, agency hours
London example
£2 per payment
Payswell, trusts
Invitae
Prevalence by field
No
No
None on slide
Siren Care
People with diabetes
Named, not applied
No
None on slide
Mowoot
Prevalence rates
No
No
None on slide
SimplifiMed
Chronic patients
No
No
None on slide
Curve Health
Facility types
No figures
Fee types only
None on slide
Key Takeaways
Source the patient count and give the year and region.
Narrow it: diagnosed, eligible for your product, in markets where someone pays.
Multiply by an annual amount per patient, and say who pays it.
Separate total healthcare spending from what your product can capture.
Show each step so the headline can be recomputed.
Build your healthcare market slide
Work from people to money in steps.
Start. How many patients (or buyers), where, in what year, from what source?
Narrow. How many are diagnosed, eligible and in markets where someone pays?
Price. What is paid per patient or buyer per year, and by whom?
Result. Multiply, and say what the figure is: spending, or what you can capture.
Copyable framework: [N] patients with [condition] in [region] ([source, year]) → [M] diagnosed and eligible where [payer] covers it → × $[X] per patient per year = $[Y].
Illustrative example 1 — written by us
Before: 133M chronic patients.
After: [N] clinics in [segment] in the US ([source, year]) × $[X] per clinic per month = $[Y] a year.
What improved: Our illustrative rewrite; bracketed figures are placeholders, not company facts. It counts the buyer and applies a price.
What this guide adds
The TAM, SAM and SOM and bottom-up guides cover market sizing across sectors. The healthcare reimbursement guide covers who pays. This guide covers the step specific to healthcare market slides: turning prevalence and patient counts into a market, and not presenting all spending on a disease as the company's opportunity.
Three kinds of starting number
Prevalence: the share or number of people with a condition. Useful context, but it is not a market until narrowed and priced.
Patient spending: what is spent on a condition in total. A value-based care company may be paid a share of it; most products capture far less.
Buyers: hospitals, trusts or care homes, multiplied by what each would pay. Often the clearest basis for products sold to providers.
How we read each slide
We quote the text on the slide images and redid any arithmetic shown. We have not checked prevalence or spending figures against their sources. None of these pages was in our stored image set, so we rendered each from the original deck file in our library; the pages shown are the ones quoted.
Common mistakes
Prevalence as market. Narrow to reachable, paid-for patients and apply a price.
Headline with no link. Show which count the headline figure comes from.
Spending as capture. Total spending is your market only if you're paid for all of it.
Wrong unit. Count clinics or hospitals when they are the buyer.
No source or year. Cite each count and date it.
Worked example that doesn't add up. Recompute the example from the inputs shown.
Diagnostic checklist
Starting count is sourced, dated and regional.
Narrowed to patients you can reach and be paid for.
Amount per patient or buyer is stated, with the payer.
Headline can be recomputed from the steps.
Upside is kept apart from the headline.
Frequently asked questions
How do I size a healthcare market in a pitch deck?
Start from a sourced count of patients or buyers, narrow it to those you can reach and be paid for, and multiply by an annual amount per unit. Wandercraft narrows 30 million wheelchair users to 2 million eligible patients in reimbursing countries.
Can I use total disease spending as my market?
Only if your model is paid for that spending, as with full capitation. Strive Health sizes kidney care from total spending per patient because it takes on patients' full cost of care.
How we chose these examples
Corpus: published pitch deck teardowns on StartupFundraising.com. Founder-uploaded private decks are excluded.
Selection (2026-09-26): we searched healthcare teardowns for TAM, market size, addressable market and SAM near patient, prevalence, hospital and clinic terms. We rendered 20 pages from 12 decks, including neighbouring pages where page numbering differed, and read each.
Kept eight. Excluded: Synthium p6 (national Medicare spending, not a market for the product) and p4–5 (value proposition and timeline), Aevus p4–6 (solution, team and advisors; this deck is already used in two guides), Medifies p7–8 (product and traction, not market), CareerApp p9 (not healthcare).
None of the chosen pages was in our stored image set; we rendered them from the original deck PDFs in our library and stored them with the existing slide-image workflow. All eight decks were confirmed as published teardowns on 2026-09-26.
Review: slide images were checked on 2026-09-26 and matched to company, deck and page (editorial model review). No person has yet completed an editorial review of this page. We make no claim that any slide caused a fundraising outcome.