How Healthcare Pitch Decks Explain Reimbursement: Real
How healthcare startups show who pays in their pitch decks: billing codes, payer savings and taking risk.
How Healthcare Pitch Decks Explain Reimbursement
Eight stored slides from ten healthcare decks show how founders explain who pays: billing under an existing Medicare code, selling measured savings to health plans, or carrying the cost of care themselves.
TL;DR
In a healthcare pitch deck, the reimbursement slide answers the question investors ask first: who pays, through what mechanism, and how certain is that payment? Strong decks name the payer (Medicare, a health plan, an employer or the patient), the mechanism (an existing billing code, a contract based on savings, or the company taking on financial risk itself) and the evidence that the money will actually arrive.
The healthcare decks in our corpus use three broad approaches. Some bill for services under codes that already exist. Some sell measurable savings to health plans and employers. Some become, or partner with, the payer and take on the cost of care. Each approach carries a different kind of risk, and the best decks say which risk they carry and how they reduce it.
Reimbursement slides from real healthcare decks
Each example shows the exact stored slide above its analysis and links to the full teardown. Figures are the companies' own claims on their slides; we have not independently verified them. Two slides (Tomorrow Health slide 7, Troy Medicare slide 10) are not in the stored image set, so those examples stay text-only with no substitute image.
100Plus business model slide — slide 4
Remote patient monitoring for seniors.
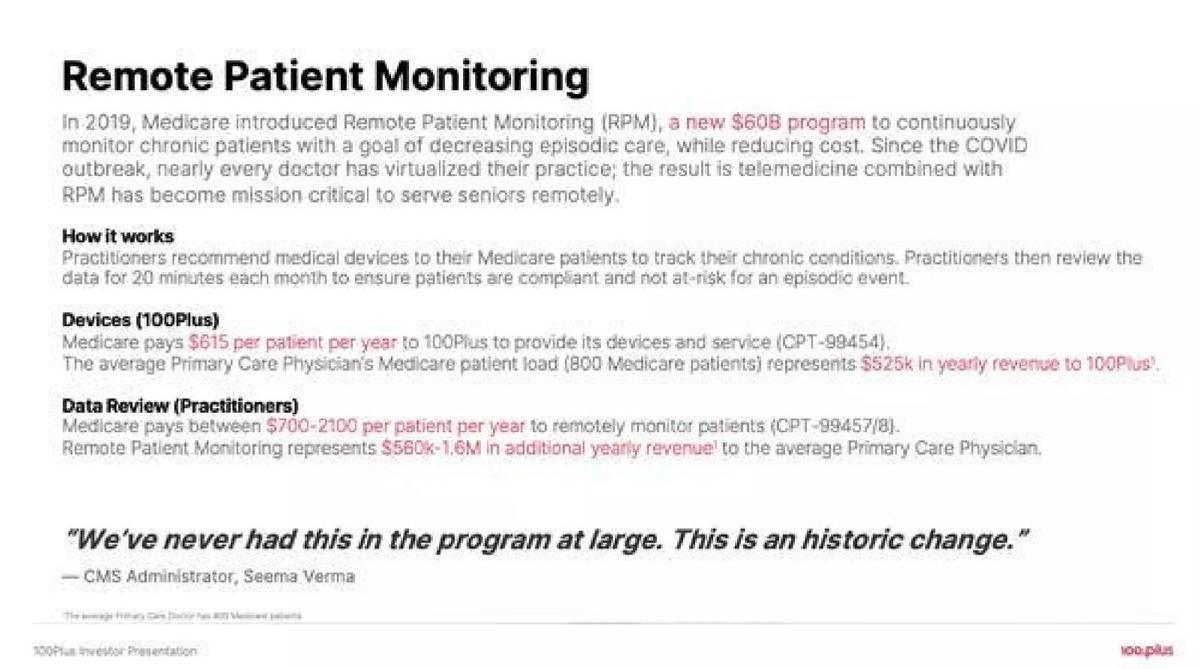
100Plus deck, slide 4. Exact stored slide matched to this analysis.
Our analysis: Anchors the business model to a specific, datable payment change and explains the clinical workflow that generates billable services.
Evidence and limitation: Cite the rule or code directly; investors will check it, and a vague reference to "new Medicare programmes" invites doubt.
What a founder can adapt: Name the payment change and year your model relies on, and show the clinician's step that triggers payment.
Supporting analysis
What the deck claims: Explains that Medicare introduced remote patient monitoring in 2019 to monitor chronic patients continuously, notes that telemedicine combined with monitoring became mission-critical during COVID, and describes how practitioners recommend devices to Medicare patients. The slide states Medicare pays $615 per patient per year for devices (CPT-99454) and $700–2,100 for practitioner review (CPT-99457/8), and quotes the then CMS Administrator.
Presentation choice: Anchors the business model to a specific, datable payment change and explains the clinical workflow that generates billable services.
When it does not fit: Cite the rule or code directly; investors will check it, and a vague reference to "new Medicare programmes" invites doubt.
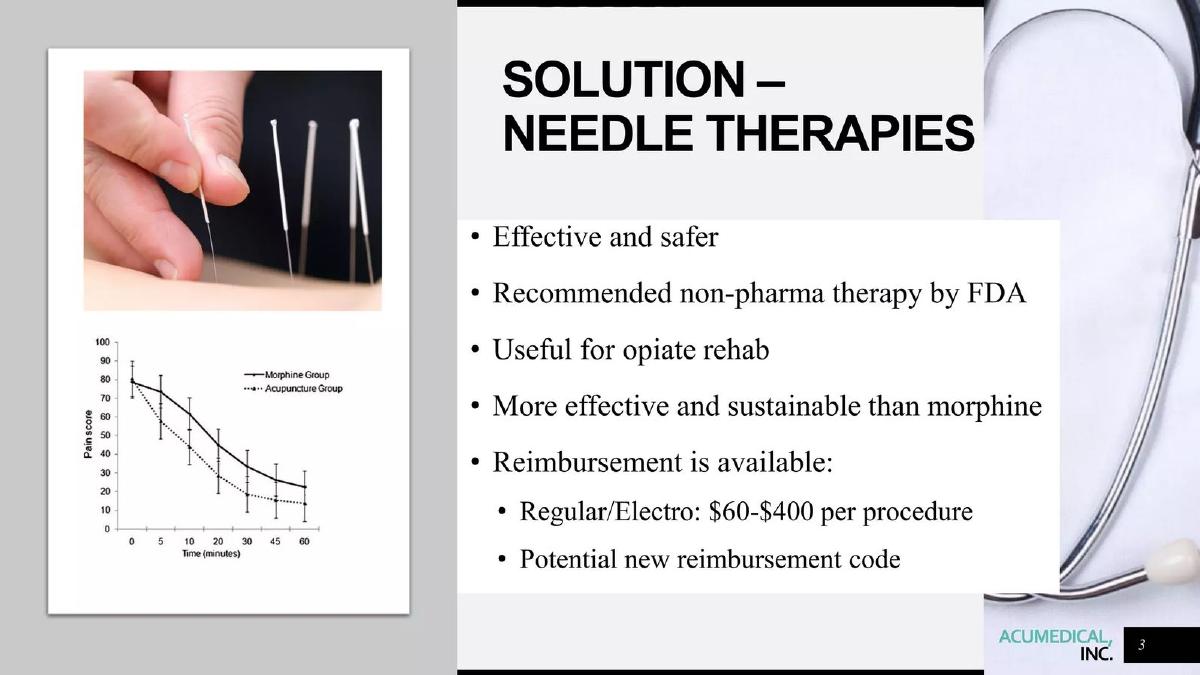
AcuMedical deck, slide 3. Exact stored slide matched to this analysis.
Our analysis: Separates reimbursement that exists today from reimbursement the company hopes for.
Evidence and limitation: A wide price range needs context: which payer, which procedure, which setting.
What a founder can adapt: Keep existing and hoped-for payment in separate lines, with the source for each.
Supporting analysis
What the deck claims: States that reimbursement is available with a per-procedure range of $60–$400, and separately lists a potential new reimbursement code.
Presentation choice: Separates reimbursement that exists today from reimbursement the company hopes for.
When it does not fit: A wide price range needs context: which payer, which procedure, which setting.
In-home care using EMS professionals, sold to payers and providers.
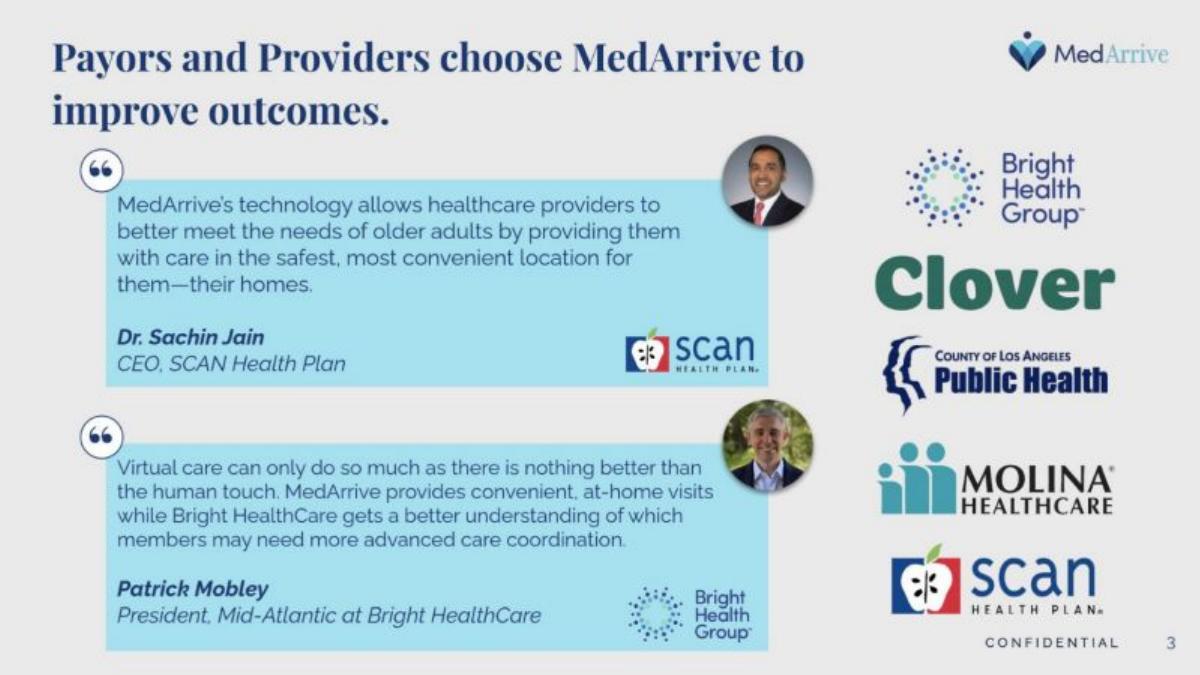
MedArrive deck, slide 3. Exact stored slide matched to this analysis.
Our analysis: Named payers and a payer executive's words are stronger evidence than any modelled savings figure.
Evidence and limitation: Logos do not say what was signed. Add whether each is a pilot or a full contract.
What a founder can adapt: If payers have signed, put their names on the business model slide, with permission.
Supporting analysis
What the deck claims: "Payors and Providers choose MedArrive to improve outcomes", with health-plan names and a quote from a health-plan chief executive.
Presentation choice: Named payers and a payer executive's words are stronger evidence than any modelled savings figure.
When it does not fit: Logos do not say what was signed. Add whether each is a pilot or a full contract.
Home-based care equipment and services coordination.
Verified source excerpt — slide 7
Payers save 15% on home-based care spend; patients start care on time 95% of the time versus an industry average of 50%; referring providers spend 45% less time ordering and suppliers 60% less time processing orders.
The exact reimbursement slide image is not present in the stored slide-image set. No substitute is used.
Our analysis: Shows the value for every party in the money flow, starting with the payer who funds the contract.
Evidence and limitation: State how each percentage was measured and over what period; payers will ask.
What a founder can adapt: List the benefit to each party, and lead with the one who pays you.
Supporting analysis
What the deck claims: Payers save 15% on home-based care spend; patients start care on time 95% of the time versus an industry average of 50%; referring providers spend 45% less time ordering and suppliers 60% less time processing orders.
Presentation choice: Shows the value for every party in the money flow, starting with the payer who funds the contract.
When it does not fit: State how each percentage was measured and over what period; payers will ask.
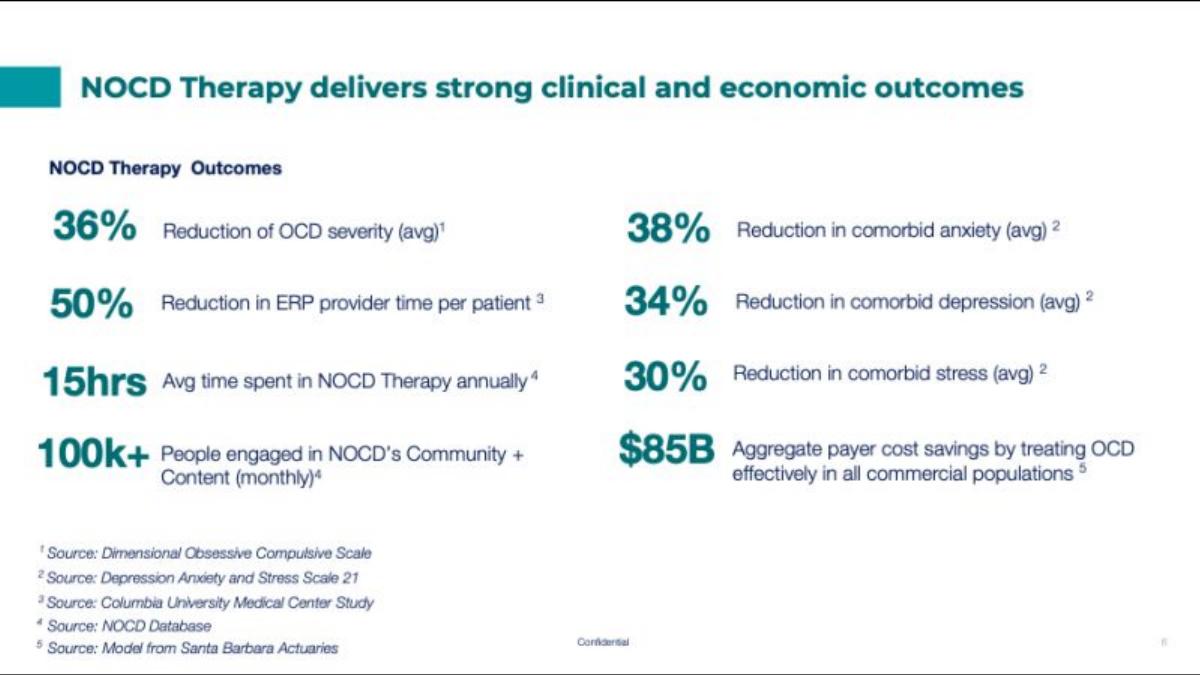
NOCD deck, slide 6. Exact stored slide matched to this analysis.
Our analysis: Joins clinical outcomes and payer economics on one slide, which is how payers evaluate behavioural health vendors.
Evidence and limitation: An industry-wide savings estimate is not your savings. NOCD's footnote attributes the $85B figure to an actuarial model; keep that label visible, as NOCD did.
What a founder can adapt: Put your outcome measure and the cost it affects side by side.
Supporting analysis
What the deck claims: Clinical outcomes including an average 36% reduction in OCD severity and 38% reduction in comorbid anxiety, alongside an estimate of aggregate payer cost savings from effective OCD treatment.
Presentation choice: Joins clinical outcomes and payer economics on one slide, which is how payers evaluate behavioural health vendors.
When it does not fit: An industry-wide savings estimate is not your savings. NOCD's footnote attributes the $85B figure to an actuarial model; keep that label visible, as NOCD did.
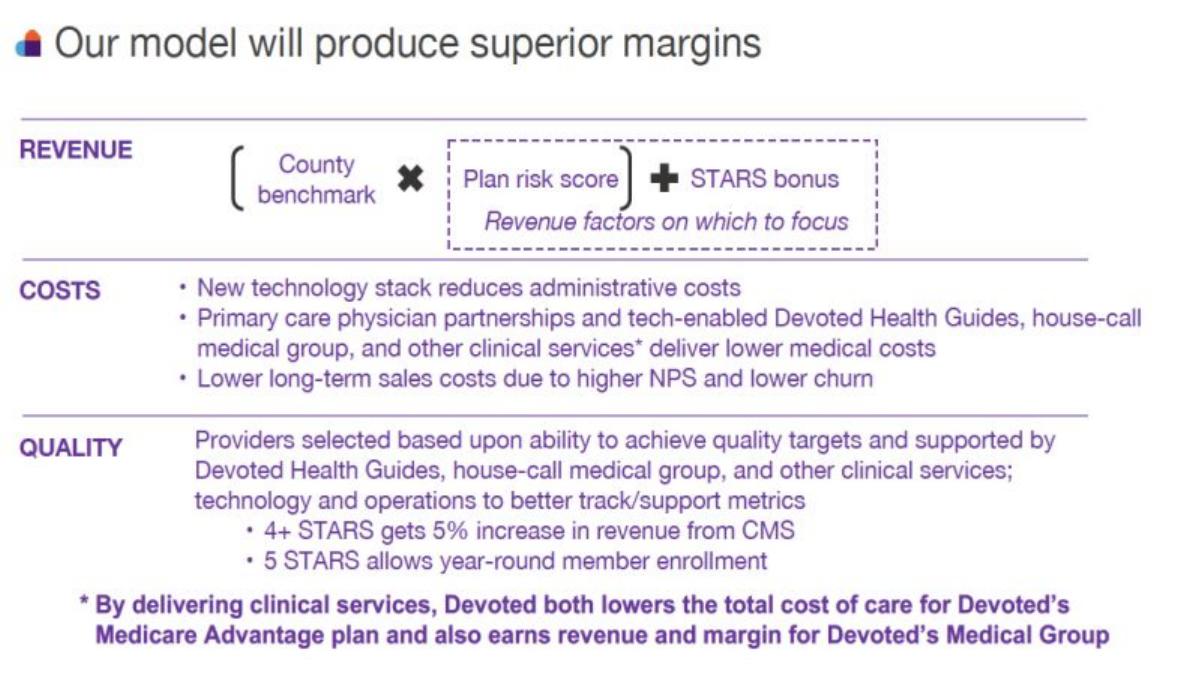
Devoted Health deck, slide 3. Exact stored slide matched to this analysis.
Our analysis: Breaks the risk-bearing model into revenue drivers, cost drivers and quality, which is how investors analyse a health plan.
Evidence and limitation: Label targets as targets. Devoted's unit-economics slide was marked "targeted, draft" — copy that honesty.
What a founder can adapt: If you take risk, show the drivers of revenue per member and of medical cost separately.
Supporting analysis
What the deck claims: "Our model will produce superior margins": revenue factors including plan risk score and Star ratings bonus; costs reduced through technology, primary care partnerships and in-home clinical services; quality through provider selection.
Presentation choice: Breaks the risk-bearing model into revenue drivers, cost drivers and quality, which is how investors analyse a health plan.
When it does not fit: Label targets as targets. Devoted's unit-economics slide was marked "targeted, draft" — copy that honesty.
Medicare plan distributed through community pharmacies, Series B.
Verified source excerpt — slide 10
Claims a customer acquisition cost one-twentieth of large incumbents' by using a free pharmacy distribution channel instead of broker commissions, and that members came through word of mouth with no advertising spend.
The exact reimbursement slide image is not present in the stored slide-image set. No substitute is used.
Our analysis: In a risk-bearing plan, distribution cost is a major lever; the slide makes that lever explicit.
Evidence and limitation: Comparisons with named competitors need a source; state where the incumbents' figures come from.
What a founder can adapt: If your advantage is acquisition cost, show the comparison and how it is calculated.
Supporting analysis
What the deck claims: Claims a customer acquisition cost one-twentieth of large incumbents' by using a free pharmacy distribution channel instead of broker commissions, and that members came through word of mouth with no advertising spend.
Presentation choice: In a risk-bearing plan, distribution cost is a major lever; the slide makes that lever explicit.
When it does not fit: Comparisons with named competitors need a source; state where the incumbents' figures come from.
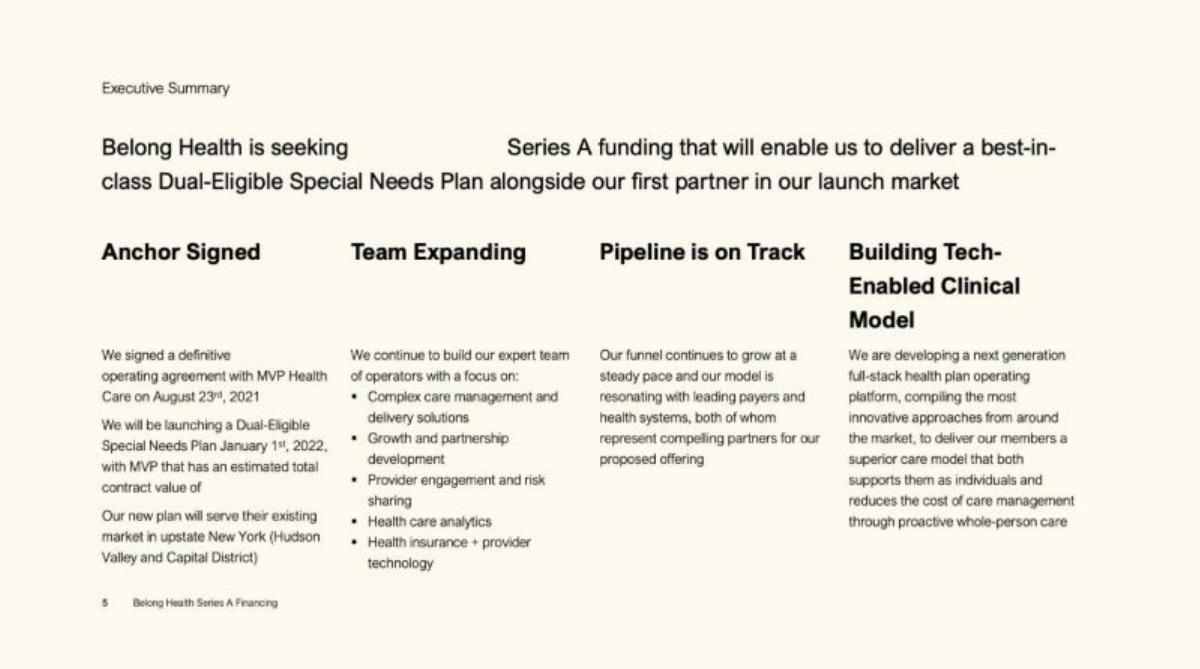
Belong Health deck, slide 5. Exact stored slide matched to this analysis.
Our analysis: A signed agreement with a dated launch is concrete evidence for a risk-bearing partnership model.
Evidence and limitation: Explain what share of risk and revenue the partnership gives you; investors will model it.
What a founder can adapt: Put the signed agreement, its date and the launch date on the slide.
Supporting analysis
What the deck claims: Announces a definitive operating agreement with a regional health plan, signed in August 2021, to launch a Dual-Eligible Special Needs Plan in January 2022.
Presentation choice: A signed agreement with a dated launch is concrete evidence for a risk-bearing partnership model.
When it does not fit: Explain what share of risk and revenue the partnership gives you; investors will model it.
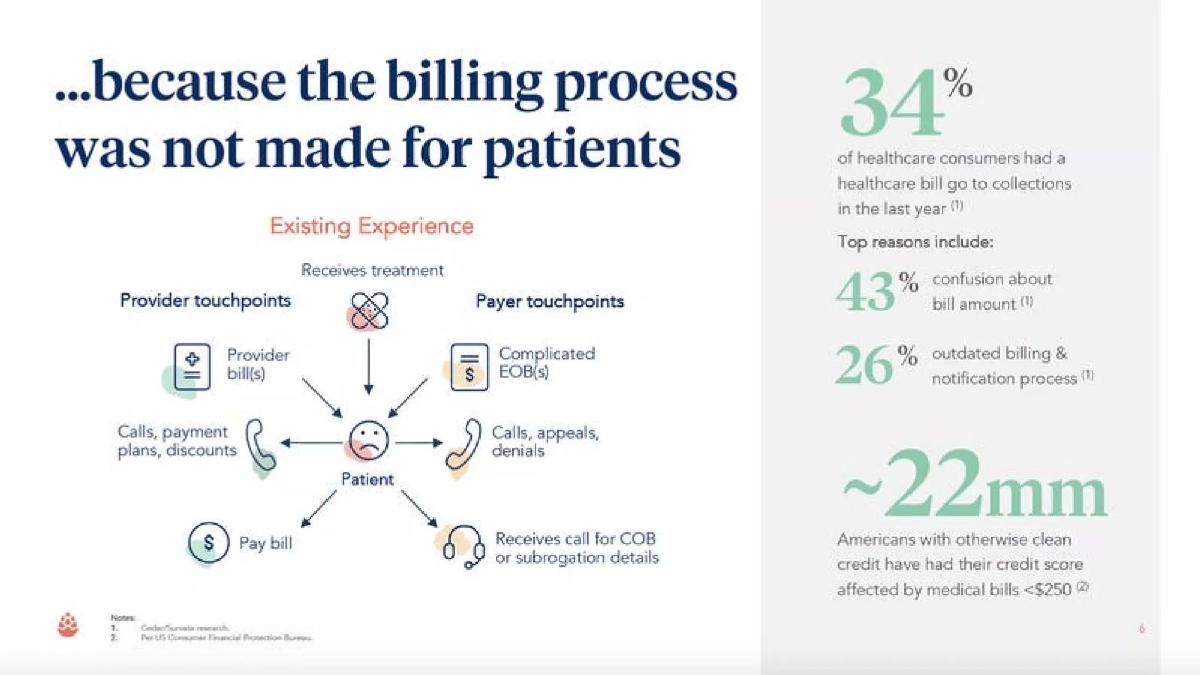
Cedar deck, slide 6. Exact stored slide matched to this analysis.
Our analysis: Shows a reimbursement-adjacent business whose customer is the provider collecting the patient's share.
Evidence and limitation: Keep the payer's role clear so investors do not assume coverage risk that you do not carry.
What a founder can adapt: If you sit on the patient-payment side, show the provider's revenue at stake.
Supporting analysis
What the deck claims: Frames the problem as a billing process not made for patients: confusing bills, many provider and payer touchpoints, and bills sent to collections.
Presentation choice: Shows a reimbursement-adjacent business whose customer is the provider collecting the patient's share.
When it does not fit: Keep the payer's role clear so investors do not assume coverage risk that you do not carry.
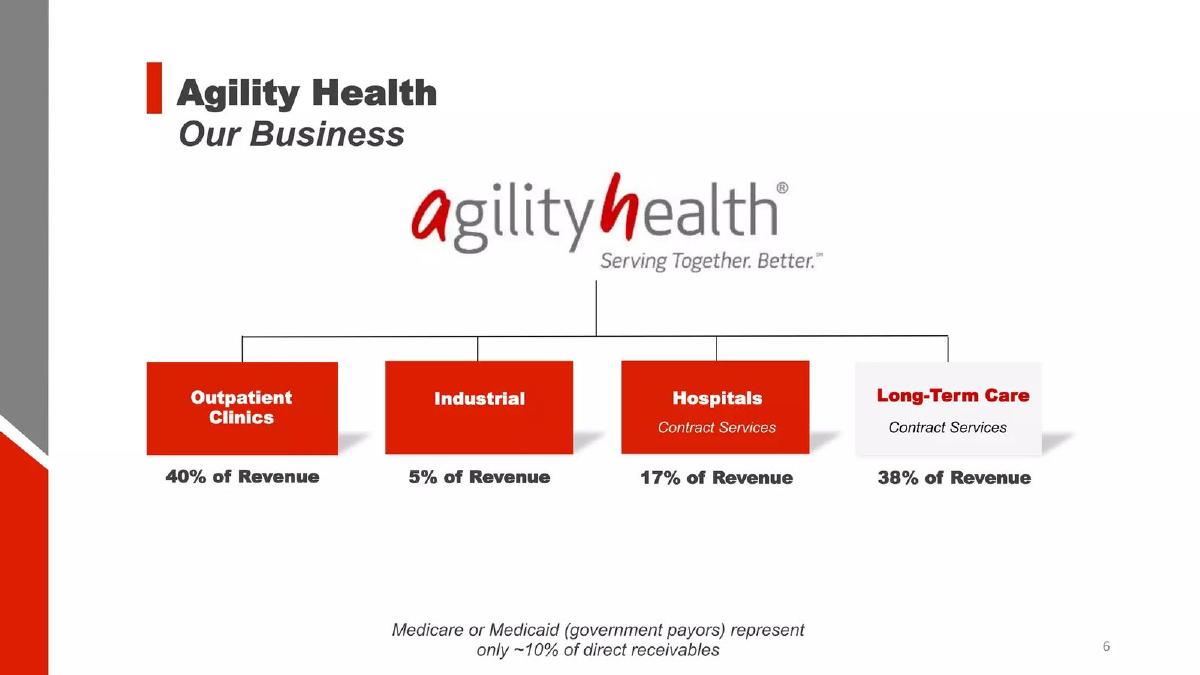
A rehabilitation and therapy services provider; slide 6 is titled "Our Business". Year not recorded.
Agility Health deck, slide 6. Exact stored slide matched to this analysis.
Our analysis: It answers payer-mix exposure directly: most revenue comes through contracts with facilities, so a government rate cut would hit receivables less than a clinic-only model would suggest.
Evidence and limitation: "Direct" receivables may exclude government money that reaches the business through contracted facilities, so the ~10% can understate indirect exposure; say how it is measured.
What a founder can adapt: If you sell services, show revenue by channel and state the share that depends on government payers in one line.
Supporting analysis
What the deck claims: Splits revenue into outpatient clinics (40%), industrial (5%), hospital contract services (17%) and long-term care contract services (38%), with a footnote that "Medicare or Medicaid (government payors) represent only ~10% of direct receivables".
Presentation choice: It answers payer-mix exposure directly: most revenue comes through contracts with facilities, so a government rate cut would hit receivables less than a clinic-only model would suggest.
When it does not fit: "Direct" receivables may exclude government money that reaches the business through contracted facilities, so the ~10% can understate indirect exposure; say how it is measured.
A summary of what each approach needs to show and where investors push hardest.
Approach
Who pays
Key evidence to show
Main risk
Examples
Bill under existing codes
Medicare, insurers via providers
Code or rule cited; payment per patient; clinician workflow
Rate and rule changes each year
100Plus; AcuMedical; MedArrive (tailwinds)
Sell savings
Health plans, employers, providers
Measured savings with method; named paying payers
Proof and slow pilot-to-contract cycles
Tomorrow Health; NOCD; SempreHealth; MedArrive
Take on risk
Government programme via the company's plan
Revenue per member; medical cost ratio; approvals
Capital, regulation, cost volatility
Devoted Health; Troy Medicare; Belong Health
Patient-payment side
Providers
Collection rates and cost to collect
Provider sales cycles
Cedar
Key Takeaways
Cite the exact payment mechanism. 100Plus names CPT 99454 and 99457/8 and a per-patient amount; AcuMedical only says reimbursement "is available" with a $60–$400 range, which leaves payer and setting unclear.
Keep existing and hoped-for payment apart. AcuMedical lists a "potential new reimbursement code" on its own line, which is the honest pattern even though the slide gives no timeline.
Named payers beat modelled savings. MedArrive shows health-plan executives quoted by name; NOCD's $85B figure is an actuarial model of all commercial populations, not NOCD's own results, and its footnote says so.
If you carry risk, split revenue drivers from cost drivers. Devoted separates benchmark, risk score and Star bonus from cost levers; Belong Health backs its plan with a dated, signed operating agreement.
Write your reimbursement line
Answer four questions before you design the slide. If one has no answer yet, say so on the slide.
Payer. Who sends the money: Medicare, a named health plan, an employer, a provider or the patient?
Mechanism. Which code, contract type or plan status makes payment possible today? Cite it by name.
Evidence. What proves the money arrives: paid claims, signed contracts, renewals or measured savings with a stated method?
Open risk. What still has to happen (new code, coverage decision, pilot conversion) and by when?
Copyable framework: [Payer] pays [amount] per [patient/member/procedure] through [mechanism]; evidence: [claims, contracts or measured savings]; still pending: [risk] by [date].
Illustrative example 1 — written by us
Before: Reimbursement is available; insurers will pay
After: Medicare pays for device supply under [CPT code] at [amount] per patient per year; [number] claims paid to date; a new code for [service] is pending with no date yet
What improved: Our illustrative rewrite names payer, mechanism, evidence and what is still uncertain. The bracketed values are placeholders, not any company's figures.
Why reimbursement gets its own slide in healthcare
In most software businesses the user and the buyer are the same person or the same company. In healthcare they usually are not. A patient receives care, a clinician orders it, a provider organisation delivers it and a payer — a government programme, an insurer or an employer — pays for it. A product that clinicians love and patients need can still fail if no payer has a reason, or a mechanism, to pay.
That is why investors in healthcare read the reimbursement story before the market size. A large market is irrelevant if the company cannot get paid in it. A deck that shows a clear payment path, even a modest one, is more fundable than a deck that shows a huge market with no named payer.
It also explains a common search from founders: how to pitch reimbursement risk. The honest answer is to separate what is already true (a code exists, a contract is signed, a plan is live) from what still has to happen (coverage decisions, new codes, contract renewals), and to show the evidence for each.
Approach 1: Bill under codes that already exist
The simplest reimbursement story is that the service is already paid for. The company either bills directly or makes it easy for clinicians to bill for work they can already be paid for.
Remote patient monitoring is the clearest example in our corpus. Medicare's physician fee schedule final rule for 2019 adopted CPT codes 99453, 99454 and 99457 for payment — codes describing set-up and patient education, device supply with daily recordings, and monitoring treatment management services. Several healthcare decks built their business model directly on this change. 100Plus's deck explains that Medicare introduced remote patient monitoring in 2019 and describes how practitioners recommend devices to their Medicare patients to track chronic conditions. MedArrive's market slide lists "regulatory tailwinds" that make it easier to access and get reimbursement for telehealth and remote monitoring.
The strength of this approach is certainty: the payment mechanism exists and can be cited. The risk is that someone else controls it. Payment rates, billing rules and eligibility can change in each annual rule-making cycle, and a business built on a single code is exposed to every change to that code. Investors will ask how revenue behaves if the rate falls, and whether the product still creates value for a provider at a lower rate.
If you use this approach, cite the rule or code by name, show the payment per patient that your model assumes and its source, and show sensitivity: what happens to your margins if the rate changes. If you depend on a code that does not yet exist, say so plainly — AcuMedical's solution slide, for example, lists reimbursement that is available today and a "potential new reimbursement code" separately. (Centers for Medicare & Medicaid Services (Federal Register), U.S. Department of Health and Human Services)
Approach 2: Sell measurable savings to the payer
The second approach does not rely on a billing code. Instead, the company contracts with a health plan, an employer or a provider organisation and is paid because it lowers the payer's total cost or improves the quality measures the payer is judged on.
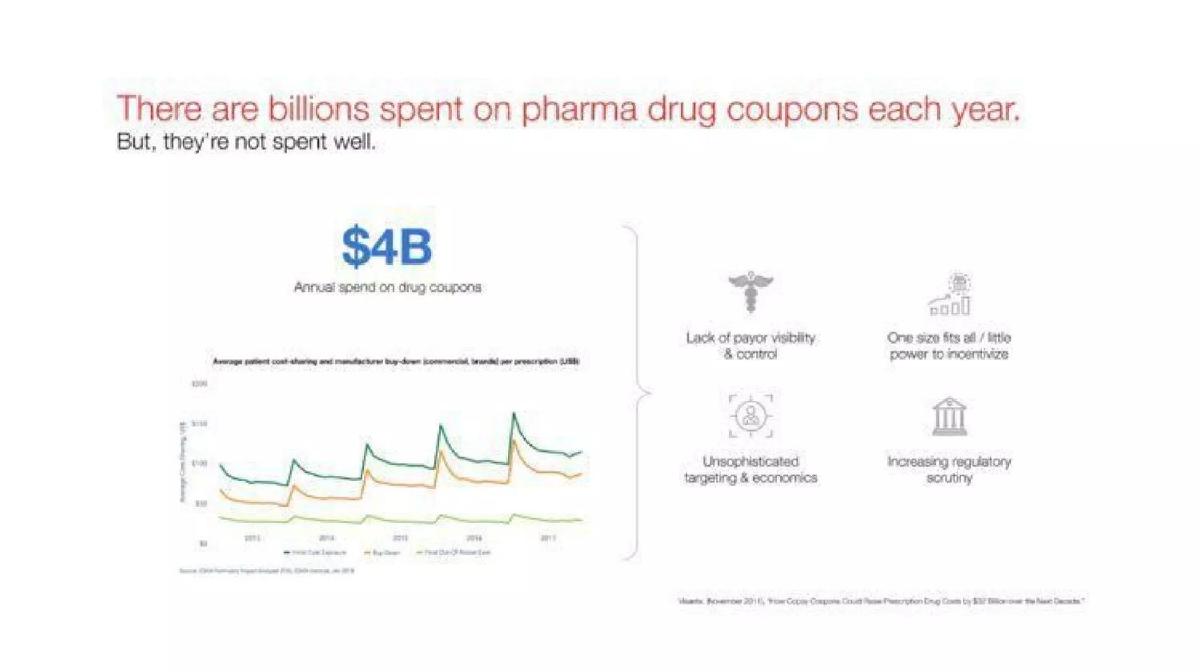
Tomorrow Health's deck states that payers save 15% on home-based care spend, that patients start care on time 95% of the time compared with an industry average of 50%, and that referring providers and equipment suppliers spend less time on orders. NOCD's deck pairs clinical outcomes — for example an average 36% reduction in OCD severity — with an estimate of the aggregate cost payers could save by treating OCD effectively. SempreHealth described the lack of payer visibility into drug-coupon spending and later claimed average annual savings per member per drug.
Two things make this approach convincing. The first is a savings figure measured in the payer's own terms, with a method: savings per member per month, reduction in a specific cost category, or a quality score. The second is named payers, ideally paying ones. MedArrive's deck led with health-plan names and a quote from a health-plan chief executive; that is stronger evidence than any modelled savings number.
The risk here is proof. A payer will pay for savings only if it believes them, and payers typically want their own data to confirm results before they expand a contract. Investors will ask how savings were measured (a controlled comparison, a before-and-after study, a model), who measured them, and how long it takes to move from a pilot to a full contract. (Centers for Medicare & Medicaid Services)
Approach 3: Become or partner with the payer and take on risk
The third approach is the most capital-intensive and, if it works, the most valuable: the company becomes the payer, or contracts with one to take financial responsibility for a population's care. It receives a fixed amount per member and keeps the difference between that revenue and the cost of care.
In the United States, the most common vehicle in our corpus is Medicare Advantage. Devoted Health's deck describes revenue driven by plan risk scores and Star ratings bonuses, and a cost story built on lower administrative cost, partnerships with primary care physicians and in-home clinical services; one slide shows targeted draft unit economics with medical expenses as a share of revenue. Troy Medicare's deck positions the company as a Medicare company distributing through local pharmacies, claiming more than 21,000 pharmacy relationships and a customer acquisition cost it describes as one-twentieth of large incumbents'. Belong Health's deck announced a definitive operating agreement with a regional health plan and a planned Dual-Eligible Special Needs Plan — a type of Medicare Advantage plan for people who have both Medicare and Medicaid.
The strength of this approach is that the company captures the full economic value of better care. The risks are large and specific: regulatory approval, capital reserves, the accuracy of risk scores, medical cost that can swing with a small number of very sick members, and dependence on government payment rates. Investors will read the medical cost ratio — medical expenses as a share of premium revenue — as closely as a software investor reads gross margin.
If you take this approach, show the revenue per member and its drivers, the medical cost ratio today and its target, how your model changes that ratio, and the regulatory and capital milestones between now and scale. Label targets as targets, as Devoted's slide did with "targeted, draft". (Medicare.gov)
A fourth case: when the patient pays part of the bill
Some companies do not sit on the payer side at all but on the patient's share of the bill. Cedar's deck frames the problem as a billing process "not made for patients", with confusing bills, multiple provider and payer touchpoints, and bills that go to collections. The company sells to providers, whose revenue depends on collecting the patient's portion.
Here the reimbursement slide is really a revenue-cycle slide: who pays the company (the provider), and what measurable improvement it delivers (higher collection, lower cost to collect, fewer calls). The payer still matters, because insurance design decides how much the patient owes, but the company's revenue does not depend on a coverage decision.
What investors ask about reimbursement risk
Who is the economic buyer, and have they paid you yet? A named, paying customer is the strongest evidence in any of the three approaches.
What mechanism pays you? An existing code, a contract, a capitated rate or a direct patient payment. If more than one, which share of revenue comes from each?
What would change the payment? Annual rule-making, contract renewal cycles, coverage policies and competing products. Show that you know the calendar that governs your revenue.
How long is the path to payment? Time from first conversation to signed contract, and from signed contract to cash. Healthcare sales cycles are long, and investors will want the runway to cover them.
What is the evidence of value? Clinical outcomes, cost savings and quality measures, each with the method used to measure them.
How to build the slide
Draw the money flow first: patient, clinician, provider organisation, payer and your company, with arrows showing who pays whom and for what. If the diagram needs more than one slide to explain, simplify the business model before you simplify the slide.
Then add three short blocks: the mechanism (code, contract or risk arrangement, with a citation), the evidence (named payers, measured savings, live plans) and the open risks (what still has to happen, and by when).
Finally, reconcile the slide with your financial model. The price per patient or per member on this slide should be the same number your revenue model uses. Mismatches between the reimbursement story and the financials are one of the fastest ways to lose a healthcare investor's confidence.
Common mistakes
No named payer. "Insurers will pay" is not a payment path. Name the payer type and the mechanism.
Treating a hoped-for code as existing. If a code or coverage decision is still needed, say so and show the timeline.
Market-level savings presented as your results. Industry estimates are context. Show savings measured in your own programmes, with the method.
Logos without contract status. Say which payers are pilots, which are paying and which have renewed.
A reimbursement story that does not match the model. The price per patient or per member on this slide must be the one your financial model uses.
Ignoring the payment calendar. Annual rules and contract renewals decide your revenue. Show that you know the dates.
Diagnostic checklist
The slide names who pays, through what mechanism, and for what.
Any code, rule or programme is cited by name.
Existing payment and hoped-for payment are separated.
Savings claims state how and over what period they were measured.
Payer names show their contract status (pilot, paying, renewed).
If you take on risk, revenue per member and medical cost ratio are shown, with targets labelled.
Open risks and the dates that could change payment are listed.
The numbers match the financial model.
Frequently asked questions
How do you pitch reimbursement risk to investors?
Separate what is already true (an existing code, a signed contract, a live plan) from what still has to happen (coverage decisions, new codes, renewals), show the evidence for each, and show how your business performs if payment changes.
Which Medicare codes cover remote patient monitoring?
Should a healthcare startup rely on a single billing code?
It can start there, but investors will ask how exposed revenue is to changes in that code's rate or rules. Show sensitivity and a plan to diversify payment.
What is a Dual-Eligible Special Needs Plan?
A type of Medicare Advantage Special Needs Plan for people who have both Medicare and Medicaid. Several startups in our corpus built risk-bearing businesses around these plans. (Medicare.gov)
What do investors look for in a value-based care business model?
Evidence that the company improves outcomes and lowers the total cost of care, measured in the payer's terms, plus named paying payers and a clear view of the financial risk the company carries. (Centers for Medicare & Medicaid Services)
Where does the reimbursement slide go in a healthcare deck?
Usually as part of, or right after, the business model slide. Some investors want it before the market slide, because a market without a payment path is not addressable.
How we chose these examples
Corpus: published pitch deck teardowns on StartupFundraising.com, healthtech sector only. Founder-uploaded private decks are excluded entirely.
Selection: we searched the extracted slide text of healthtech decks for reimbursement, CPT codes, Medicare, Medicaid, payer and payor. 46 decks matched at least one term; some matches were incidental. We read the matched slides of the decks with the most matches and chose ten examples that clearly show one of the reimbursement approaches.
Review: examples were selected by our editorial model from the extracted slide text; on 2026-09-24 the eight stored slide images were inspected and matched to company, deck and slide number. No person has yet completed an editorial review of this page.
Figures quoted are the companies' own claims on their slides, often from older decks. We have not verified them, and company circumstances may have changed since.
Regulatory facts are cited to primary government sources retrieved on 2026-09-23. Payment rules change; this page is not billing, legal or regulatory advice.
We make no claim that any reimbursement slide caused a fundraising outcome.