Devoted Health raised $300M in 2019 for its Series B round using a deck that, in this 4-slide version, eschews traditional storytelling for rigorous financial modeling. The deck targets the core mechanics of the Medicare Advantage business, specifically how a 'new technology stack' and 'house-call medical groups' can drive medical and administrative expenses below industry benchmarks. By projecting a path from 5,000 members in 2019 to over 103,000 by 2023, the company presented a clear scale-up narrative backed by specific margin targets. The teardown explores how Devoted used these slides to…
Key takeaways
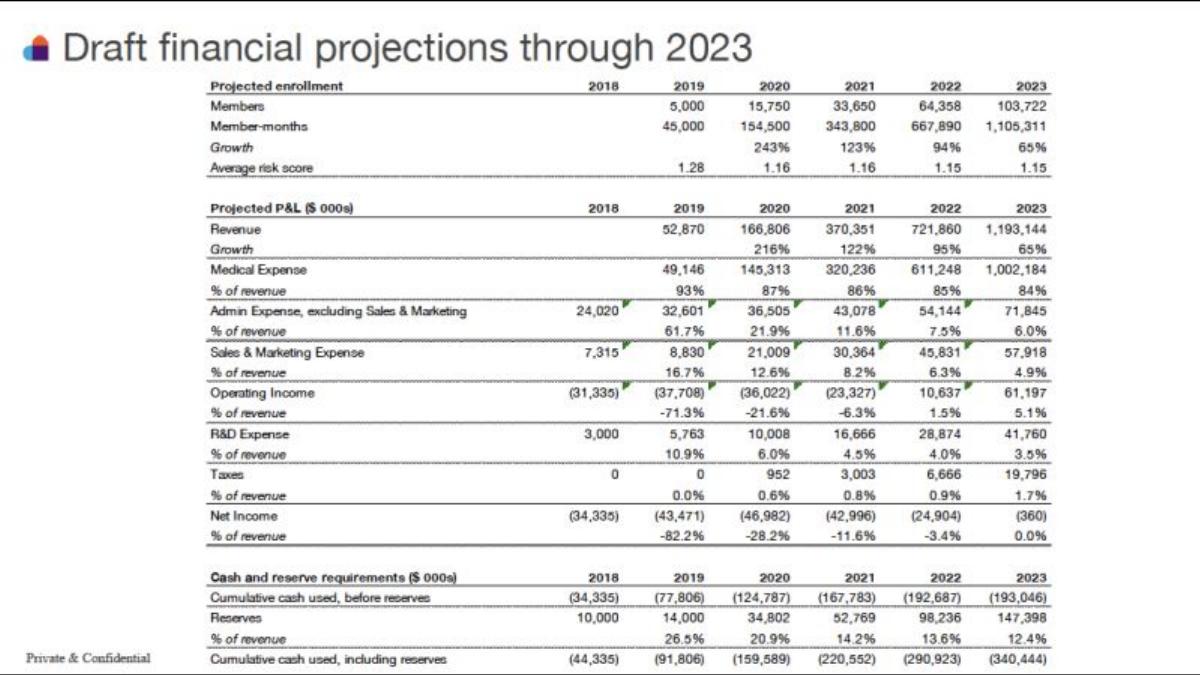
- The deck projects a massive scale-up in membership from 5,000 in 2019 to 103,722 by 2023 (Slide 2).
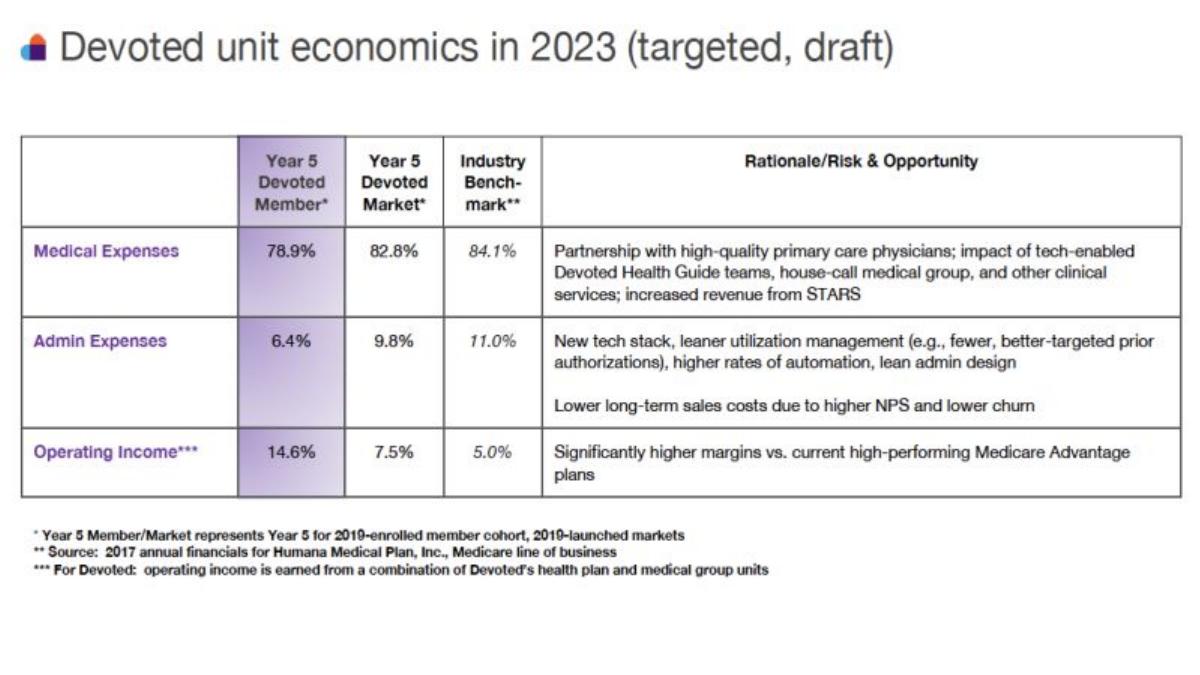
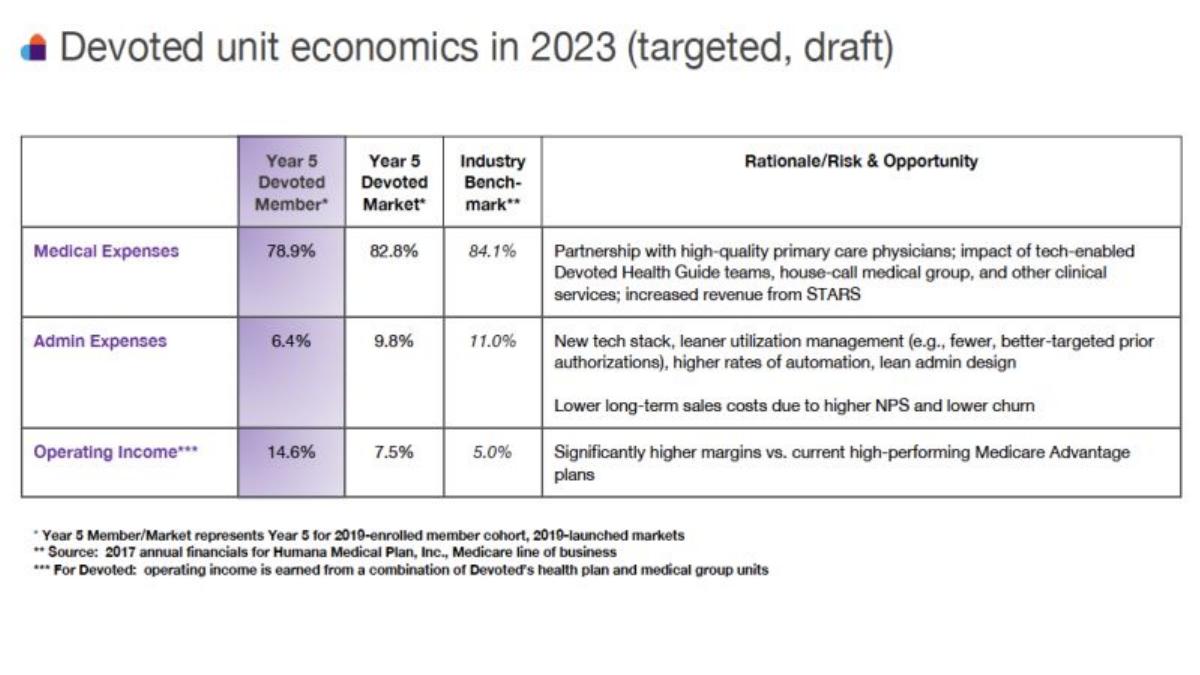
- Devoted Health targets an operating income of 14.6% for year-5 members, significantly higher than the 5.0% industry benchmark (Slide 1).
- The financial model anticipates reaching revenue of $1.19 billion by 2023 while narrowing net losses to near-zero (Slide 2).
- The company identifies its 'new technology stack' as the primary driver for reducing administrative expenses to 6.4% for mature members (Slide 1).
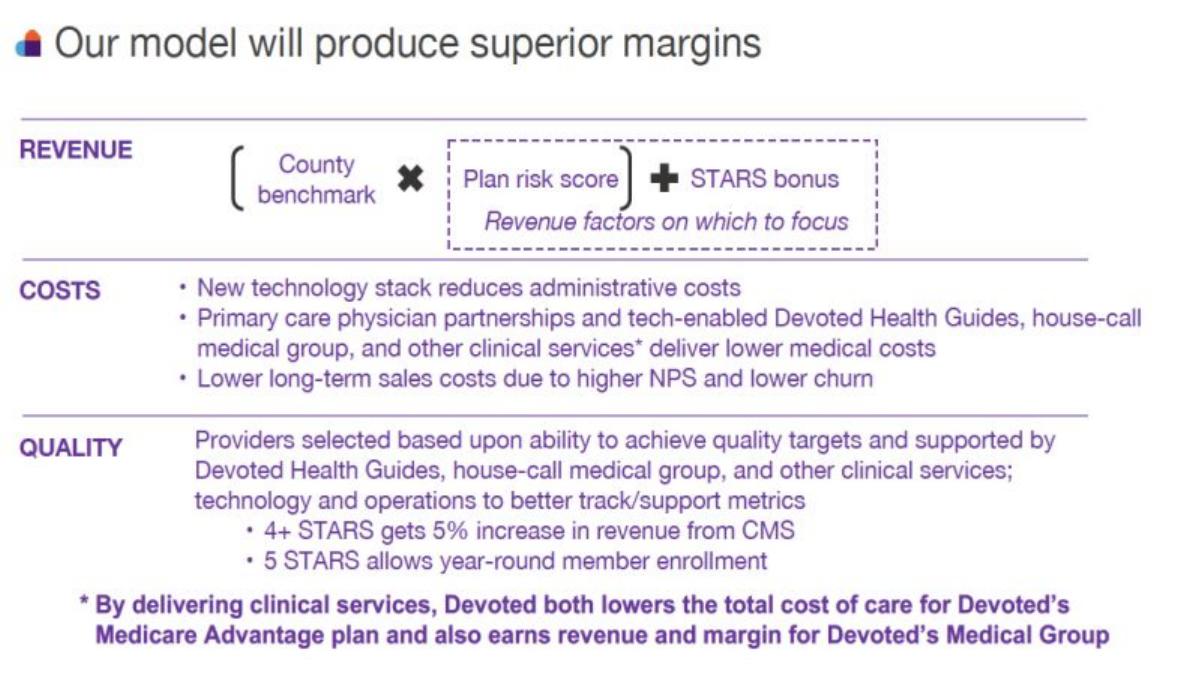
- Revenue is calculated through a specific formula involving County benchmarks, Plan risk scores, and STARS bonuses (Slide 3).
- The deck explicitly benchmarks its performance against 2017 financials for Humana Medical Plan, Inc. (Slide 1).
- Cumulative cash used, including reserves, is projected to reach $340.4 million by 2023, justifying the large Series B raise (Slide 2).
- The model relies on achieving 4+ STARS to secure a 5% revenue increase from CMS (Slide 3).
The Quantitative Series B: Proving the Model
Devoted Health’s 2019 Series B deck is a masterclass in financial transparency and sector-specific modeling. While many startup decks rely on visionary imagery and broad market strokes, this 4-slide set dives immediately into the weeds of Medicare Advantage (MA) economics. For a company that raised $300 million, the message was clear: we have built a superior financial engine for healthcare delivery.
The deck focuses on three core pillars: unit economics at maturity, a five-year P&L projection, and the structural levers of their revenue model. By benchmarking themselves directly against industry leaders like Humana, Devoted Health positioned itself not just as a startup, but as a more efficient evolution of the traditional payer model.
Slide 1: Devoted Unit Economics in 2023
Slide 1 is perhaps the most important slide in the deck. It presents a 'targeted, draft' view of what a single member and a single market look like after five years of operation. The slide uses a four-column table to compare a 'Year 5 Devoted Member' and a 'Year 5 Devoted Market' against an 'Industry Benchmark.'
The figures are striking. Devoted targets Medical Expenses of 78.9% for a mature member, compared to an 84.1% industry benchmark. The rationale provided is a 'partnership with high-quality primary care physicians' and the impact of their 'house-call medical group.' Even more aggressive is the Admin Expenses target of 6.4%, nearly half the 11.0% benchmark. They attribute this to a 'new tech stack' and 'higher rates of automation.'
The bottom line of this slide is the Operating Income . Devoted projects a 14.6% margin for mature members, which is nearly triple the 5.0% industry benchmark cited from Humana’s 2017 financials. This slide answers the 'why' for investors: if Devoted can hit these numbers, it will be significantly more profitable than any incumbent in the space.
Slide 2: Draft Financial Projections through 2023
Slide 2 moves from the unit level to the enterprise level. It provides a full P&L forecast from 2018 through 2023. The growth trajectory is ambitious, moving from 5,000 members in 2019 to 103,722 members by 2023. This represents a revenue jump from $52.8 million to over $1.19 billion in just four years.
The slide also highlights the 'J-curve' of startup growth. Operating Income is projected to stay negative through 2021 (-$23.3 million) before turning positive in 2022 ($10.6 million). By 2023, the company expects to reach an operating income of $61.1 million, or 5.1% of revenue.
Crucially for a Series B investor, the bottom section of the slide addresses Cash and reserve requirements . It shows that while cumulative cash used for operations is $193 million by 2023, the 'Cumulative cash used, including reserves' hits $340.4 million . This explains the necessity of the $300M round; in the insurance world, you don't just need money to pay employees; you need money to sit in a bank to satisfy regulators as your enrollment grows.
Slide 3: The Revenue and Quality Model
Slide 3 explains the 'how' behind the numbers. It breaks down the business into three categories: Revenue, Costs, and Quality. The Revenue section provides the actual formula used to calculate income: (County benchmark x Plan risk score) + STARS bonus. This shows a deep understanding of the CMS (Centers for Medicare & Medicaid Services) payment mechanisms.
The Quality section emphasizes the importance of the STARS rating. It notes that a 4+ STARS rating results in a '5% increase in revenue from CMS,' while a 5 STARS rating 'allows year-round member enrollment.' This connects the clinical side of the business (house-calls and guide teams) directly to the financial side. The footnote clarifies a key part of their vertical integration: by delivering clinical services, Devoted lowers the cost of care for the health plan while simultaneously earning a margin for its own Medical Group.
Slide 4: BestPitchDeck.com Promotional Slide
The final slide in this set is a promotional graphic for BestPitchDeck.com and does not contain information regarding Devoted Health's business model or financials.
What Devoted Health Does Well
The strength of this deck lies in its granularity . In the healthcare space, generalities are dangerous. By providing specific percentages for medical loss ratios (MLR) and administrative costs, Devoted proves they have a handle on the levers that actually move the needle in Medicare Advantage.
They also do a fantastic job of benchmarking . By citing Humana’s 2017 financials as the industry benchmark (Slide 1), they give investors a concrete yardstick. It transforms their claims from 'we will be efficient' to 'we will be 4.6% more efficient than the market leader in admin costs.'
Finally, the integration of clinical and financial goals is seamless. Slide 3 makes it clear that their 'house-call medical group' isn't just a nice-to-have service for seniors; it is a strategic tool to drive the STARS bonus and lower the total cost of care. This vertical integration is the core of their competitive advantage.
What is Missing from the Deck
As a 4-slide excerpt, there are significant gaps that would typically be filled in a full Series B presentation. Most notably, there is no Team slide . In a highly regulated industry like insurance, the pedigree of the founders and the compliance team is paramount. While the listing mentions 'personal guides' and 'top provider partnerships,' the deck doesn't name them.
There is also no Product/Tech visualization . The deck repeatedly mentions a 'new technology stack' as the reason for their lower administrative costs, but it never shows what that stack looks like or how it functions differently from legacy systems. Investors are asked to take the efficiency gains on faith based on the P&L projections.
Lastly, there is no Market slide . While the projections show growth to 103,000 members, the deck doesn't explain which specific counties they are targeting or why those markets are ripe for disruption. The 'County benchmark' is a variable in their revenue formula, but the specific geographic strategy is absent.
Founder Takeaways: How to Copy This Strategy
Benchmark against the 'Goliath': If you are entering a mature industry, don't just say you are better. Find the annual report of the industry leader (like Humana in this case) and put your projected unit economics side-by-side with theirs. It forces a quantitative conversation. · Account for Regulatory Capital: If your business model requires reserves (like insurance, fintech, or lending), include a 'Cumulative cash used, including reserves' line in your P&L. It shows you understand the capital intensity of your specific sector. · Show the 'J-Curve': Don't be afraid to show significant losses in the early years. Devoted projected a cumulative cash burn of over $340 million (Slide 2). By showing exactly when and how the business turns profitable, you build trust with sophisticated investors. · Define Your Revenue Formula: Don't just list a price. If your revenue is dependent on complex factors (like risk scores or quality bonuses), show the formula (Slide 3). It demonstrates that you understand the mechanics of how you get paid. · Focus on Mature Unit Economics: Early-stage startups often have messy financials. Use a 'Year 5' or 'Mature Market' slide to show what the business looks like once the initial customer acquisition and setup costs have stabilized.
Frequently asked questions
- Why is the deck so short at only 4 slides?
- This 4-slide set represents the core financial and economic logic of the business. In a Series B round, investors are often already familiar with the problem and the team. The focus shifts to the 'machine' of the business—how it scales, what the unit economics look like at maturity, and how much capital is required to reach break-even. These slides provide the quantitative proof of the company's value proposition.
- How does Devoted Health plan to beat industry giants like Humana?
- According to Slide 1, Devoted plans to achieve lower medical expenses (78.9% vs. 84.1% benchmark) through tech-enabled guide teams and house-call medical groups. They also aim for lower administrative costs (6.4% vs. 11.0% benchmark) by using a modern tech stack that allows for leaner utilization management and higher rates of automation, which legacy insurers struggle to implement due to technical debt.
- What is the significance of the 'STARS bonus' mentioned in the deck?
- The STARS rating is a federal quality metric for Medicare Advantage plans. Slide 3 notes that achieving 4+ STARS results in a 5% revenue increase from CMS, while 5 STARS allows for year-round enrollment. This is a critical lever in their financial model; it increases the 'Revenue' side of the equation without increasing the cost of care, directly boosting the operating margin.
- What are the projected capital requirements for the company?
- Slide 2 provides a detailed breakdown of cash needs. By 2023, the company projected a cumulative cash use of $193 million for operations, but a total of $340.4 million when including required statutory reserves. This explains why a $300M Series B was necessary; insurance businesses require significant capital to be held in reserve as they grow their member base.
- What is missing from this pitch deck?
- This specific 4-slide excerpt lacks a team slide, a problem statement, a competitive landscape (beyond the Humana benchmark), and a specific 'Ask' slide detailing the terms of the round. It also omits the technology architecture details, focusing instead on the financial outcomes that the technology is expected to produce.