Rainergy is a social enterprise developing a generator that harvests energy from rain to provide electricity to off-grid rural areas. The deck outlines a hardware-centric business model with a device priced at $500, aiming for a production cost of $400 to net a $100 profit per unit. Their primary value proposition is a significantly lower energy cost of 1.5 cents per kWh compared to solar (5 cents) and general grid power (25 cents). While the deck highlights a functional 22-watt laboratory prototype capable of powering 22 LED lamps, it lacks a specific fundraising ask, a clear go-to-market ti…
Key takeaways
- The company targets a total available market of 1.5 billion people, specifically focusing on low-income rural households in Indonesia, Philippines, and India (Slide 3).
- Rainergy claims a significant cost advantage, stating their energy price is 1.5 cents per kWh versus 5 cents for solar and 25 cents for general grid power (Slide 4).
- The hardware consists of a rain collector, water tank, pipe, generator, and a battery accumulator (Slide 5).
- A laboratory prototype has been built with a 22-watt power output, which the company states can light up to 22 LED lamps (Slide 5).
- The business model relies on a $500 retail price per device with a $400 manufacturing cost, resulting in a $100 profit per unit (Slide 6).
- Financial projections target a 2% market share, which they calculate as 332,200 customers, leading to a projected annual profit of $3.32 million (Slide 6).
- The deck asserts a lower carbon footprint than solar, though it does not provide the specific data points for the 'Rainergy' bar on the CO2 emission chart (Slide 7).
- The core team includes a CEO/Founder, CTO/Co-founder, Market Researcher, and a Designer/Product Developer (Slide 9).
Executive Summary
Rainergy is a social enterprise aiming to solve energy poverty in rainy, rural regions through a proprietary rain-harvesting generator. The deck focuses heavily on the cost-effectiveness of their solution compared to solar and traditional grid power. While the hardware prototype exists, the deck functions more as a conceptual business plan than a high-growth venture pitch, lacking specific financial requirements or a tactical execution roadmap.
Slide 1: Title Slide
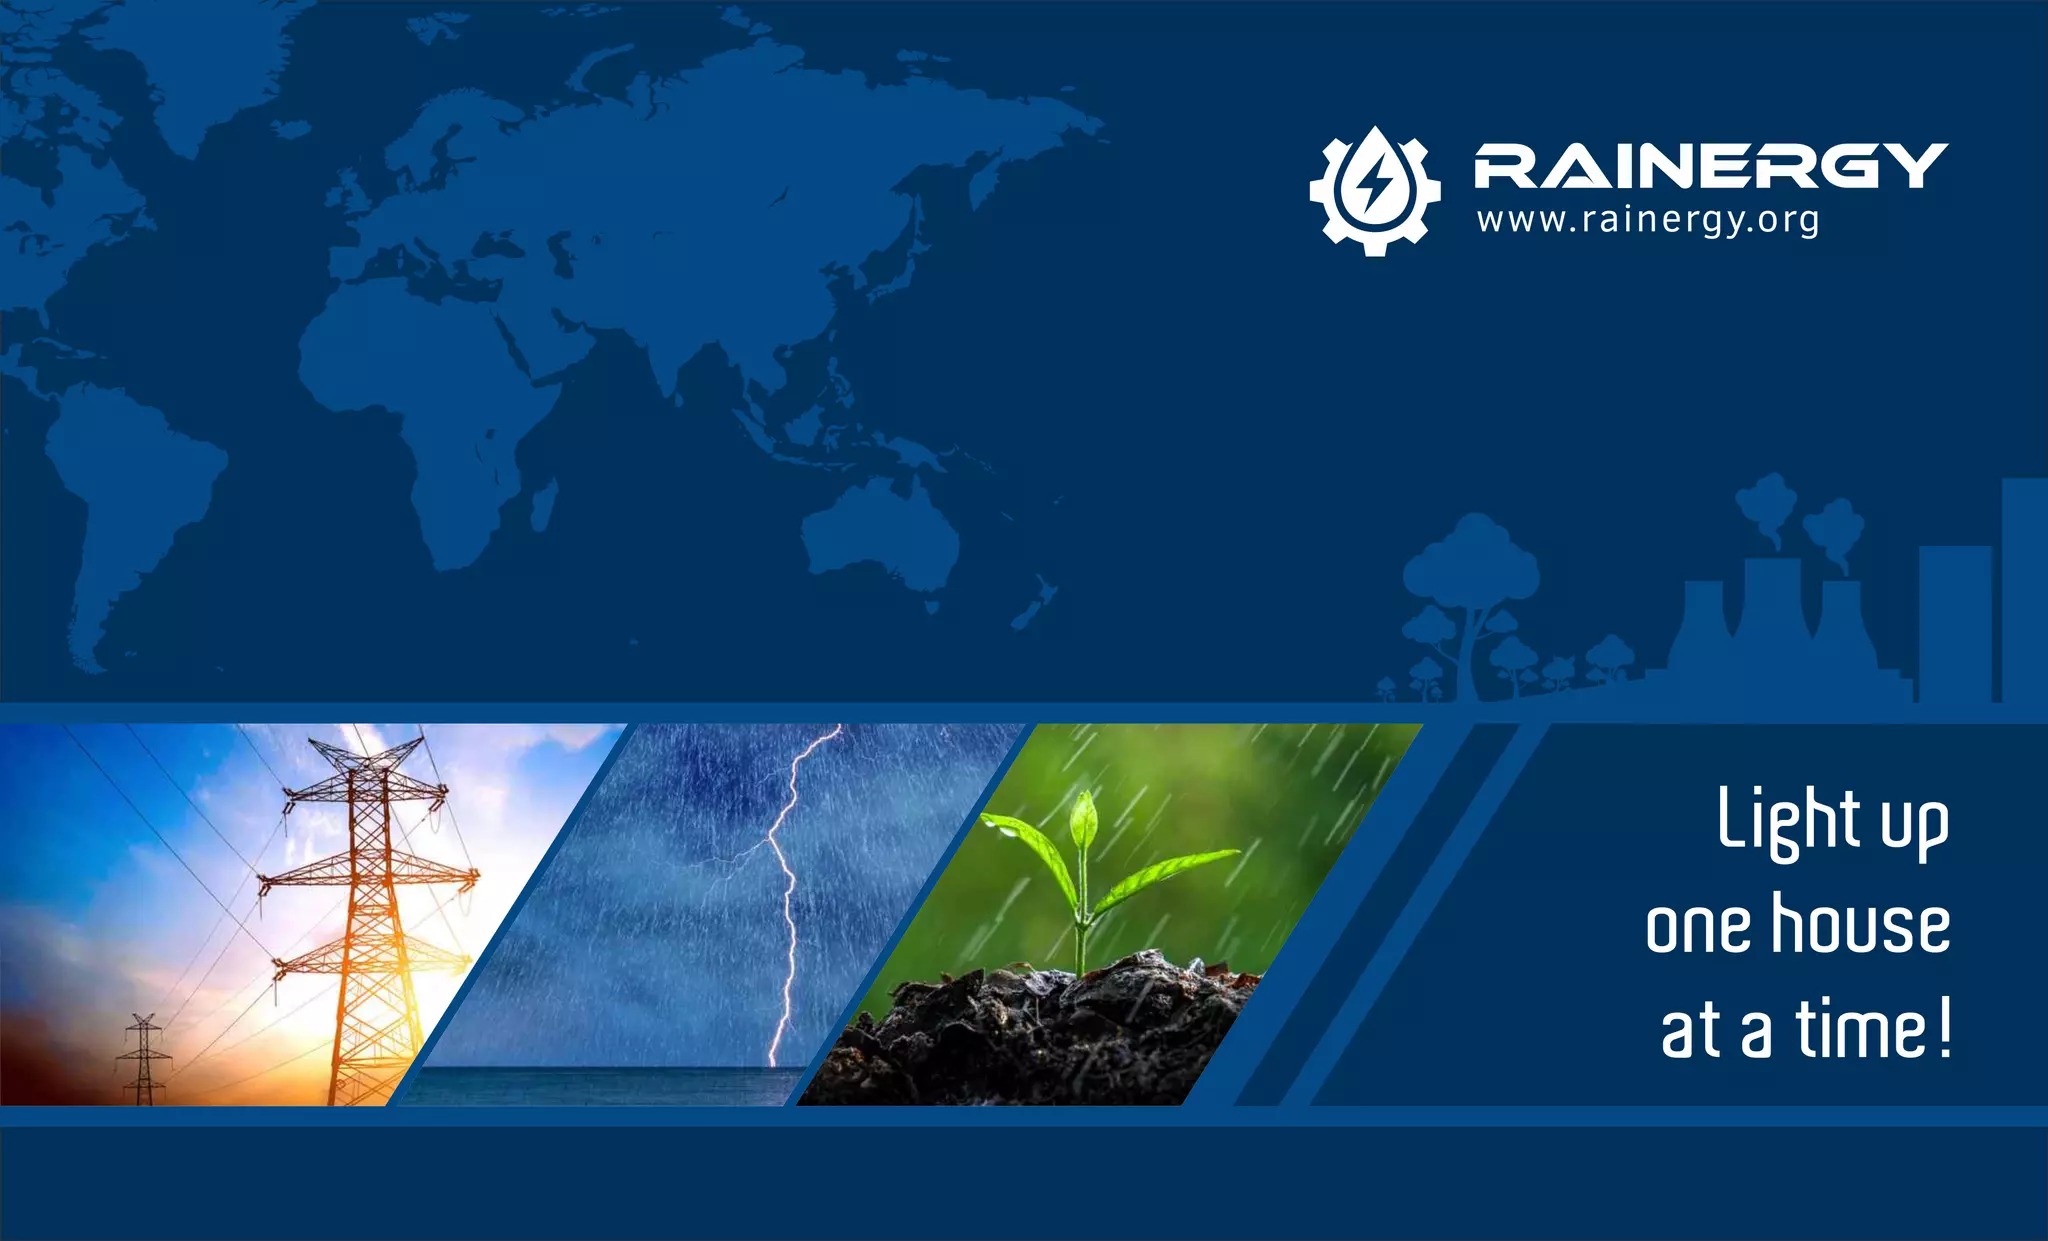
The title slide introduces the brand name, Rainergy, and the tagline "Light up one house at a time!" The visual elements include a world map and imagery of power lines, lightning, and a seedling in the rain, clearly positioning the company in the renewable energy and social impact sectors. The URL www.rainergy.org is provided, suggesting a non-profit or social enterprise orientation.
Slide 2: The Deal
This slide serves as a high-level summary of the business transaction. It uses a simple flow diagram: Rainergy provides a generator priced at $500 per device to low-income rural households. This slide establishes the core product and the primary customer segment immediately, though it does not explain the financing mechanism for how low-income households would afford a $500 upfront cost.
Slide 3: Market Size
Rainergy uses a standard TAM/SAM/SOM framework here. They cite a Total Available Market (TAM) of 1.5 billion+ people. The Serviceable Available Market (SAM) is narrowed to 33 million+, and the Share of Market (SOM) is targeted at 332k+. A text box specifies the target segment as low-income rural households in Indonesia, the Philippines, India, and 10 other countries. The jump from 1.5 billion to 33 million suggests a filter based on rainfall patterns or specific economic criteria, though these criteria are not explicitly defined.
Slide 4: Customer Value Proposition
This slide presents a bar chart comparing energy prices in cents per kWh. The figures quoted are 25 cents for "General" (presumably grid power), 5 cents for Solar, and 1.5 cents for Rainergy. This is the central hook of the deck—a claim that their technology is significantly more affordable than the leading renewable alternative (solar). However, the deck does not provide the underlying data or assumptions used to calculate the 1.5-cent figure, such as the lifespan of the device or the average rainfall required to achieve this rate.
Slide 5: Product
The product slide provides a schematic of the generator. It consists of a "Rain collector" (a funnel-like top), a "Water tank," a "Pipe," a "Generator" at the base, and an "Accumulator, battery" for storage. The slide notes that a laboratory prototype has been built with 22-watt power, capable of lighting 22 LED lamps. This is a critical technical disclosure; 22 watts is a very low power output, suitable for lighting and perhaps small device charging, but not for heavy appliances. It clarifies that this is a micro-scale solution.
Slide 6: Financials
This slide outlines the unit economics and profit projections using a tree diagram. The key figures are:
Net price per product: $500 · Cost per product: $400 · Profit per product: $100 · Market share goal: 2% (332,200 customers) · Total projected profit per year: $3,322,000
The math presented is slightly inconsistent; $100 profit multiplied by 332,200 customers should equal $33,220,000, but the slide lists "Profit/year 3.322.000" at the top level and "Profit/year 33.220" at a lower level. These typographical errors in the financial math undermine the credibility of the projections.
Slide 7: Climate Impact
The company compares its CO2 emissions per kWh to other energy sources. The chart shows Coal at over 1000g, Gas at 400g, Nuclear at ~150g, Solar at ~50g, and Rainergy at a negligible level near zero. While the intent is to show environmental superiority, the lack of specific numerical labels for the Rainergy and Solar bars makes the comparison qualitative rather than quantitative.
Slide 8: Competitive Advantage
Three icons represent the company's moats: "Patent," "Easy to Use," and "Unique Modular Design." The claim of being "Patented" is a strong signal, but the slide does not list a patent number or the jurisdictions in which the patent is held. "Easy to use" is a subjective claim that would be better supported by user testing data or a description of the installation process.
Slide 9: Our Team
Reyhan Jamalova: CEO, Founder · Anvar Jamalov: CTO, Co-founder · Zahra Qasimzade: Market researcher · Rashid Allahqulu: Designer, Product developer
The slide provides photos and titles but lacks professional biographies, past company experience, or educational backgrounds. This makes it difficult for an investor to assess the team's ability to execute a complex hardware and international distribution play.
Slide 10: Photo Gallery
The final slide is a collection of photos showing the team at various events. The most prominent image features the founder at the Global Entrepreneurship Summit (GES) 2017 in India, standing with Ivanka Trump. Other photos show the team receiving awards and demonstrating the prototype at what appears to be a "LaunchPad" event. This slide provides social proof and validates that the project has received some level of public recognition and stage time.
What Works
Clear Value Proposition: The comparison of cents per kWh (Slide 4) is a very effective way to communicate a competitive advantage in the energy sector. It speaks directly to the economic pain point of the target demographic.
Prototype Validation: Explicitly stating that a 22-watt prototype has been built and tested in a lab (Slide 5) moves the project beyond pure ideation. It gives investors a concrete starting point for technical due diligence.
Niche Targeting: By focusing on specific countries like Indonesia and the Philippines (Slide 3)—areas known for high rainfall and off-grid rural populations—the company shows it has considered where its technology is most geographically viable.
What is Missing
The Ask: The most significant omission is the lack of a funding request. There is no mention of how much money is being raised, the terms of the investment, or how the funds will be allocated (e.g., R&D, manufacturing, hiring).
Financial Accuracy: The financial tree on Slide 6 contains conflicting numbers. The math does not consistently scale from the unit level to the annual profit level, which is a major red flag for professional investors.
Technical Depth: For a hardware company, there is very little detail on the efficiency of the generator. Rainfall is intermittent; the deck does not explain the storage capacity of the battery or how many hours of light a typical day of rain provides.
Go-to-Market Strategy: Selling a $500 device to "low-income" households requires a sophisticated distribution and financing strategy (like Pay-As-You-Go or microfinance partnerships). The deck does not address how these customers will pay for or receive the product.
Founder Takeaways
Check your math: If you present a financial slide, every number must reconcile. Inconsistencies in basic multiplication suggest a lack of attention to detail that can kill a deal instantly. Ensure your unit economics clearly lead to your total projections.
Define your 'Low-Income' strategy: If your target market earns only a few dollars a day, a $500 hardware product is effectively unaffordable without a financing partner. Founders in the social impact space must explain the 'how' of the purchase, not just the 'who' of the customer.
Leverage social proof: The inclusion of the GES 2017 photos was a smart move. For early-stage founders with limited track records, showing that you have been vetted by reputable organizations or summits helps build immediate trust.
Be specific about IP: Don't just say "Patented." Specify if it is a utility or design patent, what stage it is in (filed, pending, or granted), and in which countries. Intellectual property is a primary driver of valuation for hardware startups.
Frequently asked questions
- What is the primary technology behind Rainergy?
- Rainergy uses a micro-hydroelectric approach adapted for rainfall. According to slide 5, the device collects rain in a top-mounted collector, which then flows through a pipe to a generator at the base. The electricity generated is stored in a battery accumulator. The current prototype produces 22 watts of power, intended for low-consumption needs like LED lighting in rural, off-grid settings.
- How does Rainergy plan to make money?
- The business model is a direct hardware sale. Slide 6 details the unit economics: a net price of $500 per device against a production cost of $400. This leaves a $100 profit per unit. The company aims for a 2% market share within its target segment, projecting that selling to approximately 332,000 customers would generate over $3.3 million in annual profit.
- Who is the target customer for this device?
- Rainergy is specifically targeting low-income rural households that lack reliable access to the electrical grid. Slide 3 identifies the primary geographic focus as Indonesia, the Philippines, and India, along with 10 other unnamed countries. They estimate the total available market for this demographic at over 1.5 billion people.
- What competitive advantages does the company claim?
- The company lists three main advantages on slide 8: a patented technology, an 'easy to use' interface, and a 'unique modular design.' Additionally, slide 4 emphasizes a cost advantage, claiming their energy production cost of 1.5 cents per kWh is nearly 70% cheaper than solar energy and significantly cheaper than standard grid electricity.
- What is missing from the Rainergy pitch deck?
- The deck is missing several critical components for a professional fundraise. There is no 'Ask' slide detailing how much capital they are seeking or what the valuation is. It also lacks a roadmap or timeline for manufacturing and distribution. Furthermore, there is no mention of current revenue, pilot programs, or specific details regarding the patent status or filing numbers.