Ladder’s 12-slide pitch deck is a lean, metric-heavy presentation that secured a $100M Series D in 2021. Rather than dwelling on the basic mechanics of life insurance, the deck positions the company as a high-growth technology platform with a significant data advantage. Key highlights include a 4.5x year-over-year growth rate and a highly efficient 5.2x LTV/CAC ratio. The narrative shifts from a simple consumer interface to a complex 'under the waterline' technology story, centered on their proprietary Ladder Longevity Score. By showcasing a team with deep roots in both big tech (Google, Drop…
Key takeaways
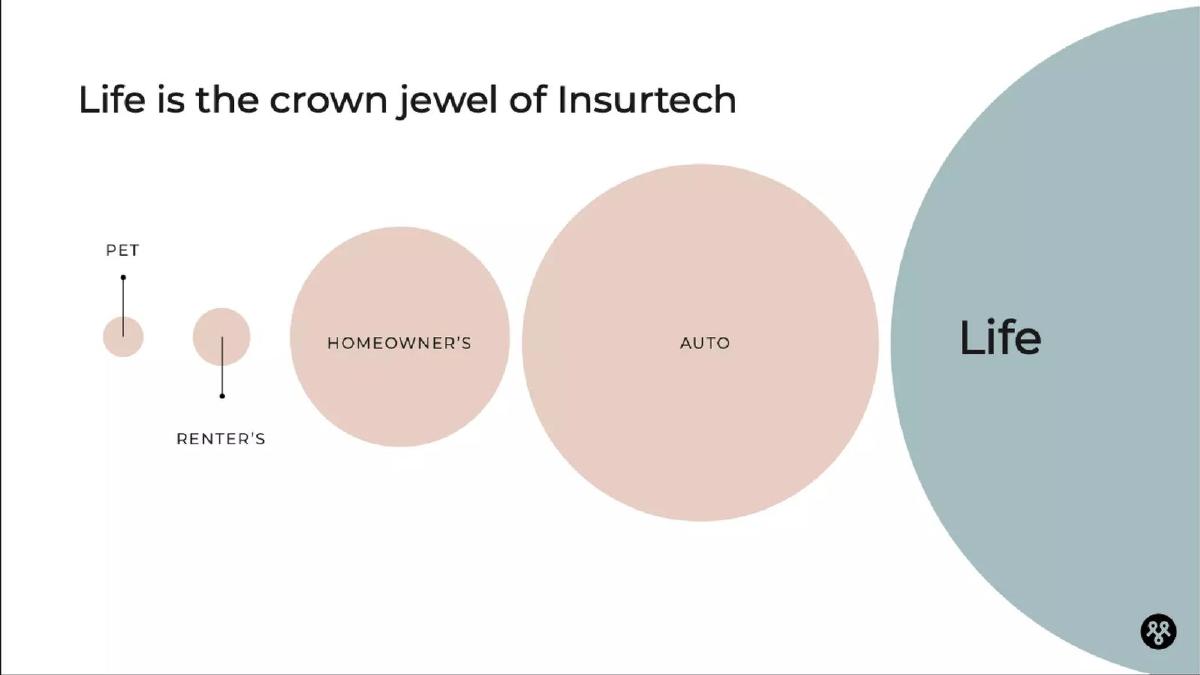
- Ladder identifies life insurance as the 'crown jewel' of Insurtech due to its massive market size relative to pet, renter's, or auto insurance on slide 3.
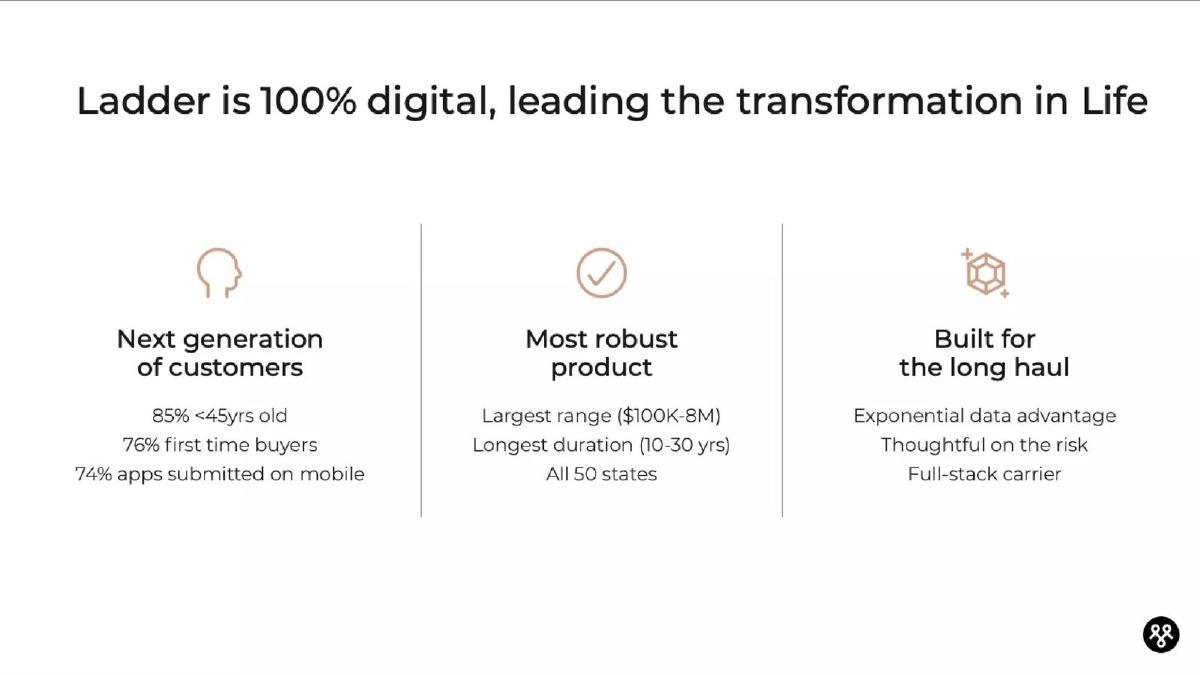
- The platform targets a younger demographic, with 85% of customers under 45 years old and 76% being first-time buyers as stated on slide 4.
- Mobile adoption is high, with 74% of applications submitted via mobile devices according to slide 4.
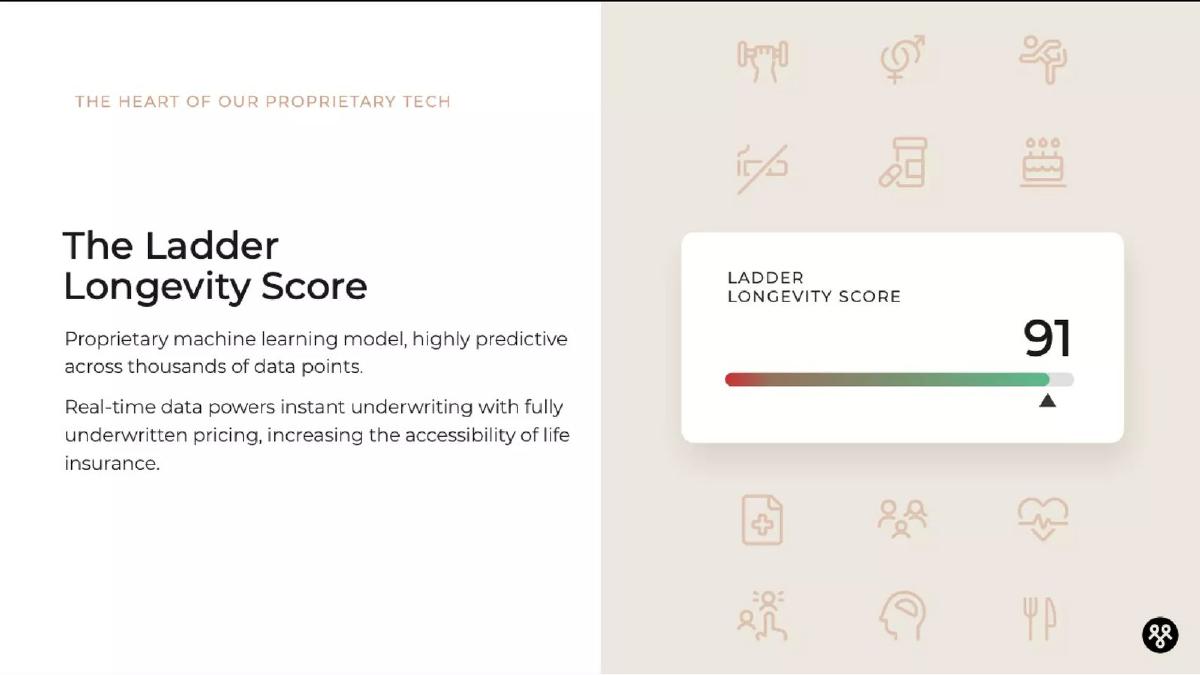
- The company differentiates its technology through the 'Ladder Longevity Score,' a proprietary machine learning model predictive across thousands of data points on slide 6.
- Ladder utilizes a B2B2C strategy via embedded insurance APIs, covering calculators, quotes, and instant coverage as shown on slide 7.
- The company claims a Net Promoter Score (NPS) of 82, significantly higher than the industry average of 26 for life insurance on slide 8.
- Retention is exceptionally high for a consumer product, reaching 97% by Year 3 as illustrated on slide 9.
- Financial efficiency is a core pillar, with the deck reporting a 5.2x LTV/CAC ratio and 4.5x Y/Y growth on slide 11.
Executive Summary: The Series D Power Play
Ladder’s 12-slide deck is a masterclass in brevity for late-stage fundraising. By the time a company reaches a Series D, the 'problem' is usually well-understood by the market. Consequently, Ladder spends very little time explaining why life insurance is broken and instead focuses on why their specific machine-learning engine is the winning solution. The deck, used to raise $100M in 2021, leans heavily on three pillars: massive market opportunity, proprietary data moats, and elite unit economics.
Slide 1: Title Slide
The deck opens with a minimalist title slide featuring only the Ladder logo and name. There is no tagline or mission statement here, relying on the brand's established presence in the fintech space by 2021.
Slide 2: The Vision Statement
Slide 2 establishes the company's core identity: "Ladder is building the next-gen life insurance company." It claims to have transformed every step of the value chain, from economics to consumer attraction. The visual includes a smartphone mockup showing a "You're approved!" screen for an $800,000 policy, emphasizing the speed and digital-native nature of the product.
Slide 3: Market Size and Opportunity
Titled "Life is the crown jewel of Insurtech," this slide uses a bubble chart to compare market sizes. Life insurance is depicted as a massive blue orb, dwarfing Pet, Renter's, Homeowner's, and Auto insurance. This slide serves to justify the large check size ($100M) by showing that the ceiling for growth is significantly higher than in other insurtech sub-sectors.
Slide 4: Customer Demographics and Product Reach
This slide breaks down the "Next generation of customers." Key figures include: 85% <45yrs old , 76% first time buyers , and 74% apps submitted on mobile . It also highlights product robustness, noting a range of $100K to $8M, durations of 10-30 years, and availability in all 50 states. Finally, it mentions their status as a "Full-stack carrier," a critical distinction for investors that means Ladder manages its own risk rather than just acting as a lead-gen front-end.
Slide 5: The Technology Split
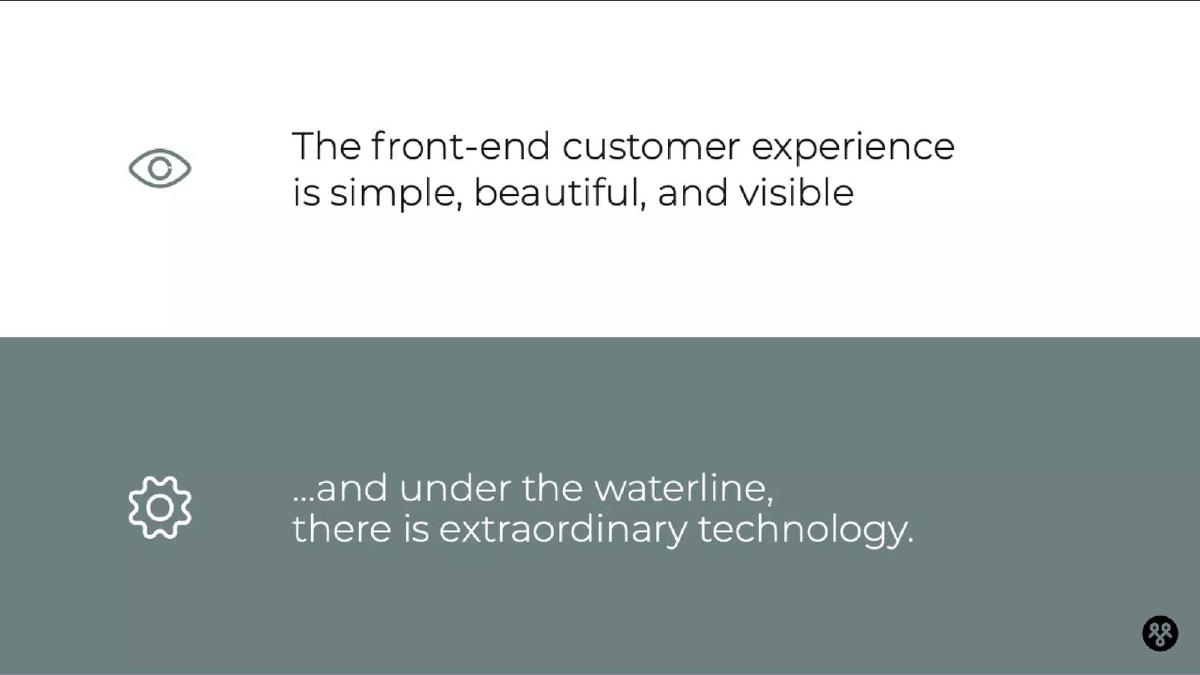
This is a conceptual slide that divides the company into two parts. The top half describes the front-end experience as "simple, beautiful, and visible." The bottom half, "under the waterline," claims there is "extraordinary technology." This sets the stage for the technical deep dive on the following slide.
Slide 6: The Ladder Longevity Score
This slide introduces the "Heart of our proprietary tech." The Ladder Longevity Score is described as a machine learning model predictive across thousands of data points. The slide claims this powers "instant underwriting with fully underwritten pricing," which is the core technical differentiator from traditional insurers who often require medical exams and weeks of manual review.
Slide 7: Embedded Insurance and APIs
Ladder demonstrates its B2B2C potential here. The slide shows a suite of end-to-end APIs for Calculators, Quotes, Applications, Instant Coverage, and Admin. To the right, a snippet of JSON code illustrates a POST request to their API, signaling to investors that Ladder is a developer-friendly platform capable of being integrated into other financial services apps.
Slide 8: Customer Satisfaction (NPS)
This slide uses a comparative chart to show a Net Promoter Score (NPS) of 82 . It benchmarks this against Netflix (68), Apple (68), Amazon (62), and Spotify (54). Most importantly, it contrasts its 82 against the traditional Life Insurance industry average of 26, suggesting a vastly superior user experience.
Slide 9: Retention Metrics
Titled "They stay with us," this bar chart shows retention by cohort. The numbers are exceptionally high for a consumer fintech product: 93% in Year 1 , 96% in Year 2 , and 97% in Year 3 . This indicates a very low churn rate, which is vital for the long-term profitability of an insurance book.
Slide 10: The Data Flywheel
This slide illustrates a virtuous cycle: "Delight customers" leads to "Grow & collect more data," which allows them to "Harness machine learning," which in turn delights more customers. It’s a standard flywheel graphic intended to show how Ladder’s lead over competitors widens as they scale.
Slide 11: Growth and Unit Economics
This is the 'money slide.' It shows a bar chart of growth from 2017 to 2020, highlighting a 4.5x Y/Y growth rate. In a call-out box, it lists an LTV/CAC of 5.2x . For a Series D company, a 5.2x ratio is highly efficient, suggesting that for every dollar spent on marketing, they are generating five dollars in lifetime value.
Slide 12: The Team
The final slide showcases a 12-person leadership team. It balances tech giants (Google, Dropbox, AdMob) with academic prestige (Harvard, Stanford, Wharton) and deep industry expertise (Pacific Life, Old Mutual). Notably, it includes a dedicated Actuarial lead (Liam Monaghan), which is essential for a full-stack carrier to prove they can accurately price risk.
What Ladder Does Well
Ladder excels at translating a complex, regulated industry into a high-growth tech narrative. By focusing on the "Longevity Score" and the API suite, they move the conversation away from "selling insurance" and toward "building a data platform." The inclusion of the LTV/CAC ratio (5.2x) on slide 11 is a brilliant move; it provides a concrete efficiency metric that justifies aggressive capital infusion. Furthermore, the comparison of their NPS against Apple and Netflix rather than just other insurance companies positions them as a lifestyle tech brand rather than a boring financial utility.
What is Missing from the Deck
As a Series D deck, there are several omissions that would be fatal in a Seed or Series A deck but are common at this stage. First, there is no 'Ask' slide . There is no mention of the $100M target or how the funds will be allocated between marketing, R&D, or capital reserves. Second, there is no competitive landscape . Ladder assumes the investors know the other players (like Ethos or Haven Life) and chooses to focus entirely on their own internal metrics. Finally, there is no detailed financial projection or path to profitability, which is often handled in a separate data room at this stage of maturity.
Founder's Takeaway: Copy the 'Waterline' Strategy
Founders in complex industries (Healthtech, Fintech, Edtech) should study Slide 5. The "above and below the waterline" concept is a powerful way to explain why a simple-looking app is actually a defensible business. By acknowledging that the front-end is just the tip of the iceberg, you prime investors to value your proprietary backend, data models, and regulatory licenses. Additionally, if you have a high LTV/CAC, make it a focal point. In a Series D environment, growth is expected, but efficient growth is what drives premium valuations.
Frequently asked questions
- What is the primary value proposition Ladder presents to investors?
- Ladder positions itself as a 'full-stack carrier' that has transformed the entire life insurance value chain. The deck emphasizes that while the front-end is simple, the 'extraordinary technology' underneath—specifically their proprietary machine learning models—allows for instant underwriting and superior unit economics, such as a 5.2x LTV/CAC.
- How does Ladder demonstrate market fit and customer satisfaction?
- Ladder uses two primary metrics: NPS and retention. Slide 8 shows an NPS of 82, which it compares favorably against tech giants like Apple (68) and Netflix (68), and traditional life insurance (26). Slide 9 shows that customer retention actually improves over time, moving from 93% in Year 1 to 97% in Year 3.
- What is the 'Ladder Longevity Score' mentioned in the deck?
- It is a proprietary machine learning model described on slide 6. It processes thousands of data points in real-time to power instant underwriting. This allows Ladder to offer fully underwritten pricing immediately, rather than the weeks-long process typical of traditional insurance, creating a significant competitive advantage in speed and accessibility.
- Who is the target audience for Ladder's product according to the slides?
- Ladder is successfully capturing the 'next generation' of insurance buyers. Slide 4 notes that 85% of their users are under 45, and 76% are first-time life insurance buyers. This suggests they are not just stealing market share but expanding the market by making insurance accessible to a younger, mobile-first demographic.
- What is missing from the Ladder Series D pitch deck?
- The deck is notably missing a specific 'Ask' slide detailing how the $100M will be spent. It also lacks a detailed competition slide, a formal balance sheet, or a roadmap of future product features. As a Series D deck, it relies heavily on established traction and team pedigree rather than explaining the basic business model.