Troy Medicare’s 17-slide Series B deck focuses on a specific, high-leverage distribution advantage: the independent pharmacy. By positioning the local pharmacist as the primary care manager, Troy Medicare claims to bypass the massive advertising and broker costs that plague incumbents like UnitedHealthcare and Humana. The deck provides a clear breakdown of 'The Fat' in traditional Medicare Advantage—citing that marketing and brokers account for 70% of non-medical expenses—and counters it with a $0 CAC model proven by their first 250 members. With a leadership team boasting deep exits in healt…
Key takeaways
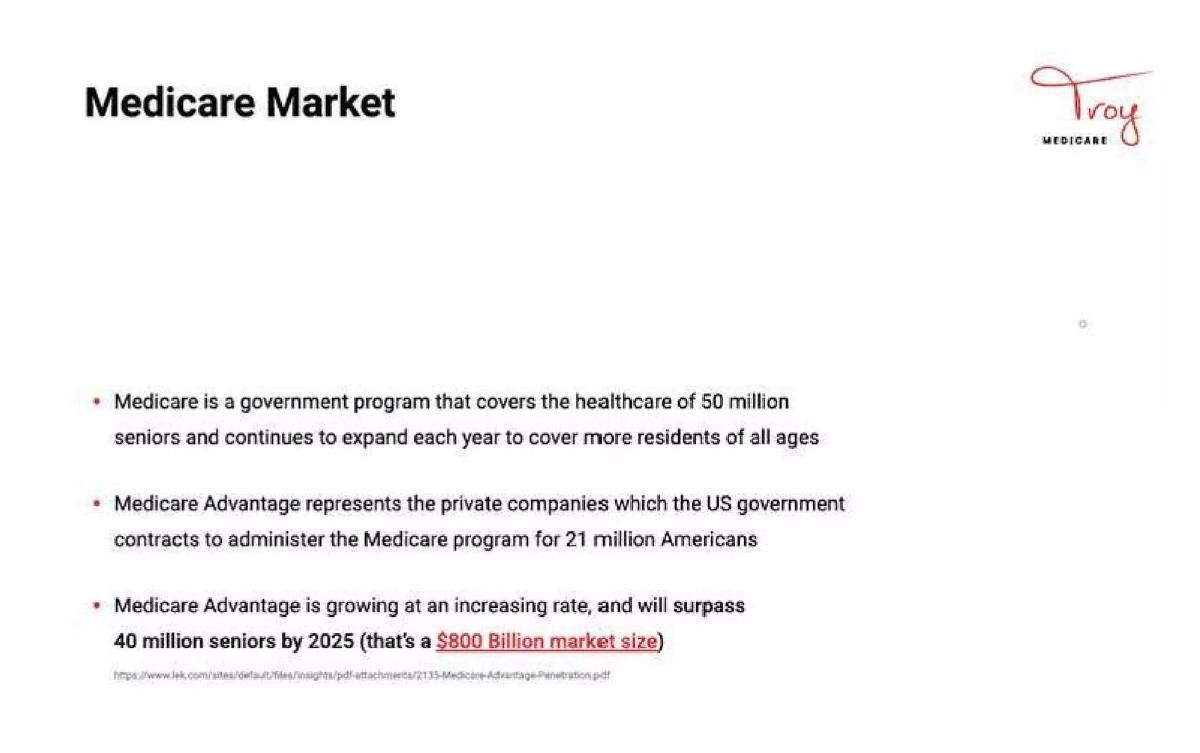
- Medicare Advantage is projected to surpass 40 million seniors by 2025, representing an $800 billion market size (Slide 3).
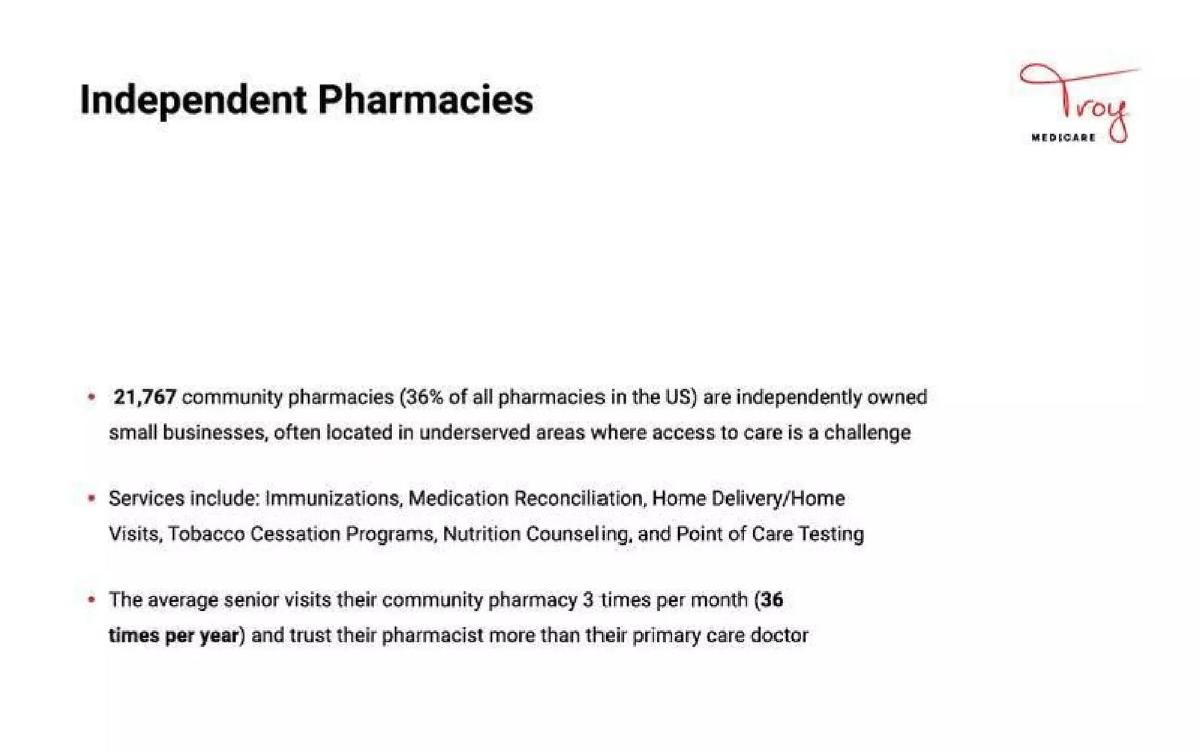
- Independent pharmacies represent 36% of all U.S. pharmacies, often located in underserved areas where seniors visit 36 times per year (Slide 4).
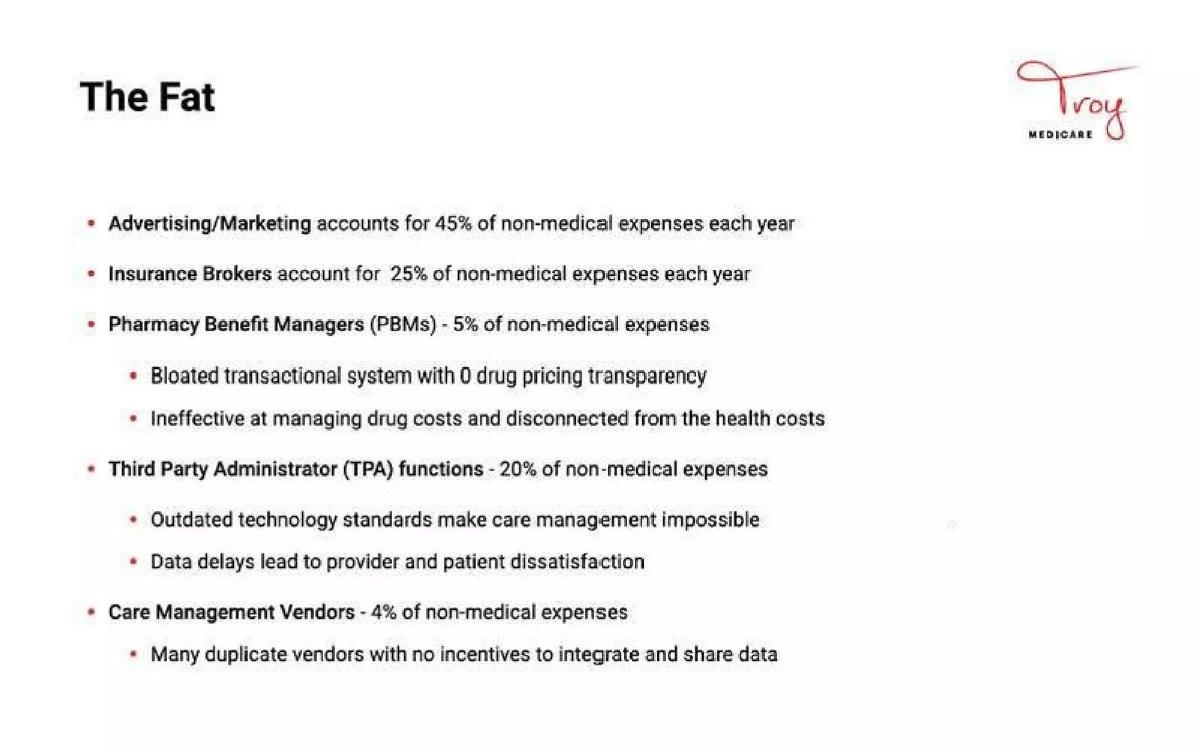
- Incumbent non-medical expenses are dominated by advertising (45%) and insurance brokers (25%), which Troy Medicare aims to eliminate (Slide 6).
- The company claims a customer acquisition cost (CAC) that is 20 times lower than the competition (Slide 7).
- Troy Medicare reached $3 million in ARR by January 2020 after enrolling its first 250 members at $0 CAC (Slide 8).
- Actuarial projections estimate EBITDA will turn positive in 2021 ($284,368) and reach $33.4 million by 2026 (Slide 9).
- The plan features $0 premiums, $0 deductibles, and $0 primary care visits to attract members (Slide 12).
- The leadership team includes the former CEO of iMedicare, which facilitated enrollment for over 1 million seniors (Slide 14).
Introduction: The Pharmacy-First Insurance Model
Troy Medicare’s Series B pitch deck is a masterclass in identifying a specific inefficiency in a massive market and proposing a structural solution. In the world of Medicare Advantage, where incumbents spend billions on television ads and broker commissions, Troy Medicare argues that the local pharmacy is an untapped, high-trust distribution node. The deck, used in 2019 to facilitate a significant funding round, relies heavily on actuarial data and a clear 'us vs. them' narrative regarding cost structures.
Slides 1-3: The Market Opportunity
The deck opens with a minimalist title slide (Slide 1) and a bold mission statement: "Troy Medicare removes the fat in the Medicare healthcare program" (Slide 2). This sets the tone for a deck focused on efficiency. Slide 3 defines the Medicare Market , noting that the program covers 50 million seniors. Crucially, it highlights that Medicare Advantage—the private arm of the program—is growing rapidly and is expected to surpass 40 million seniors by 2025, creating an $800 Billion market size . By citing a specific L.E.K. Consulting report, the founders establish immediate credibility regarding the TAM (Total Addressable Market).
Slides 4-6: The Problem and the Competition
Slide 4 introduces the Independent Pharmacies segment. The deck notes there are 21,767 community pharmacies in the US (36% of the total), often serving underserved areas. The key metric here is frequency: the average senior visits their pharmacy 36 times per year, compared to just 3 visits to a primary care doctor. This frequency is the foundation of Troy's distribution strategy.
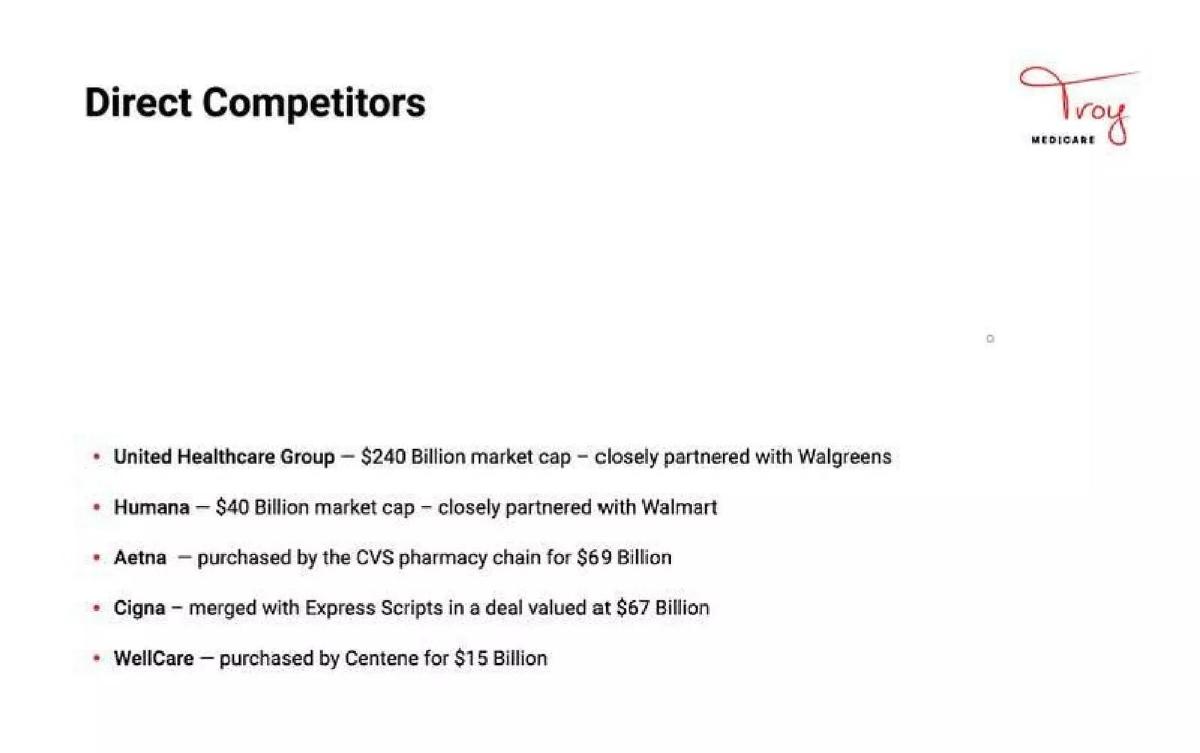
Slide 5 lists Direct Competitors , including United Healthcare, Humana, Aetna, Cigna, and WellCare. Rather than just listing names, the slide includes market caps and recent M&A activity (e.g., Aetna’s $69 billion purchase by CVS). This frames the industry as one of massive scale but also massive consolidation. Slide 6, titled 'The Fat,' is perhaps the most important slide in the deck. It breaks down non-medical expenses for incumbents: 45% for Advertising/Marketing, 25% for Insurance Brokers, 20% for Third Party Administrators (TPAs), and 5% for Pharmacy Benefit Managers (PBMs). By quantifying 'the fat,' Troy Medicare sets up its solution as a mathematical inevitability.
Slides 7-9: The Solution and Traction
'Enter Troy Medicare' (Slide 7) positions the company as the only one combining data science with the trust of local pharmacies. It claims an 'unfair competitive advantage' of a Customer Acquisition Cost (CAC) 20 times lower than the competition . Slide 8, 'Troy Medicare is Live and Proven,' provides a timeline of regulatory and operational milestones. Notably, it mentions receiving approval from the Center for Medicare and Medicaid Services (CMS) in July 2019 and enrolling 250 members at $0 CAC by October 2019. The slide concludes with a claim of surpassing $3 million in ARR by January 2020.
Slide 9 presents the Actuarial Financials . This table is dense but vital for an insurance startup. It shows a leap from 400 members in 2020 to nearly 25,000 by 2026. It also tracks 'Capital Reserves,' a regulatory requirement for insurance companies, showing a need for $78.4 million in reserves by 2026. This slide demonstrates that the founders understand the heavy capital requirements of their industry.
Slides 10-13: The Product and Expansion
Slides 10 through 12 dive deeper into the mechanics of their 'Unfair Distribution' and 'Unique Care Management.' Slide 11 explains that every member is assigned a local pharmacy care manager who meets them in-person monthly. This is a high-touch model that would be impossible for a national carrier without Troy's localized pharmacy network. Slide 12 details the Data-driven Benefit Design , which includes $0 premiums, $0 deductibles, and $0 primary care visits. This 'zero-dollar' plan is the standard hook for Medicare Advantage, but Troy claims their 100% transparent drug pricing is a first for the industry.
Slide 13 outlines Geographic Expansion . The company plans to expand to 13 more counties in North Carolina in 2020, with meetings already underway with insurance departments in South Carolina, Virginia, and Tennessee. This shows a clear, phased roadmap for scaling beyond their initial pilot market.
Slides 14-16: The Leadership Team
The leadership section is spread across three slides (14, 15, and 16), emphasizing the depth of the team. CEO Flaviu Simihaian’s background with iMedicare is a highlight, as it proves he has already built a successful business serving the exact pharmacy network Troy relies on. The team includes a mix of clinical experts (Dr. Bader Almosheli), technical leaders (Lateef Jackson, formerly of New Relic), and insurance veterans (Michael Cutroni, formerly of MDWise and Universal American). The inclusion of an Actuary (Steve Kaczmarek) and a Chairman with deep ACO (Accountable Care Organization) experience (Jeff Spight) signals to investors that the company is prepared for the complex regulatory environment of healthcare payers.
Slide 17: The Ask
The final slide, Fundraising and Timeline , is direct. It notes that $10.2 million was already raised from pharmacy owners and providers—a strong signal of industry buy-in. The current ask is for $25 million , which the company expects will enable them to reach $113 million in ARR within 18 months . This is a clear, metric-driven conclusion that ties the funding directly to a revenue milestone.
What Works in This Deck
The 'Fat' Breakdown: By explicitly stating that 70% of non-medical costs go to marketing and brokers, the deck makes the case for disruption based on math rather than just 'better technology.' · Distribution as a Moat: The focus on the 36 visits per year to a pharmacist is a compelling 'aha' moment. It identifies a high-frequency touchpoint that incumbents have largely ignored in favor of TV ads. · Regulatory Credibility: Mentioning CMS approval and state insurance licenses (Slide 8) is essential for this sector. Without these, the rest of the deck is theoretical. · Founder-Market Fit: The CEO’s previous company, iMedicare, is the perfect precursor to this venture. It shows he already has the relationships with the 21,000+ independent pharmacies mentioned in the deck.
What Is Missing From This Deck
Unit Economics Detail: While the deck mentions $0 CAC, it doesn't provide a detailed breakdown of the Life Time Value (LTV) or the specific margins per member after medical loss ratios (MLR) are accounted for. · Technology Screenshots: The deck mentions 'modern data science techniques' and 'technology tools' multiple times, but never shows the actual interface or dashboard that the pharmacists or patients use. · Risk Factors: Medicare Advantage is highly sensitive to changes in government reimbursement rates and 'Star Ratings.' The deck does not address how it will maintain high quality scores to ensure maximum CMS payments. · Churn/Retention Data: Although it claims 'much higher retention' on Slide 10, it doesn't provide the actual churn rates from their initial 250-member pilot.
What a Founder Should Copy
The Competitive Comparison: Instead of a standard feature-comparison grid, Slide 5 uses market caps and partnerships to show the scale of the problem. This is very effective for Series B decks. · The Actuarial Table: If you are in a capital-intensive industry (insurance, fintech, hardware), a detailed multi-year projection table like Slide 9 is mandatory to show you understand your capital requirements. · Specific Sourcing: Using footnotes to cite sources like L.E.K. Consulting (Slide 3) adds a layer of professional rigor that helps during due diligence. · Phased Expansion: Slide 13 shows a logical progression from one county to multiple states. It demonstrates ambition tempered by the reality of regulatory hurdles.
Frequently asked questions
- What is Troy Medicare's core value proposition?
- Troy Medicare operates as a pharmacy-powered Medicare Advantage company. Its core proposition is to replace expensive, impersonal marketing and broker networks with the trusted, high-frequency relationship seniors have with their local independent pharmacists. By providing pharmacists with data tools to act as care managers, they improve patient outcomes while drastically reducing the cost of acquiring and maintaining members.
- How does Troy Medicare achieve a $0 Customer Acquisition Cost?
- According to slide 10, the company leverages a 'free pharmacy distribution channel.' Because seniors visit their community pharmacy an average of 36 times per year and trust their pharmacist more than their primary care doctor, Troy Medicare uses word-of-mouth and pharmacist recommendations to enroll members. This bypasses the 45% of non-medical expenses incumbents typically spend on advertising and the 25% spent on broker commissions.
- What are the financial projections for the company?
- Slide 9 outlines an aggressive growth trajectory. Starting from $0 revenue in 2019, the company projected $4.5 million in 2020, scaling to $497.3 million by 2026. While they projected losses in 2019 and 2020 due to capital reserve requirements and startup costs, they expected to reach EBITDA profitability in 2021 with 2,085 members enrolled.
- Who are the primary competitors identified in the deck?
- Slide 5 lists major incumbents: United Healthcare Group ($240B market cap), Humana ($40B market cap), Aetna (purchased by CVS for $69B), Cigna (merged with Express Scripts for $67B), and WellCare (purchased by Centene for $15B). The deck highlights these competitors' reliance on big-box retail partnerships (Walgreens, Walmart, CVS) to contrast with Troy's independent pharmacy focus.
- What is the background of the leadership team?
- The team is highly specialized. CEO Flaviu Simihaian previously led iMedicare, a SaaS platform used by 6,000+ pharmacies. The team includes a former Deputy US Marshal as Chief Compliance Officer, a former President of an ACO business as Chairman, and a leading Medicare actuary. This mix of software engineering, regulatory compliance, and actuarial science is designed to de-risk the complex insurance model.