ARPU in a Pitch Deck Revenue Model: Measured, Borrowed
How startups use ARPU (average revenue per user) to build revenue on a pitch deck: whether the ARPU is measured or assumed, who counts as a user.
How to Use ARPU in Your Pitch Deck Revenue Model So Users × ARPU = Revenue
Fourteen slides from real pitch decks that use average revenue per user, or per account, to build a revenue figure: a measured ARPU from the business, an ARPU borrowed from another company, or an ARPU assumed for a forecast. For each, we record where the ARPU comes from, who counts as a user, the period, and whether users multiplied by ARPU gives the revenue on the slide.
TL;DR
ARPU is revenue divided by users over a period. On a pitch deck it usually does one of two jobs: it reports how much the company earns from each user today, or it is the multiplier in a forecast (users × ARPU = revenue). Investors check three things: where the ARPU came from (measured from the company's own revenue, borrowed from a comparable company, or assumed), what counts as a user (every registered user, active users, paying users or accounts), and the period (a monthly and a yearly ARPU differ by twelve times). Then they multiply it out.
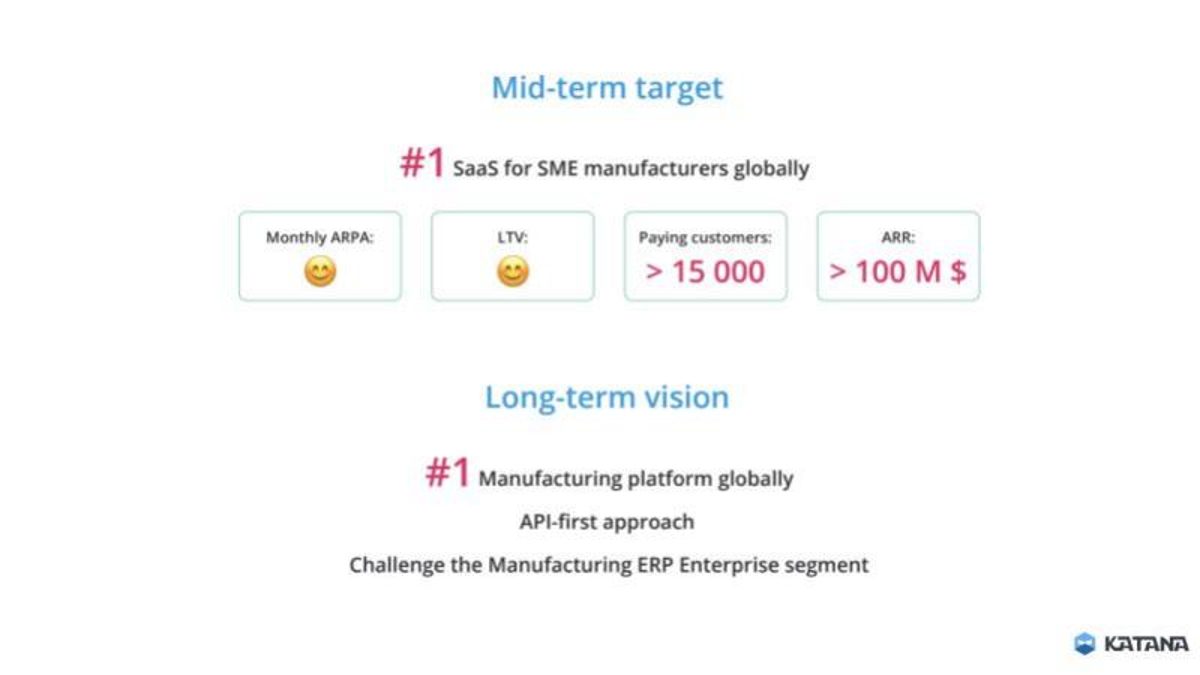
In this set, Nextdoor defines its ARPU in a footnote and its bridge adds up exactly; WhiteHat Jr shows measured ARPU against plan, which reveals that it beat its revenue plan with fewer paying customers than planned (our calculation); Knime's 400 customers at about 80k€ come close to its 30m€ ARR; Comfortway gives a measured ARPU with its period. Honey labels its ARPU as borrowed from Ebates. The problems: Dario Health's three revenue lines imply three different ARPUs, none equal to the $30 its footnote states; Bettery's $15 ARPU does not follow from its own daily assumption; Farm Cloud's poultry connector count cannot be rebuilt from its inputs; Bunch applies one $129 ARPU to 2.6 billion professionals; and Katana replaces its target ARPA with an emoji.
ARPU in revenue models from real pitch decks
Each example records the exact slide, the ARPU it states, where the ARPU comes from, and whether users times ARPU gives the revenue shown. Checks and implied figures are our calculations.
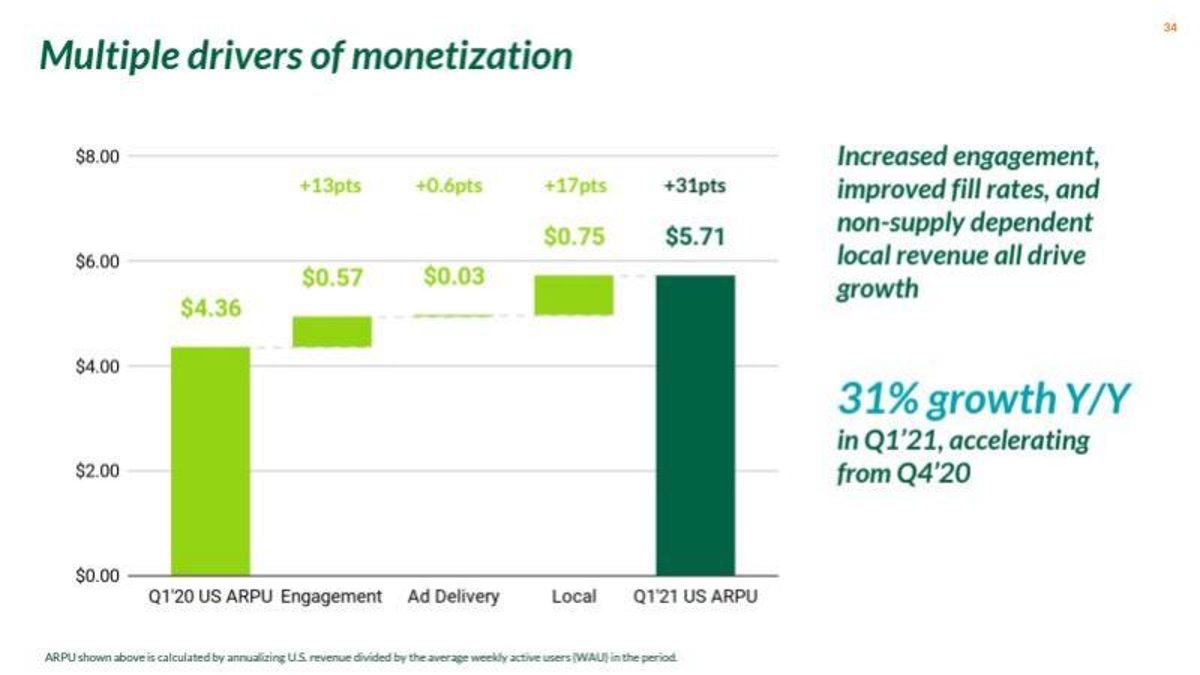
Nextdoor business model slide — slide 33
Neighborhood network. Monetization slide.
Nextdoor deck, slide 33. Exact stored slide matched to this analysis.
Our analysis: Measured ARPU with user, period, geography and drivers defined.
Evidence and limitation: Our checks: the steps add to $5.71; growth is 31%; the step percentages match.
What a founder can adapt: Use a bridge to explain what moved your ARPU.
Supporting analysis
What the deck claims: Q1'20 US ARPU $4.36 + engagement $0.57 + ad delivery $0.03 + local $0.75 = Q1'21 US ARPU $5.71; "31% growth Y/Y"; footnote: annualized US revenue divided by average weekly active users.
Presentation choice: Every step can be added and divided back.
When it does not fit: Don't show ARPU growth without saying which users are counted.
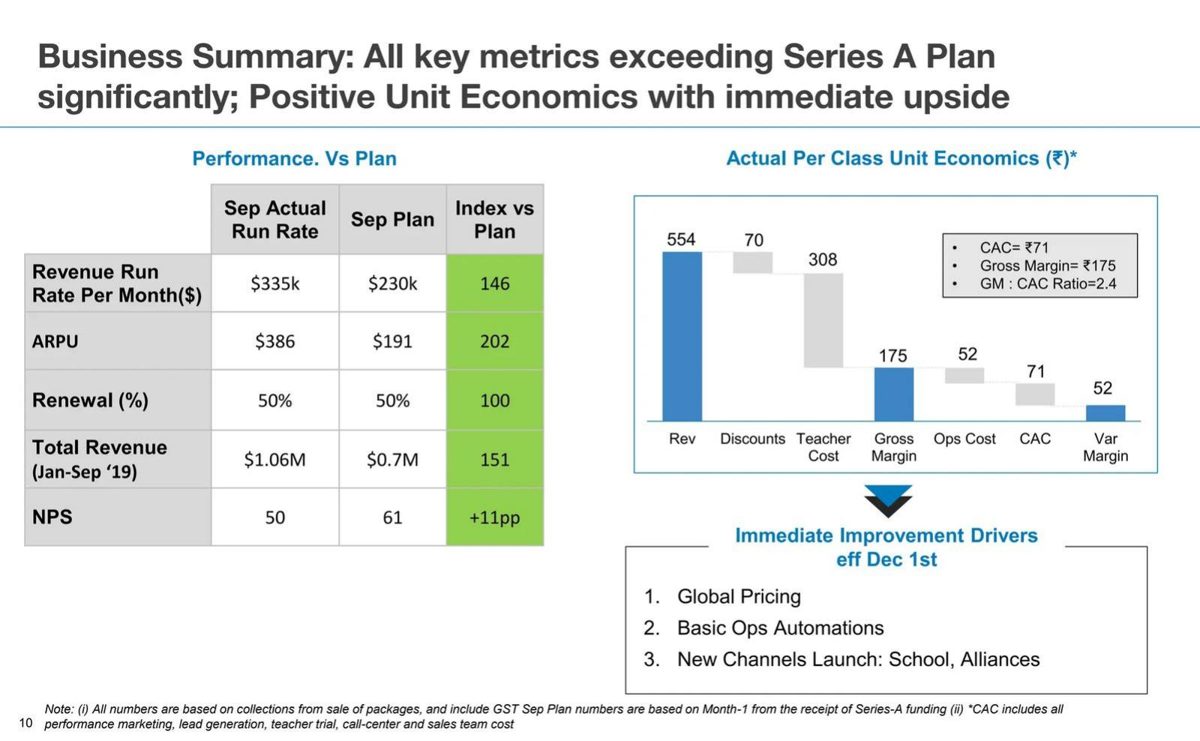
Online coding classes. Business summary against Series A plan.
WhiteHat Jr deck, slide 10. Exact stored slide matched to this analysis.
Our analysis: Revenue beat plan through price, not customer count.
Evidence and limitation: Our calculations: about 870 paying customers implied vs about 1,200 in plan.
What a founder can adapt: Show paying customers beside ARPU and state the ARPU period.
Supporting analysis
What the deck claims: Revenue run rate per month $335k vs $230k plan; ARPU $386 vs $191 (index 202); renewal 50% vs 50%; NPS 50 vs 61 labelled "+11pp"; figures based on collections including GST.
Presentation choice: ARPU next to revenue lets an investor back out the customer count.
When it does not fit: Don't label a below-plan NPS as a gain or collections as revenue.
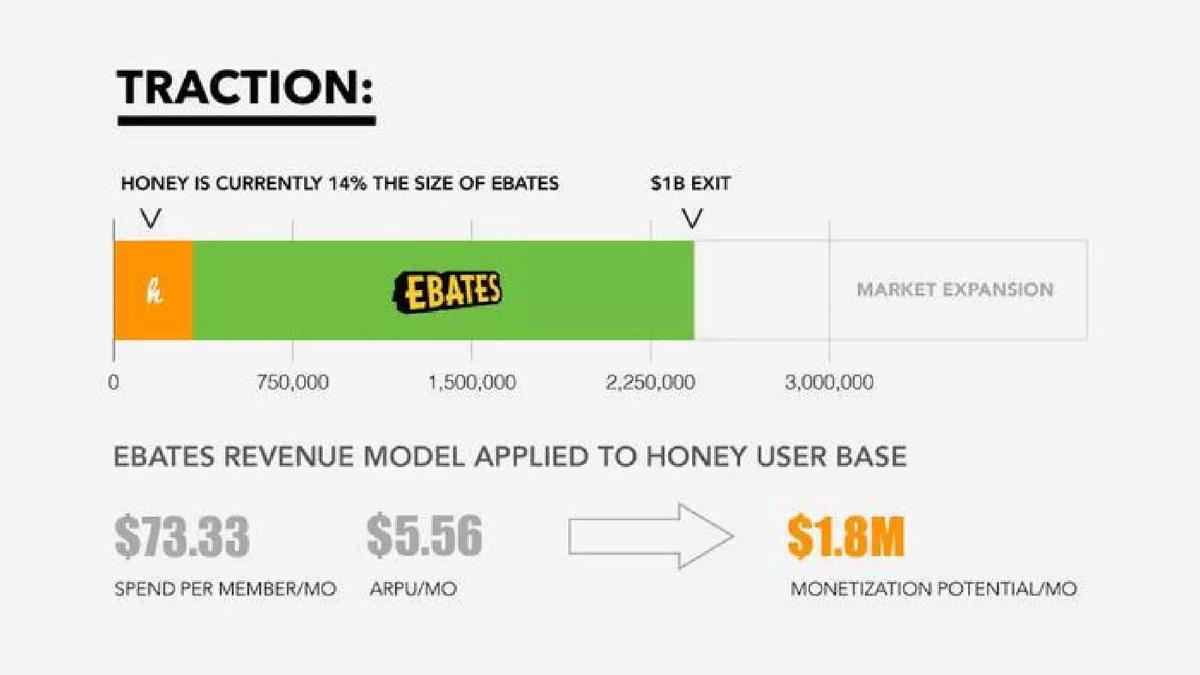
Honey deck, slide 5. Exact stored slide matched to this analysis.
Our analysis: Borrowed ARPU, clearly labelled as potential.
Evidence and limitation: Our calculations: $5.56 is about 7.6% of spend; $1.8M ÷ $5.56 is about 324,000 members, matching 14% of Ebates.
What a founder can adapt: Label any borrowed ARPU and name the source company.
Supporting analysis
What the deck claims: "Honey is currently 14% the size of Ebates"; "Ebates revenue model applied to Honey user base": $73.33 spend per member/mo, $5.56 ARPU/mo, $1.8M monetization potential/mo.
Presentation choice: The reader knows exactly what is borrowed and from whom.
When it does not fit: Don't present a comparable's ARPU as your own revenue.
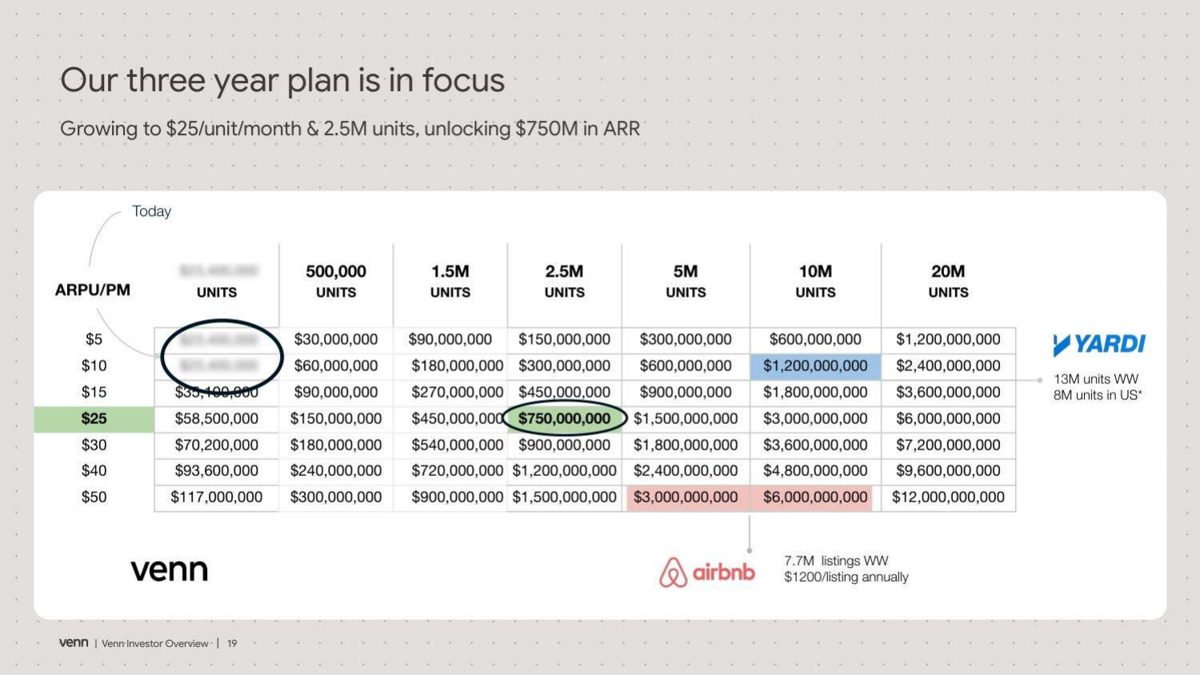
Venn deck, slide 19. Exact stored slide matched to this analysis.
Our analysis: Assumed ARPU with unit, period and arithmetic; today's ARPU not shown.
Evidence and limitation: Our checks: 2.5M × $25 × 12 is $750M; today's row values imply about 195,000 units.
What a founder can adapt: Mark today's ARPU in the grid.
Supporting analysis
What the deck claims: "Growing to $25/unit/month & 2.5M units, unlocking $750M in ARR"; grid of ARPU per month ($5–$50) by units; today's units blurred.
Presentation choice: The grid lets an investor pick any ARPU and unit pair.
When it does not fit: Don't leave it unclear whether the target ARPU is a current price.
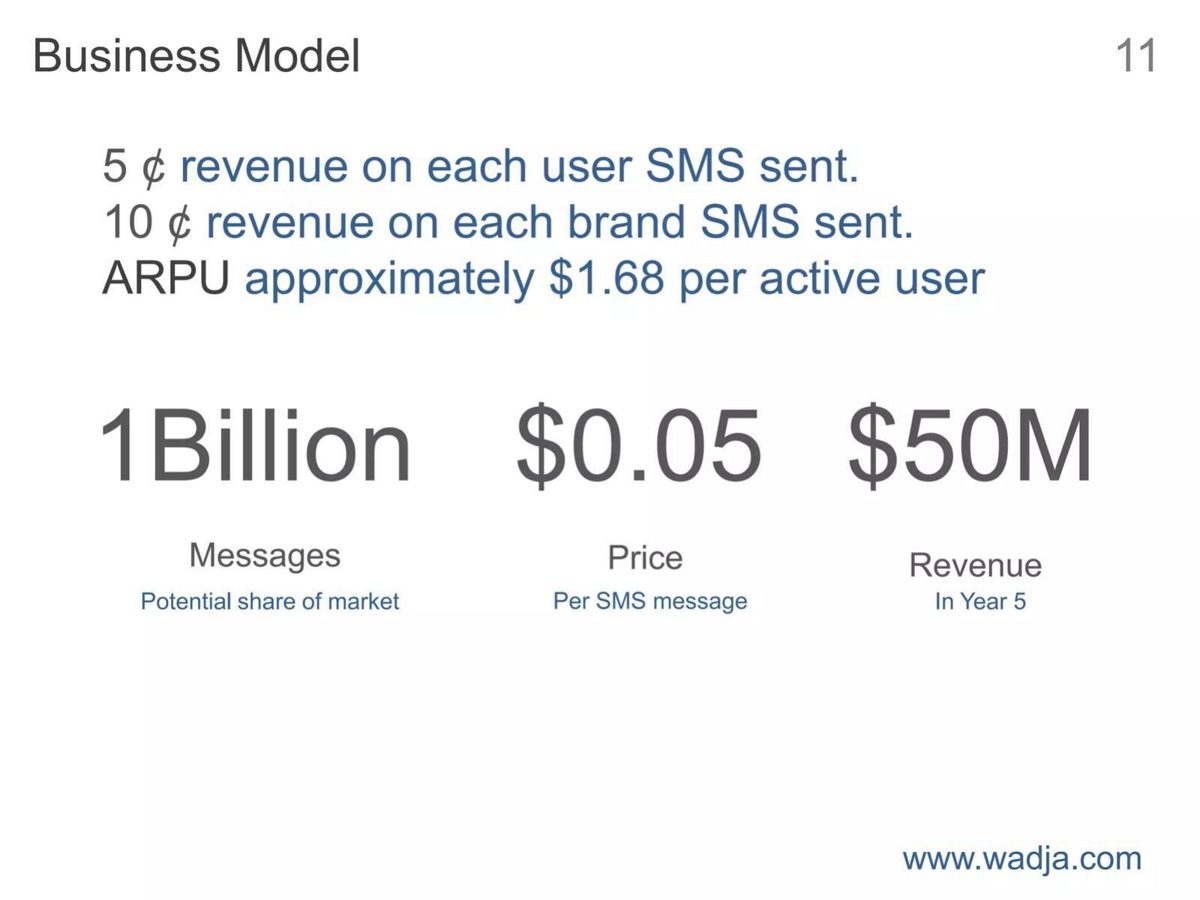
Wadja deck, slide 11. Exact stored slide matched to this analysis.
Our analysis: Two revenue models, never connected; no ARPU period.
Evidence and limitation: Our calculations: $50M holds; $1.68 is about 34 user messages; if yearly, $50M needs about 30M active users.
What a founder can adapt: Build revenue from active users × ARPU and reconcile with messages.
Supporting analysis
What the deck claims: 5¢ per user SMS, 10¢ per brand SMS; "ARPU approximately $1.68 per active user"; 1 billion messages × $0.05 = $50M revenue in year 5.
Presentation choice: The revenue line ignores the ARPU on the same slide.
When it does not fit: Don't state an ARPU the forecast doesn't use.
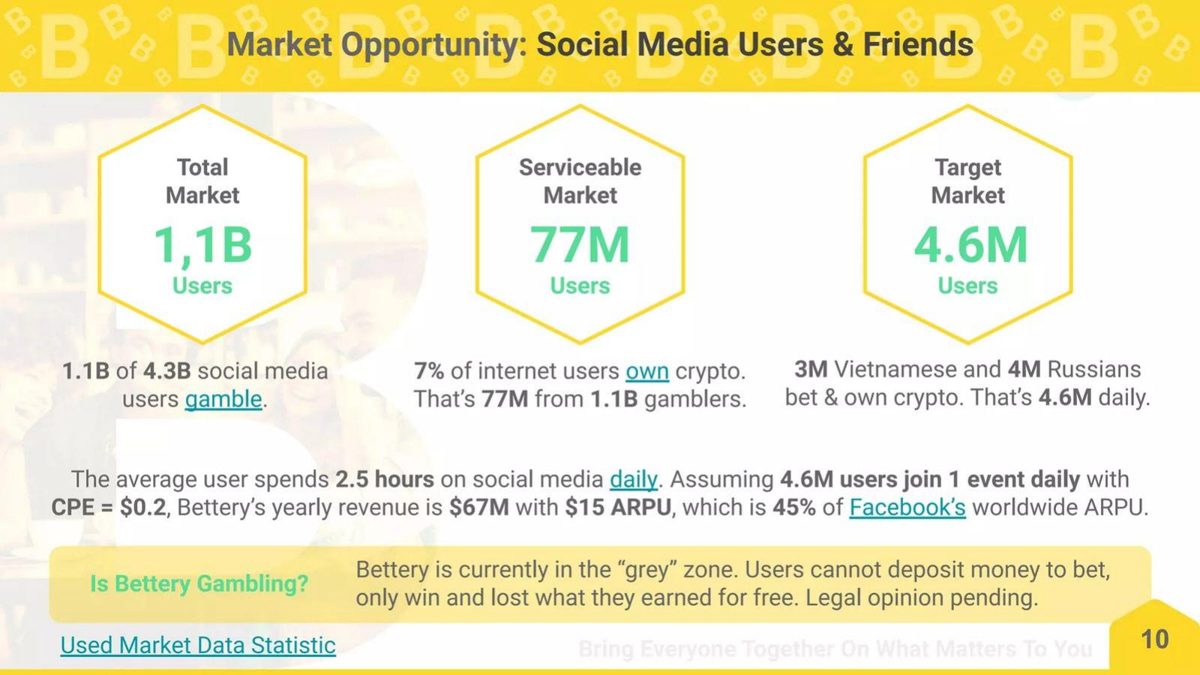
Bettery deck, slide 10. Exact stored slide matched to this analysis.
Our analysis: ARPU matches revenue; the stated usage assumption does not.
Evidence and limitation: Our calculations: $67M ÷ 4.6M is about $14.57; one $0.20 event daily is about $336M a year.
What a founder can adapt: Show events per user per year that produce the ARPU.
Supporting analysis
What the deck claims: "Assuming 4.6M users join 1 event daily with CPE = $0.2, Bettery's yearly revenue is $67M with $15 ARPU, which is 45% of Facebook's worldwide ARPU."
Presentation choice: The daily assumption implies five times the revenue.
When it does not fit: Don't justify ARPU by comparison to a different business.
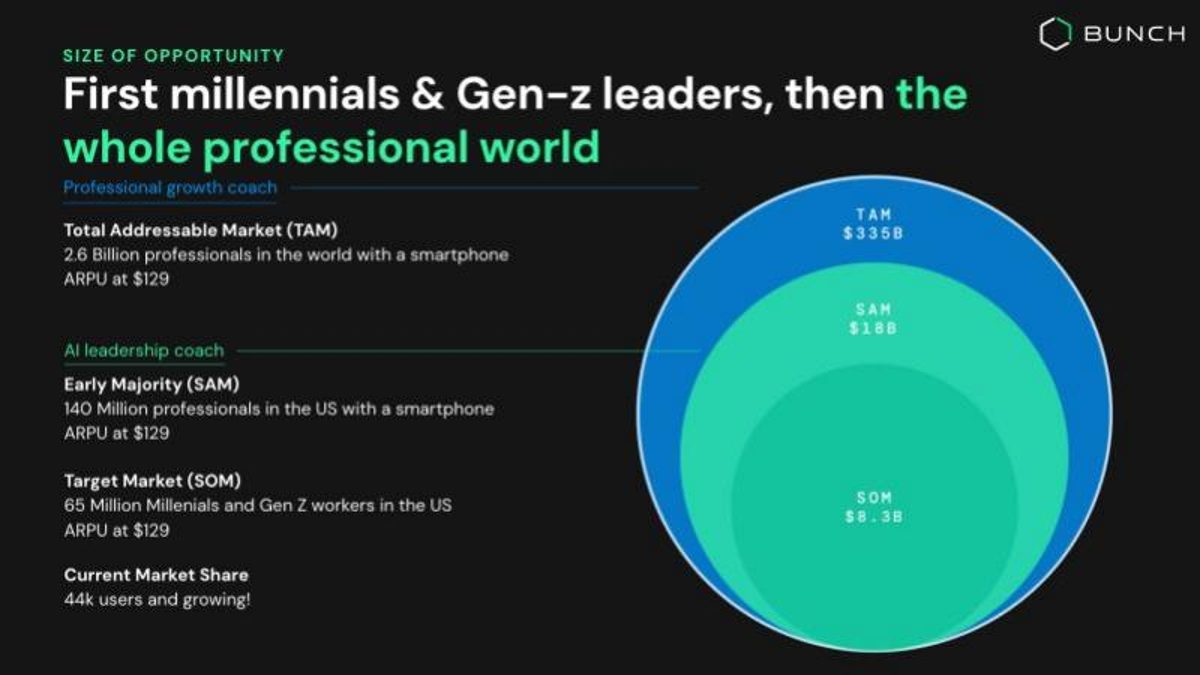
Bunch deck, slide 17. Exact stored slide matched to this analysis.
Our analysis: One assumed ARPU applied worldwide.
Evidence and limitation: Our checks: the circles follow from $129 (SOM about $8.4B); no period; no current ARPU.
What a founder can adapt: Show what current users pay and vary ARPU by market.
Supporting analysis
What the deck claims: TAM 2.6B professionals, SAM 140M US, SOM 65M US millennials and Gen Z, each "ARPU at $129" ($335B, $18B, $8.3B); "48k users and growing!"
Presentation choice: The multiplication holds; the multiplier is unsupported.
When it does not fit: Don't apply a single ARPU to every professional on earth.
Columns report what each slide states or leaves out; checks are our calculations.
Example
ARPU source
User defined
Period
Users × ARPU = revenue
Nextdoor
Measured
Weekly actives
Annualized
Holds
WhiteHat Jr
Measured
Not stated
Not stated
Implies fewer payers than plan
Knime
Measured (ARPA)
Accounts
Annual (ARR)
Holds within rounding
Comfortway
Measured
Customers
Per year
Not shown; about €125k
Honey
Borrowed (Ebates)
Members
Per month
Holds
Legends Studios
Industry
Payers and users
Not stated
Not applicable
Venn
Assumed
Units
Per month
Holds
Farm Cloud
Assumed
Connectors
Per year
Poultry count does not rebuild
Wadja
Assumed
Active users
Not stated
ARPU not used
Dario Health
Assumed
Users
Not stated
Does not hold exactly
Bettery
Assumed
Users
Per year
Usage assumption does not hold
Bunch
Assumed
Professionals
Not stated
Holds; multiplier unsupported
Katana
Hidden
Accounts
Monthly
Implied about $556
api.video
Measured (growth only)
Not stated
2021
Not shown
Key Takeaways
Say where the ARPU comes from: measured, borrowed or assumed. Honey labels its $5.56 as Ebates' model.
Define the user. Nextdoor divides annualized revenue by average weekly active users.
State the period. Comfortway writes "€50+ per year"; Dario Health's $30 has no period.
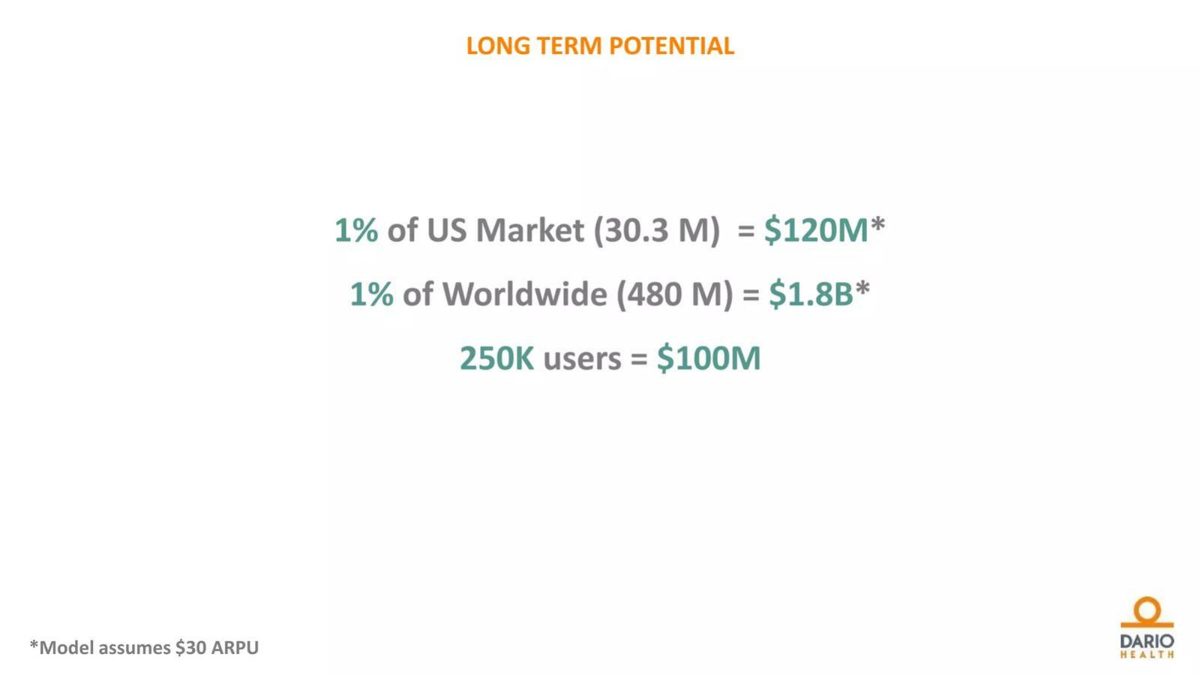
Multiply it out. Dario's $120M, $1.8B and $100M imply three different ARPUs (our calculation).
Show ARPU next to user counts. WhiteHat Jr's ARPU beat plan while paying customers fell short (our calculation).
Don't hide the target. Katana's monthly ARPA box holds an emoji; the implied figure is about $556 (our calculation).
Build your ARPU line
Fill in each field and check that the numbers multiply both ways.
Source. Is the ARPU measured, borrowed or assumed?
User. Registered, active, paying users, or accounts?
Period. Per month or per year?
Revenue. Users × ARPU = what revenue?
Check. Revenue ÷ users = the ARPU you stated?
Bridge. If the forecast ARPU is higher than today's, what changes?
Copyable framework: [Measured/assumed] ARPU of [amount] per [month/year] per [user type] × [users] = [revenue]. Today's ARPU is [amount]; the change comes from [driver].
After: 250,000 users × $30 a month × 12 = $90M a year (assumed ARPU; today's is [X]).
What improved: Makes Dario Health's line multiply through and states the period.
What ARPU does on a pitch deck
Average revenue per user is revenue for a period divided by the number of users in that period. The deal-size guide covers how to label ARPU, ACV and average order value; this guide is about ARPU as a building block of the revenue story. A deck uses it either to report a result ("ARPU: €50+ per year") or as the multiplier in a projection ("250K users = $100M", which assumes an ARPU of $400 a year). In both uses the figure only means something if the reader knows three things.
First, the source. A measured ARPU comes from the company's own revenue and user counts. A borrowed ARPU is taken from another company or industry report and applied to the startup's users. An assumed ARPU is a planning figure: the price the company hopes to charge, times the share of users it hopes will pay. All three are legitimate, but they carry very different weight, and investors discount borrowed and assumed ARPU heavily unless the deck shows why the startup will earn it.
Second, the user. Revenue divided by registered users, by monthly active users, by weekly active users, by paying users or by customer accounts gives very different numbers for the same company. Games and consumer apps often show both ARPU (revenue per user) and ARPPU (revenue per paying user); the gap between them is the share of users who pay. B2B companies often use ARPA, average revenue per account, because one customer may have hundreds of users. Knime's slide shows why this matters: about 30m€ of ARR over about 400 customers is roughly 75,000€ an account, but over half a million active users it is about 60€ a user (our calculations).
Third, the period. A monthly ARPU of $30 is $360 a year. Decks often leave the period out, and when a revenue line depends on it, a reader cannot tell whether the forecast is off by a factor of twelve. Nextdoor's footnote solves this by saying its ARPU is annualized; Comfortway writes "per year"; Katana writes "Monthly ARPA".
Once those three are known, the check is simple. Multiply users by ARPU and compare the result to the revenue on the slide. Then divide the revenue by the users and see whether the ARPU comes back. Where the two directions disagree, the slide contains an unstated assumption or an error.
Measured ARPU that reconciles
Nextdoor's page 33, "Multiple drivers of monetization", is a bridge from "Q1'20 US ARPU" of $4.36 to "Q1'21 US ARPU" of $5.71, with three steps: engagement +$0.57 (+13pts), ad delivery +$0.03 (+0.6pts) and local +$0.75 (+17pts), totalling +31pts. A side note says "31% growth Y/Y in Q1'21, accelerating from Q4'20". The footnote reads: "ARPU shown above is calculated by annualizing U.S. revenue divided by the average weekly active users (WAU) in the period." Our checks: $4.36 + $0.57 + $0.03 + $0.75 is $5.71; $5.71 over $4.36 is 31% growth; $0.57 and $0.75 are 13% and 17% of $4.36. The slide names the user (weekly actives), the period (annualized quarter), the geography (US) and the drivers, and every step adds up. This is the most complete ARPU slide in the set.
WhiteHat Jr's page 10, "Business Summary: All key metrics exceeding Series A Plan significantly", compares September actuals to plan: revenue run rate per month $335k against $230k (index 146), ARPU $386 against $191 (index 202), renewal 50% against 50%, total revenue January to September 2019 $1.06M against $0.7M (index 151) and NPS 50 against 61. A second chart shows per-class unit economics in rupees: revenue 554, discounts 70, teacher cost 308, gross margin 175, ops cost 52, CAC 71 and variable margin 52. A note says all numbers are based on collections from package sales and include GST. Our calculations: $335k divided by $386 is about 870, and $230k divided by $191 is about 1,200. If ARPU here is monthly revenue per paying customer, WhiteHat Jr beat its revenue plan with roughly a quarter fewer paying customers than planned, because each paid about twice as much. The slide does not say what the ARPU period or user base is, and it presents the whole table as metrics beating plan. Two more details matter: collections including GST are not revenue, and NPS of 50 against a plan of 61 is labelled "+11pp", which reads as an improvement when it is below plan.
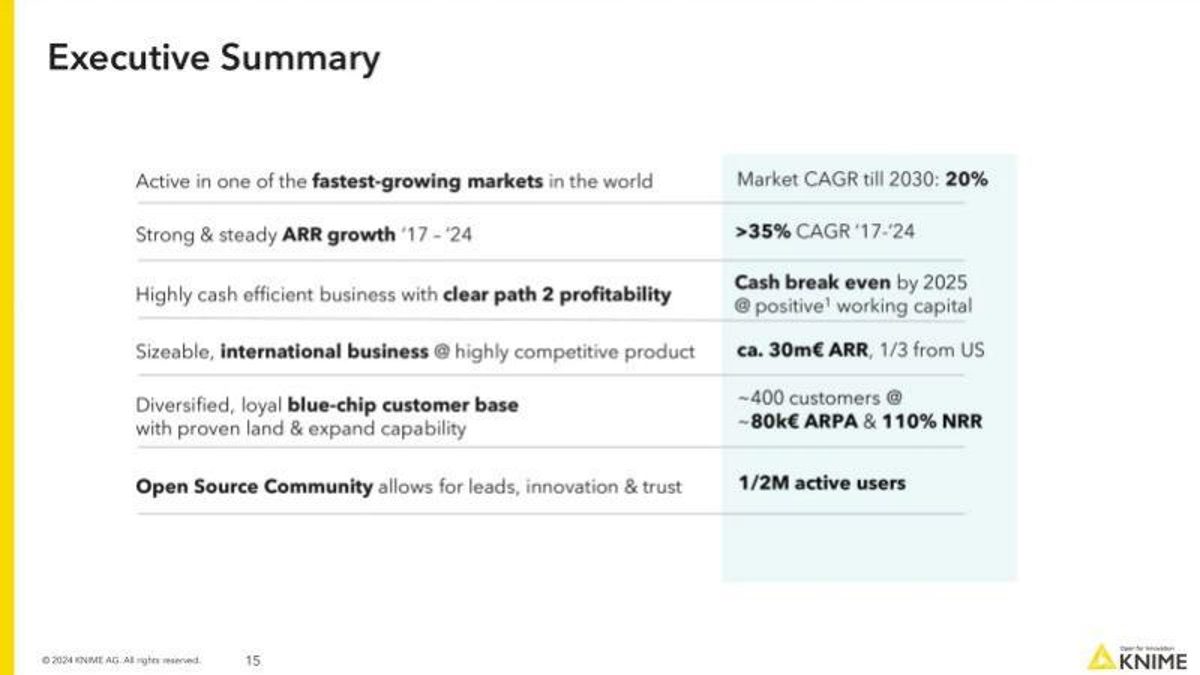
Knime's page 15, "Executive Summary", lists "ca. 30m€ ARR, 1/3 from US", "~400 customers @ ~80k€ ARPA & 110% NRR", "1/2M active users", ">35% CAGR '17-'24" and "Cash break even by 2025". Our calculation: 400 × 80,000€ is 32m€, close to the 30m€ stated; both are rounded, so the figures are consistent. Using ARPA rather than ARPU is the right choice for an open-source company with half a million free users and a few hundred paying accounts; dividing ARR by users would suggest an ARPU of about 60€, which would badly understate what customers pay.
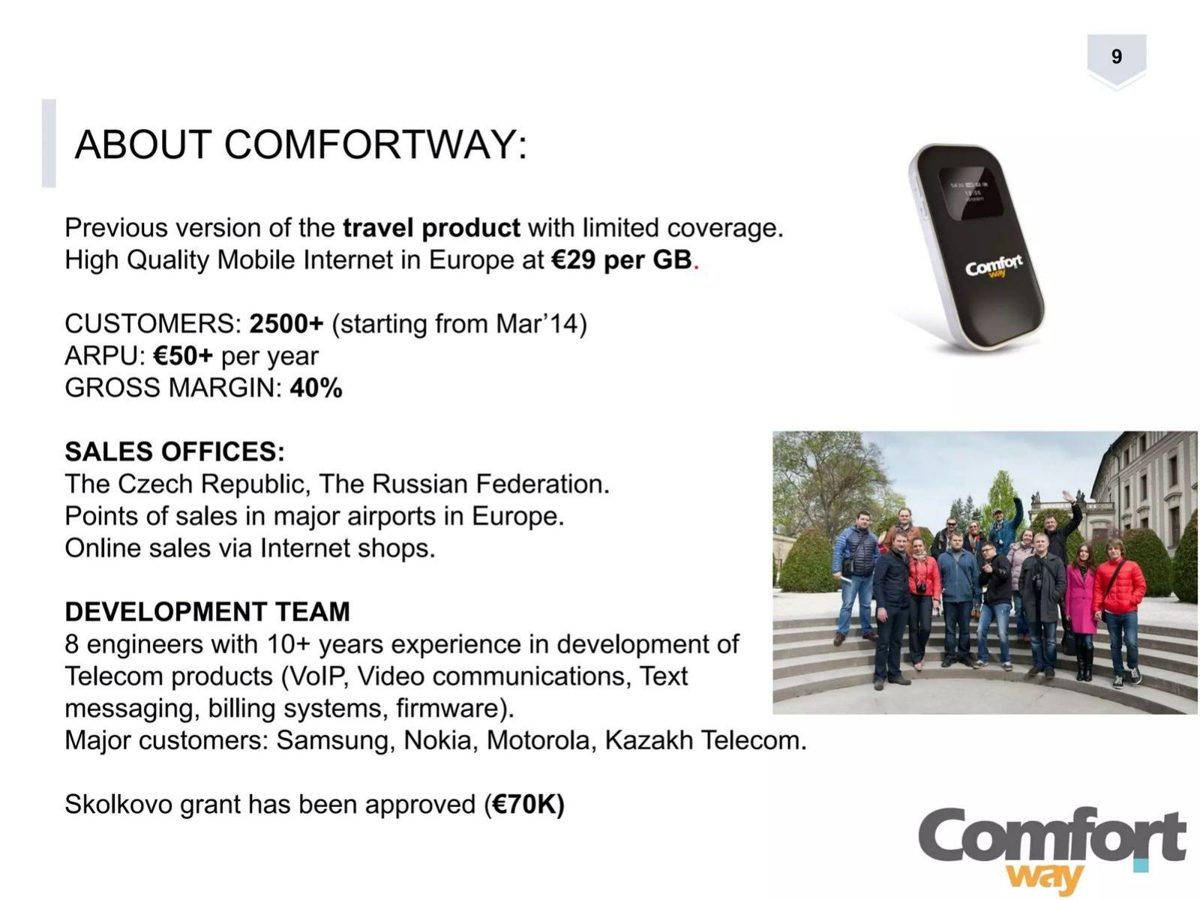
Comfortway's page 9, "About Comfortway", describes an earlier travel product: "High Quality Mobile Internet in Europe at €29 per GB", "CUSTOMERS: 2500+ (starting from Mar'14)", "ARPU: €50+ per year" and "GROSS MARGIN: 40%". Our calculations: 2,500 customers at €50 is about €125,000 a year; €50 at €29 per GB is about 1.7 GB a customer a year; 40% gross margin is about €20 of gross profit per customer a year. The slide states the period and the base, which lets an investor see that the earlier product was small and low-usage, useful context for the pivot the deck proposes.
Borrowed and industry ARPU
Honey's page 5, "Traction", shows a bar in which "Honey is currently 14% the size of Ebates", with a "$1B exit" marker at Ebates' size on an axis running to 3,000,000. Below, under "Ebates revenue model applied to Honey user base", it shows $73.33 spend per member per month, $5.56 ARPU per month and $1.8M monetization potential per month. Our calculations: $5.56 is about 7.6% of $73.33, the share of shopping spend Ebates keeps; $1.8M divided by $5.56 is about 324,000 members, which matches 14% of Ebates' roughly 2.3 million on the bar. The ARPU is clearly labelled as Ebates' and as potential, not Honey's revenue. That honesty is the model: the reader knows exactly what is borrowed. What the slide cannot show is whether Honey's users shop as much as Ebates' members, which is the assumption that matters.
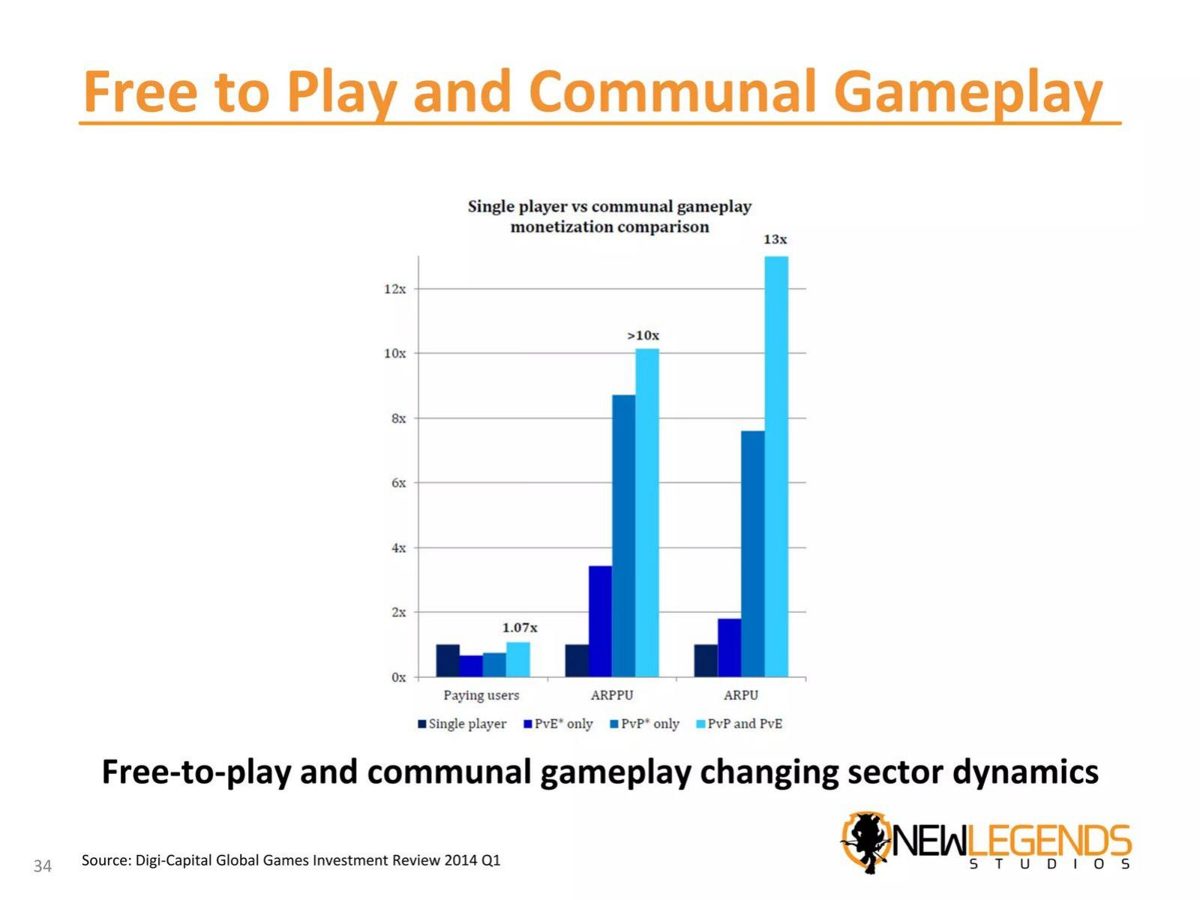
Legends Studios' page 34, "Free to Play and Communal Gameplay", shows a Digi-Capital chart (Global Games Investment Review 2014 Q1) comparing single-player games with PvE only, PvP only, and PvP and PvE games on three measures: paying users (1.07x for PvP and PvE), ARPPU (more than 10x) and ARPU (13x). This is industry data, sourced, and it makes a useful point: communal games earn more per user mainly because paying users spend more, not because more users pay (1.07x). But it is a relative multiple, not an ARPU the company has earned or will use, and the deck needs to connect it to its own revenue model before it counts as evidence.
Assumed ARPU in forecasts
Venn's page 19, "Our three year plan is in focus", says "Growing to $25/unit/month & 2.5M units, unlocking $750M in ARR" and shows a grid of ARPU per unit per month ($5 to $50) against units (a blurred "today" column, then 500,000 to 20M). The $25 row and 2.5M column are circled at $750,000,000. Side notes compare Yardi (13M units worldwide, 8M in the US) and Airbnb (7.7M listings, $1,200 per listing annually). Our checks: 2.5M × $25 × 12 is $750M. The "today" unit count is blurred in the shared copy, but the $25 row shows $58,500,000 and the $50 row $117,000,000 for today, both of which imply about 195,000 units. The slide states unit, price and period and multiplies through. What it does not show is today's ARPU, so an investor cannot tell whether $25 is a current price or a target, and the plan needs roughly thirteen times today's units (our calculation).
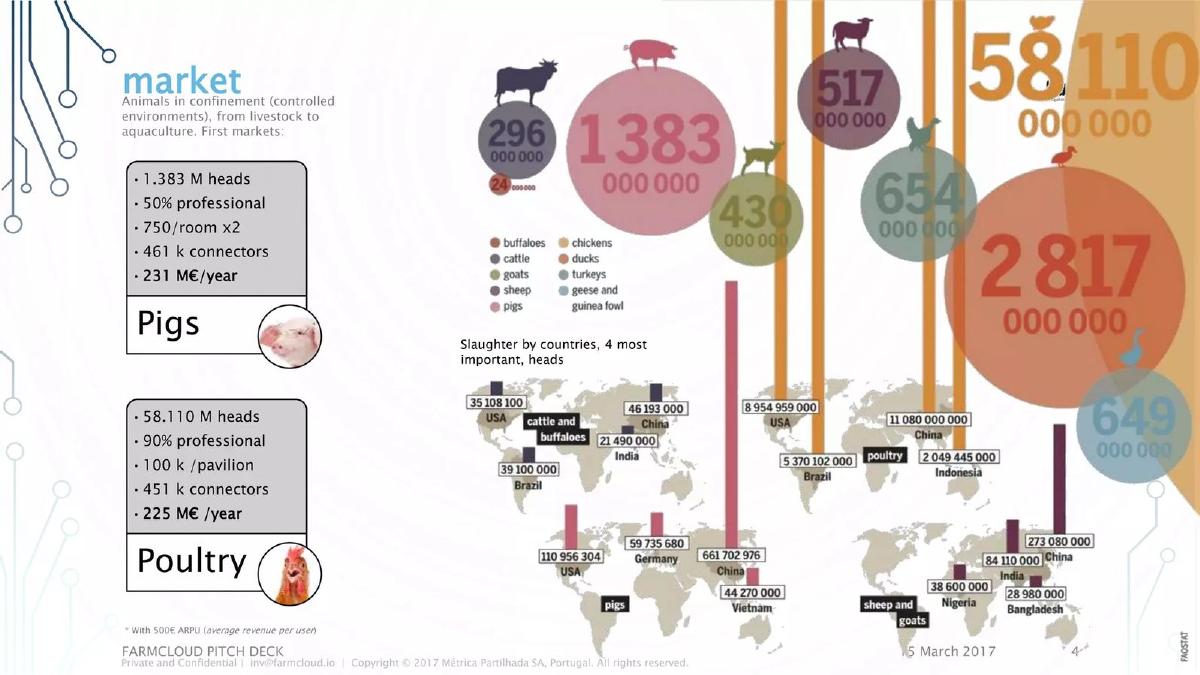
Farm Cloud's page 4, "market", sizes two markets with a footnote "With 500€ ARPU (average revenue per user)". Pigs: 1,383M heads, 50% professional, "750/room x2", 461k connectors, 231 M€/year. Poultry: 58,110M heads, 90% professional, "100 k /pavilion", 451k connectors, 225 M€/year. Our checks: 461,000 × 500€ is 230.5 M€ and 451,000 × 500€ is 225.5 M€, so revenue follows from connectors. For pigs, 1,383M × 50% divided by 1,500 per room gives 461,000, which matches. For poultry, 58,110M × 90% divided by 100,000 per pavilion gives about 523,000, not 451,000, and the slide shows no step that explains the difference. The "user" here is a connector, one per room or pavilion, not a farmer, which the footnote's "per user" obscures.
Wadja's page 11, "Business Model", says "5 ¢ revenue on each user SMS sent", "10 ¢ revenue on each brand SMS sent" and "ARPU approximately $1.68 per active user", then shows 1 billion messages (potential share of market) × $0.05 per SMS = $50M revenue in year 5. Our checks: 1 billion × $0.05 is $50M. But the ARPU has no period, and the $50M line does not use it: it uses messages, not users. $1.68 at 5 cents is about 34 user messages; if the ARPU were yearly, $50M would need about 30 million active users (our calculations). The slide gives two revenue models that are never connected.
ARPU that does not multiply through
Dario Health's page 33, "Long Term Potential", shows "1% of US Market (30.3 M) = $120M*", "1% of Worldwide (480 M) = $1.8B*" and "250K users = $100M", with the footnote "*Model assumes $30 ARPU". Our calculations: 1% of 30.3M is 303,000 users, so $120M is about $396 a user a year ($33 a month); 1% of 480M is 4.8M users, so $1.8B is $375 a year ($31.25 a month); 250,000 users at $100M is $400 a year ($33.33 a month). At exactly $30 a month the three lines would be about $109M, $1.73B and $90M. The footnote's ARPU has no period and none of the three lines uses it exactly. The differences are small, but they show the lines were rounded or built separately, and a reader cannot rebuild them.
Bettery's page 10, "Market Opportunity: Social Media Users & Friends", sizes 1.1B gambling social media users, 77M who own crypto and a 4.6M target market, then says: "Assuming 4.6M users join 1 event daily with CPE = $0.2, Bettery's yearly revenue is $67M with $15 ARPU, which is 45% of Facebook's worldwide ARPU." Our calculations: $67M divided by 4.6M is about $14.57, so the $15 ARPU matches the revenue. But 4.6M users × one event a day × $0.20 × 365 days is about $336M, five times $67M. The $67M corresponds to about one paid event every five days per user. The stated assumption and the stated ARPU disagree, and the comparison to Facebook's ARPU does not help, since an unlaunched betting app and a global ad network earn revenue differently.
Bunch's page 17, "First millennials & Gen-z leaders, then the whole professional world", applies one ARPU to three markets: TAM "2.6 Billion professionals in the world with a smartphone, ARPU at $129" ($335B), SAM "140 Million professionals in the US with a smartphone, ARPU at $129" ($18B) and SOM "65 Million Millennials and Gen Z workers in the US, ARPU at $129" ($8.3B), with "Current Market Share: 48k users and growing!" Our checks: 2.6B × $129 is about $335B; 140M × $129 is about $18.1B; 65M × $129 is about $8.4B, so the circles follow from the multiplier. The problem is the multiplier itself: $129 a year from every professional with a smartphone in every country, with no period stated and no evidence that the current 48,000 users pay anything close to it.
ARPU left blank
Katana's page 40, "Mid-term target", aims to be "#1 SaaS for SME manufacturers globally" with four boxes: "Monthly ARPA" and "LTV" each containing a smiling emoji, paying customers of more than 15,000 and ARR of more than 100M $. Our calculation: $100M divided by 15,000 is about $6,700 a year, or about $556 a month per account, which is the ARPA the two filled boxes imply. Leaving the box as an emoji may be a choice for a shared copy, but it means the slide hides the one number that connects its customer target to its revenue target.
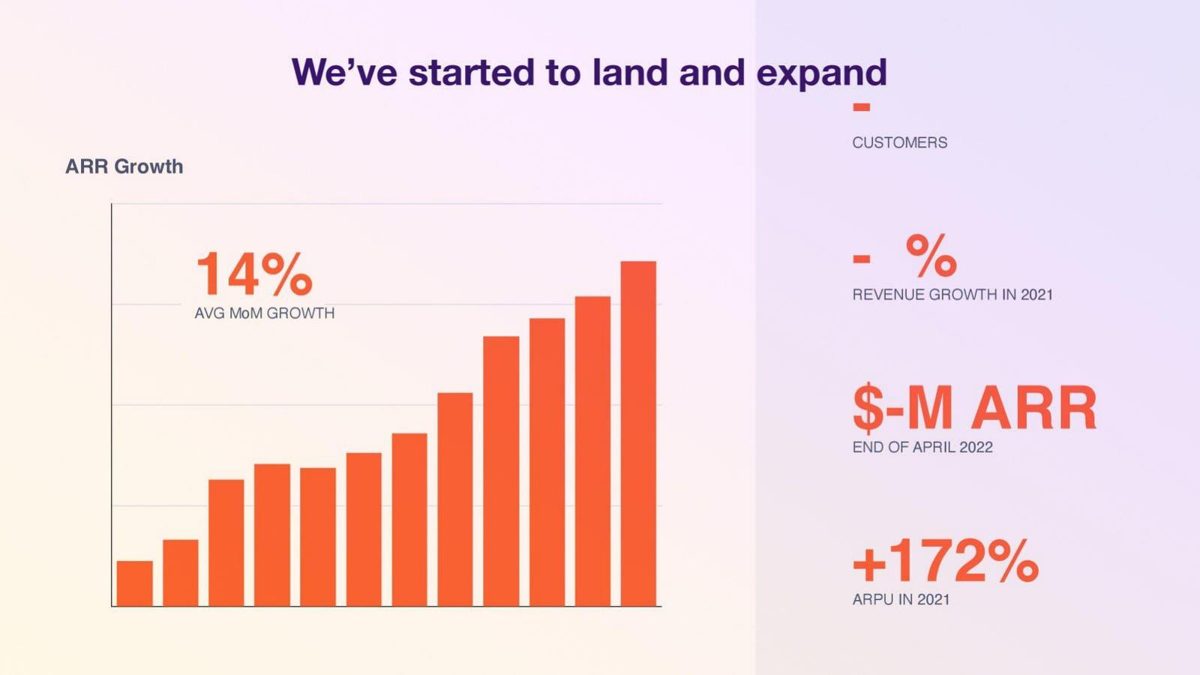
api.video's page 11, "We've started to land and expand", shows an ARR growth chart with "14% avg MoM growth" and four metrics: customers "-", revenue growth in 2021 "- %", "$-M ARR end of April 2022" and "+172% ARPU in 2021". The dashes appear to be removed from the shared copy. As shown, ARPU growth of 172% without the ARPU, the customer count or the revenue tells an investor that revenue per customer rose sharply but not from what base; a small starting ARPU can almost triple easily.
How to use ARPU in your revenue model
Label the source. Write "measured, Q1 2026", "Ebates' model applied to our users" or "assumed: $10 price × 30% paying". Honey does the second, and the reader immediately knows how much weight to give it.
Define the user and the period in the same line. "ARPU = annualized US revenue ÷ average weekly active users" (Nextdoor) or "ARPU: €50+ per year" (Comfortway). If most users are free, show ARPA or ARPPU as well, as Knime and the Digi-Capital chart do.
Show the multiplication and check it both ways. Users × ARPU = revenue, and revenue ÷ users = ARPU. Dario Health, Bettery and Farm Cloud each fail one direction. If your forecast uses rounded figures, round the result from the exact product rather than rounding each line separately.
Put measured ARPU next to user counts. ARPU alone can rise because low-paying users left. WhiteHat Jr's table shows why investors want both: ARPU doubled against plan while paying customers, on our calculation, fell short.
Justify a forecast ARPU with a current one. If today's ARPU is $12 and the plan uses $25, say what changes: a price increase, a new tier, a shift to larger customers. Venn's grid would be stronger with today's ARPU in the table.
Don't apply one ARPU to every market. Revenue per user in the US and worldwide, or among early adopters and the mainstream, is rarely the same. Bunch's single $129 across 2.6 billion people is the pattern to avoid.
Common mistakes
No period. Say per month or per year.
User not defined. Say which users are in the denominator.
Borrowed ARPU unlabelled. Name the company it comes from.
Lines built separately. Compute every line from one ARPU.
ARPU without user counts. Show both so revenue can be rebuilt.
One ARPU for every market. Vary it by geography and segment.
Diagnostic checklist
The ARPU source is labelled: measured, borrowed or assumed.
The user or account in the denominator is defined.
The period is stated.
Users × ARPU equals the revenue shown.
Revenue ÷ users gives back the ARPU.
A forecast ARPU is compared with today's.
ARPU appears next to the user or customer count.
Frequently asked questions
Should I show ARPU, ARPA or ARPPU?
Whichever matches who pays. Knime uses ARPA because accounts pay and most users are free; games often show ARPU and ARPPU together, as the Digi-Capital chart on Legends Studios' slide does.
Can I use another company's ARPU in my forecast?
Yes, if you label it. Honey writes "Ebates revenue model applied to Honey user base", which tells investors exactly what is borrowed.
Why does the ARPU period matter so much?
Monthly and yearly ARPU differ by twelve times. Dario Health's $30 has no period, so a reader cannot be sure how its revenue lines were built.
How do I check my own slide?
Multiply users by ARPU and compare with the revenue, then divide the revenue by users. Bettery's slide fails the first check: one $0.20 event daily is about $336M a year, not $67M.
Is rising ARPU always good news?
Not on its own. WhiteHat Jr's ARPU doubled against plan while its implied paying customer count fell short; show customers alongside ARPU.
How we chose these examples
Search (2026-09-30): the durable corpus index (docs/seo/artifacts/corpus-search, 70,729 unique pages, deduplicated by deck-file sha256 + page) was searched for ARPU, ARPA and "average revenue per user/customer/account"; 71 pages matched after excluding public companies, SPACs, mining, pharma and telecom groups.
Fifteen candidate pages were rendered from the original public deck files and read from the images; fourteen are used: Nextdoor 33, WhiteHat Jr 10, Knime 15, Comfortway 9, Honey 5, Legends Studios 34, Venn 19, Farm Cloud 4, Wadja 11, Dario Health 33, Bettery 10, Bunch 17, Katana 40 and api.video 11.
Left out after reading: Squire 10 (all values masked in the shared copy). Excluded without reading the image: Leafly 11 (Leafly 20 is already used in the GMV guide); Alan 21, Bigblue 10 and Convious 8 (ARPU shown only as placeholders such as "€X" and "$xxk" in the search text); Healthjoy 3 and Nextdoor 19 (already used in other guides); Calix, AT&T and quarterly telecom investor presentations (public companies). The deal-size guide covers how to label ARPU; this guide covers ARPU as a revenue-model input.
Figures are as printed on each slide; we did not have the companies' underlying data. How we built this: drafted and checked with AI assistance (editorial model review against the original slide images); no human editor has reviewed this guide.