Knime’s 16-slide Series B deck is a data-driven narrative focused on the commercialization of a massive open-source ecosystem. The company reports approximately €30M in ARR with a 35% CAGR from 2017 to 2024, supported by a loyal base of 400 blue-chip customers. The deck effectively bridges the gap between technical flexibility (supporting Python, R, and GenAI) and corporate necessity (governance and security). By highlighting a 110% Net Retention Rate (NRR) and an Average Revenue Per Account (ARPA) of €80k, Knime proves its 'land and expand' strategy is working. The presentation prioritizes b…
Key takeaways
- Knime reports a strong financial position with ca. €30M ARR and a 35% CAGR between 2017 and 2024 (Slide 15).
- The company maintains a highly efficient 'land and expand' model with a 110% Net Retention Rate (Slide 15).
- The platform supports a massive open-source community of 500,000 active users, serving as a primary lead generation engine (Slide 15).
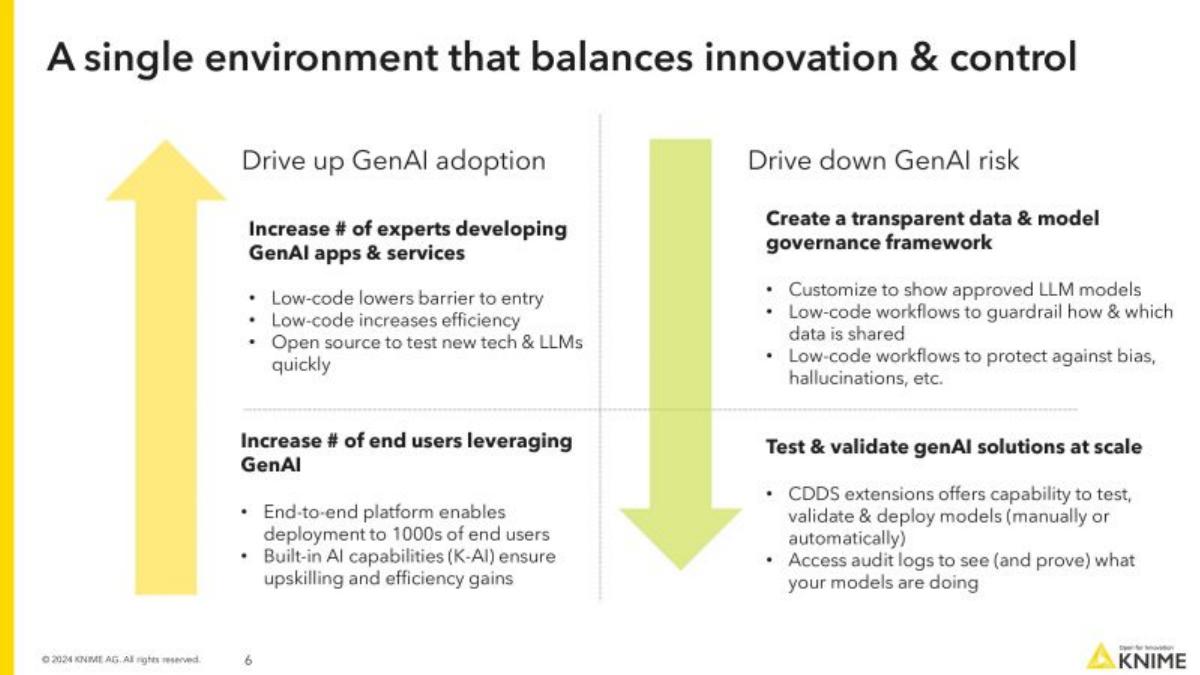
- Knime positions itself as a bridge for GenAI adoption, offering low-code guardrails to drive down risk while increasing expert efficiency (Slide 6).
- The deck provides specific, quantifiable business outcomes, such as 70% time savings for auditors in financial services (Slide 8).
- Market development is projected to grow from $90-100B in 2023 to $500-600B by 2030 (Slide 10).
- The team is distributed globally, with 32% of headcount in Berlin and 27% in Konstanz, Germany (Slide 14).
- Knime projects reaching cash break-even by 2025 with positive working capital (Slide 15).
Introduction: The Open-Source Enterprise Powerhouse
The Knime Series B pitch deck is a sophisticated example of how a mature open-source project transitions into a high-value enterprise software business. With 16 slides, the deck moves quickly from product capabilities to market opportunity and ends with a robust set of financial metrics. Unlike many early-stage decks that rely on vision and 'what-if' scenarios, Knime leans heavily on its established footprint: 500,000 active users and €30M in ARR.
Slides 1-2: Title and Agenda
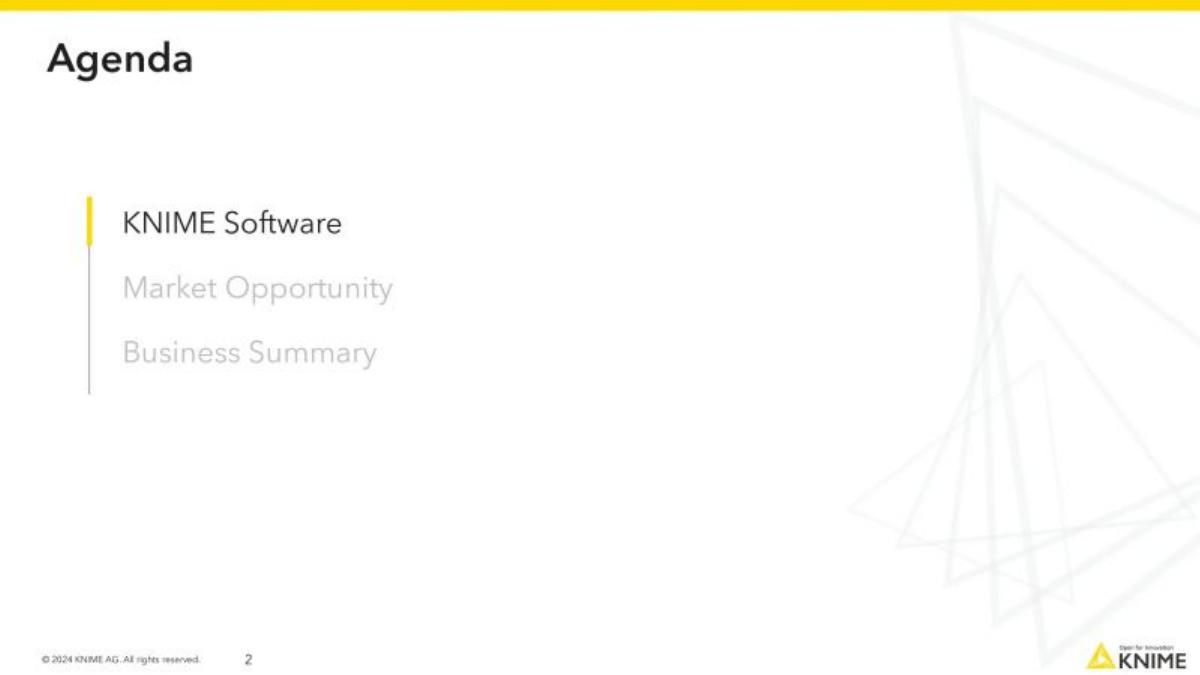
The deck opens with a clean, minimalist title slide featuring the Knime logo and the tagline 'Open for Innovation.' Slide 2 sets a professional tone with a three-part agenda: Knime Software, Market Opportunity, and Business Summary. This structure tells the investor exactly what to expect: a product deep-dive followed by the macro case and the micro-financials.
Slides 3-5: Product and Ecosystem
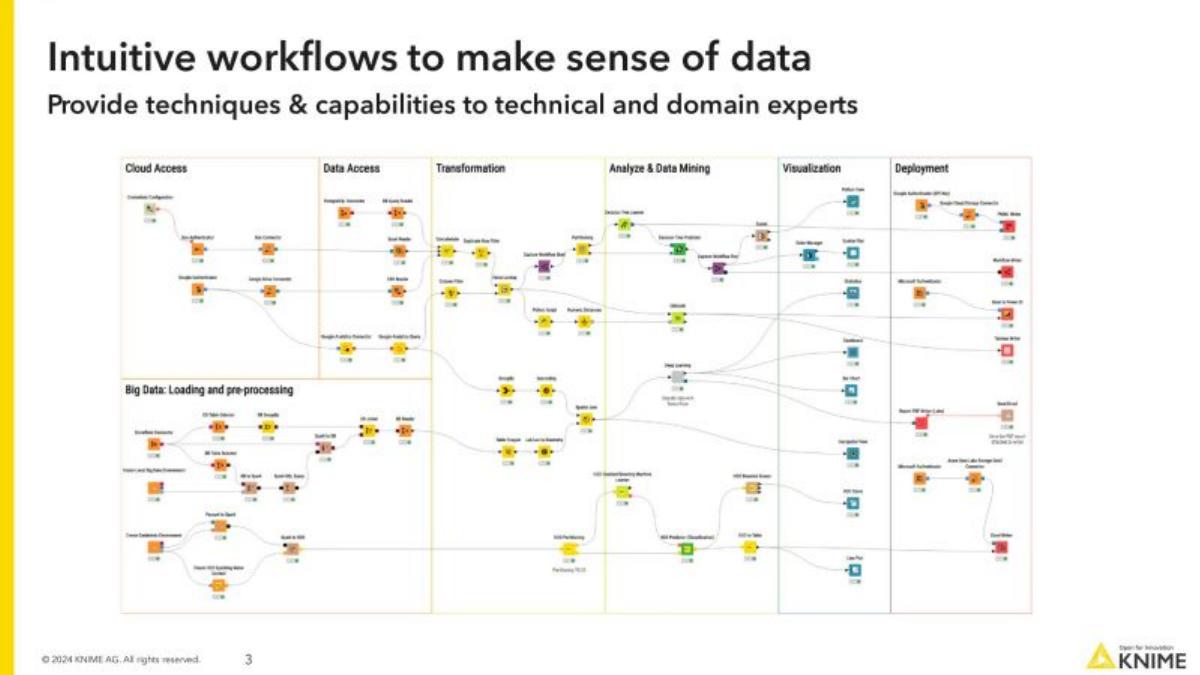
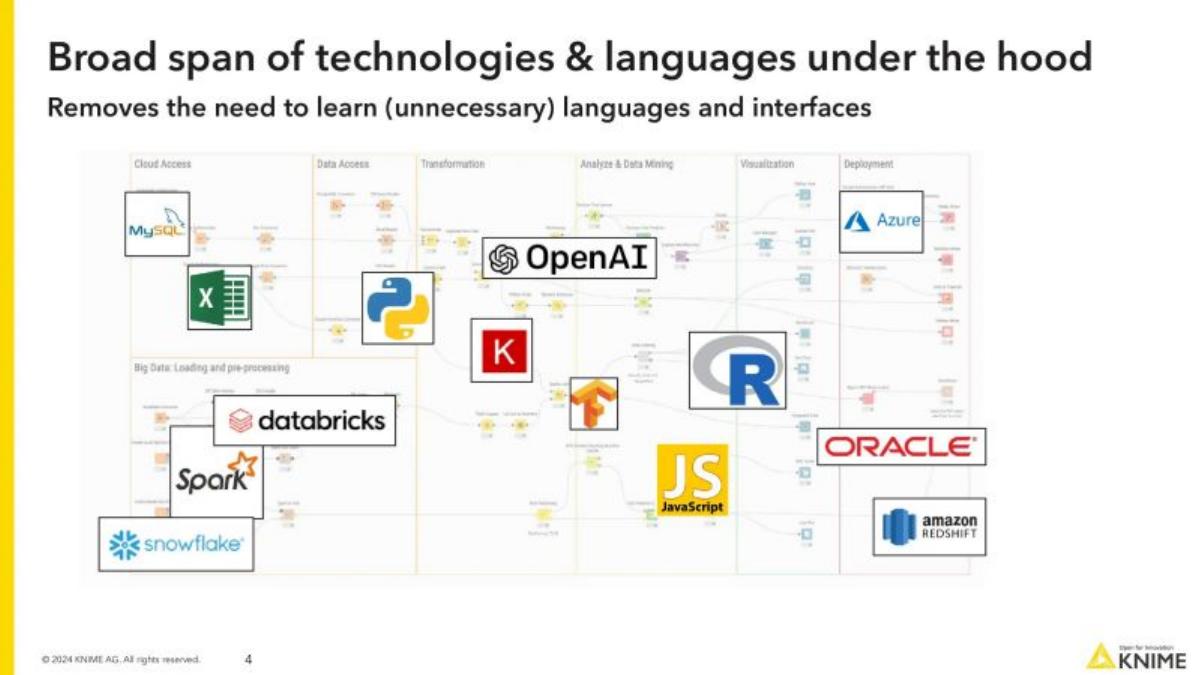
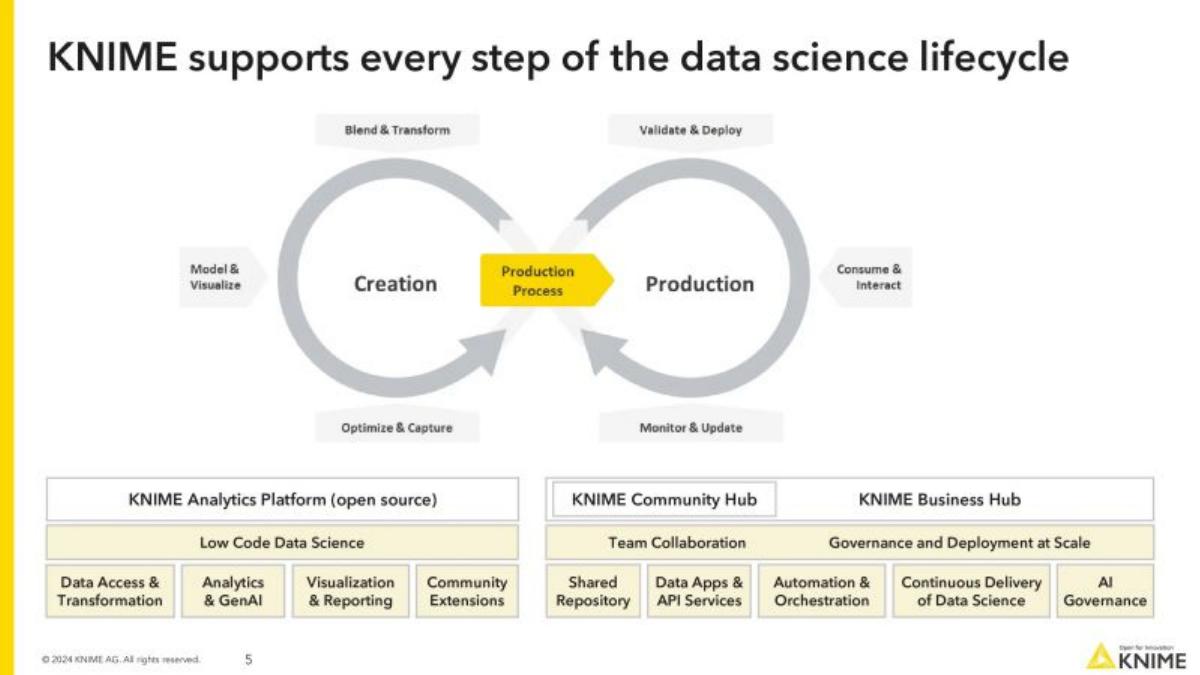
Slide 3 introduces the core product interface, showcasing 'intuitive workflows' that cater to both technical and domain experts. The visual is a complex node-based diagram, which serves to prove the platform's ability to handle sophisticated data pipelines from cloud access to deployment. Slide 4 emphasizes the 'broad span of technologies' integrated into the platform. It features logos for MySQL, Python, OpenAI, Snowflake, Databricks, and Azure, positioning Knime as the 'glue' that removes the need for users to learn multiple unnecessary languages. Slide 5 defines the data science lifecycle, splitting the offering into the open-source 'Analytics Platform' (for creation) and the 'Business Hub' (for production, governance, and scale). This is a critical slide for investors as it explains the 'open-core' monetization strategy.
Slides 6-7: The GenAI and Upskilling Narrative
Slide 6 addresses the current market obsession: Generative AI. Knime positions itself as a balancing force between innovation and control. It claims to increase the number of experts developing GenAI apps while providing a 'transparent data & model governance framework' to drive down risk. Slide 7 uses a quadrant graph to show how Knime helps organizations move from basic 'Spreadsheets & BI' to 'AI & ML' while simultaneously scaling from individual projects to 'Enterprise-Scale' production. This 'upskilling' narrative is a key selling point for large corporations struggling with data literacy.
Slide 8: Quantifiable Business Outcomes
This is arguably the strongest slide in the deck. It moves away from features and focuses on 'Top-Line' and 'Bottom-Line' impacts. Knime cites specific figures: $300M incremental revenue for a retail client, $4M risk reduction per incident for an insurance firm, and 70% time savings for auditors in financial services. It also mentions 10,000+ citizen data scientists at a manufacturing firm (Siemens). The slide is anchored by a 'wall of logos' including AIG, Bosch, P&G, and Fidelity, providing massive social proof.
Slides 9-10: Market Opportunity
Slide 10 quantifies the market development. It cites a current market size of $90-100 billion in 2023 , projected to grow to $500-600 billion by 2030 . This represents a 20% CAGR, as noted later in the executive summary. The slide lists key drivers such as the growing complexity of data and the expansion of the addressable market through low-code/no-code tools.
Slide 11: Competitive Landscape
Knime takes a bold stance on competition, labeling it mostly 'white space.' They categorize competitors into four buckets: Spreadsheets & BI (Excel, Tableau), Low-code/No-code (Dataiku, Alteryx), Legacy Players (SAS, IBM), and Scripting/Cloud Vendors (Python, Databricks, AWS). By placing themselves in the center, they suggest they are the only platform that bridges the gap between the flexibility of scripting and the ease of low-code.
Slide 12: The Knime Difference
This slide summarizes the value proposition into three pillars: Analytic Depth , A Complete Platform , and Enterprise Scale . It reiterates the 'Future-Proof' nature of open-source, mentioning 12,000+ analytics blueprints available to users. This emphasizes the defensive moat created by their community.
Slides 13-14: Team and Headcount
Slide 14 introduces the leadership team, led by Michael Berthold. It includes tenure dates for several executives, showing long-term stability (e.g., VP Evangelism since 01/14). The slide also provides a breakdown of headcount: 46% in Customer Care & Marketing and 30% in R&D . Geographically, the company is concentrated in Germany (Berlin and Konstanz), with a significant remote presence in the US and EU.
Slide 15: Executive Summary and Financials
The deck concludes with a high-density summary of the business's health. Key metrics include:
ca. €30M ARR , with 1/3 coming from the US. · >35% CAGR in ARR from 2017 to 2024. · 110% Net Retention Rate (NRR) . · ~400 customers with an ARPA of ~€80k . · 1/2 million active users in the open-source community. · Cash break-even target by 2025 .
This slide provides the 'hard' evidence required for a Series B round, showing a business that is both growing and becoming increasingly efficient.
What Works in This Deck
The Knime deck succeeds because it balances the 'community' story with the 'enterprise' story. Many open-source companies struggle to explain how they make money; Knime makes it clear that the community is a lead-gen engine for a high-value (€80k ARPA) enterprise product. The inclusion of specific, multi-million dollar business outcomes on Slide 8 elevates the conversation from technical tooling to strategic business value. Furthermore, the financial transparency on Slide 15—disclosing ARR, NRR, and a path to profitability—builds immediate trust with institutional investors.
What Is Missing
While the deck is comprehensive, a few elements are notably absent. There is no explicit 'Ask' slide detailing how the $30M will be spent or what the specific milestones for the next 18-24 months are. While they mention a 'path to profitability,' they do not show a simplified version of their P&L or burn rate. Additionally, while they mention 400 customers, they don't provide a breakdown of customer concentration or the sales cycle length, which are critical for evaluating the scalability of their B2B SaaS model.
What a Founder Should Copy
Founders should emulate the way Knime uses Slide 8 (Business Outcomes) . Instead of just listing features, they translate those features into revenue gains and cost savings for specific industries. Another takeaway is the Executive Summary (Slide 15) . Placing all the 'killer' metrics on one final slide ensures that the investor leaves the presentation with the most important numbers fresh in their mind. Finally, the use of a 'Upskilling' narrative (Slide 7) is a clever way to sell into the 'Enterprise'—it frames the software not just as a tool, but as a solution to the organization's talent and literacy gaps.
Frequently asked questions
- What is Knime's primary business model?
- Knime operates a B2B open-core model. It provides a free, open-source Analytics Platform for data science creation and monetizes through the Knime Business Hub, which offers governance, automation, and deployment at scale for enterprise clients. This allows them to use a large community of 500,000 active users as a top-of-funnel lead source for their paid enterprise products.
- How does Knime differentiate itself from competitors like Alteryx or Dataiku?
- According to Slide 12, Knime differentiates through 'Analytic Depth' (supporting any tool or script), being a 'Complete Platform' (build, deploy, and manage in one place), and 'Enterprise Scale.' A major differentiator is its open-source foundation, which the company claims makes it 'future-proof' by leveraging 12,000+ community-driven analytics blueprints that proprietary competitors cannot easily replicate.
- What are the key financial metrics disclosed in the deck?
- The executive summary on Slide 15 lists approximately €30M in ARR, a 35% CAGR from 2017-2024, and a 110% Net Retention Rate (NRR). They have roughly 400 enterprise customers with an Average Revenue Per Account (ARPA) of €80k. Notably, they expect to reach cash break-even by 2025.
- How is the Knime team structured?
- Slide 14 shows a leadership team led by Co-founder and CEO Michael Berthold. The headcount is heavily weighted toward Customer Care & Marketing (46%) and R&D (30%). Geographically, the company is rooted in Germany, with 59% of the staff located in Berlin and Konstanz, while 21% are based in the US (Austin and remote).
- What role does GenAI play in Knime's current strategy?
- Knime positions itself as an enabler for GenAI adoption. Slide 6 outlines how the platform helps 'drive up adoption' by lowering the barrier to entry for experts and 'drive down risk' through transparent governance frameworks. They offer built-in AI capabilities (K-AI) to assist with upskilling and provide guardrails to protect against bias and hallucinations in LLM models.