Kitu Life’s Series C deck for Super Coffee is a high-performance document that treats beverage sales with the analytical rigor of a SaaS business. By focusing on Total Distribution Points (TDP) and Annual Commodity Volume (ACV), the founders demonstrate a sophisticated understanding of retail mechanics. The deck highlights a 5-year CAGR of 167% and a clear path to $385 million in gross sales by 2024. While it leans heavily on competitive benchmarking against giants like Starbucks and Monster, it successfully argues that Super Coffee is a 'category expander' rather than just a competitor. The…
Key takeaways
- The company achieved a 5-year CAGR of 167%, growing 26x faster than the bottled coffee category average of 6.5% (Slide 11).
- Super Coffee ranks #3 in customer loyalty among all RTD coffee brands and #1 among independent brands (Slide 6).
- E-commerce represents 20% of total revenue, with a 4.9% conversion rate that doubles the F&B industry average of 2.1% (Slide 15).
- Distribution growth is aggressive, with a 108-point increase in TDP while incumbents like Starbucks and Dunkin' saw significant declines (Slide 10).
- The brand commands a premium price point of $0.27 per ounce, positioned just below La Colombe ($0.29) and above Starbucks ($0.20) (Slide 17).
- The deck projects reaching EBITDA positivity in 2022 on $160 million in sales (Slide 12).
- Retail strategy is mapped across five strategic grocery sections, including Dairy, Cafe, and Checkout, to maximize consumer touchpoints (Slide 4).
- Market penetration is currently at 1.4% of US adults, suggesting significant headroom within their 'Healthy Hustler' core demographic of 17.4 million people (Slide 7).
Introduction and Brand Identity
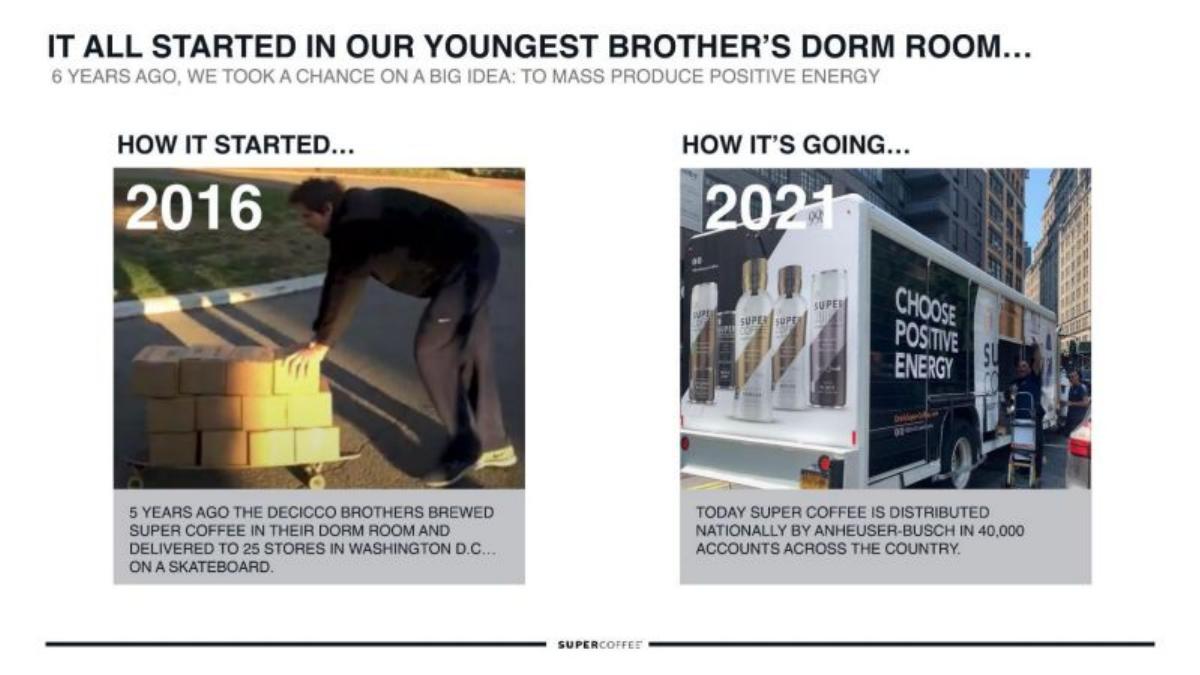
The Kitu Life Series C pitch deck, branded under their flagship product 'Super Coffee,' is a masterclass in data-driven retail storytelling. Unlike early-stage decks that focus on the 'why,' this late-stage presentation focuses heavily on the 'how much' and 'how fast.' The cover slide (Slide 1) establishes a clean, premium aesthetic with the tagline 'Positive Energy,' setting the tone for a brand that bridges the gap between functional energy drinks and indulgent coffee beverages.
The Winning Formula and Product Ecosystem
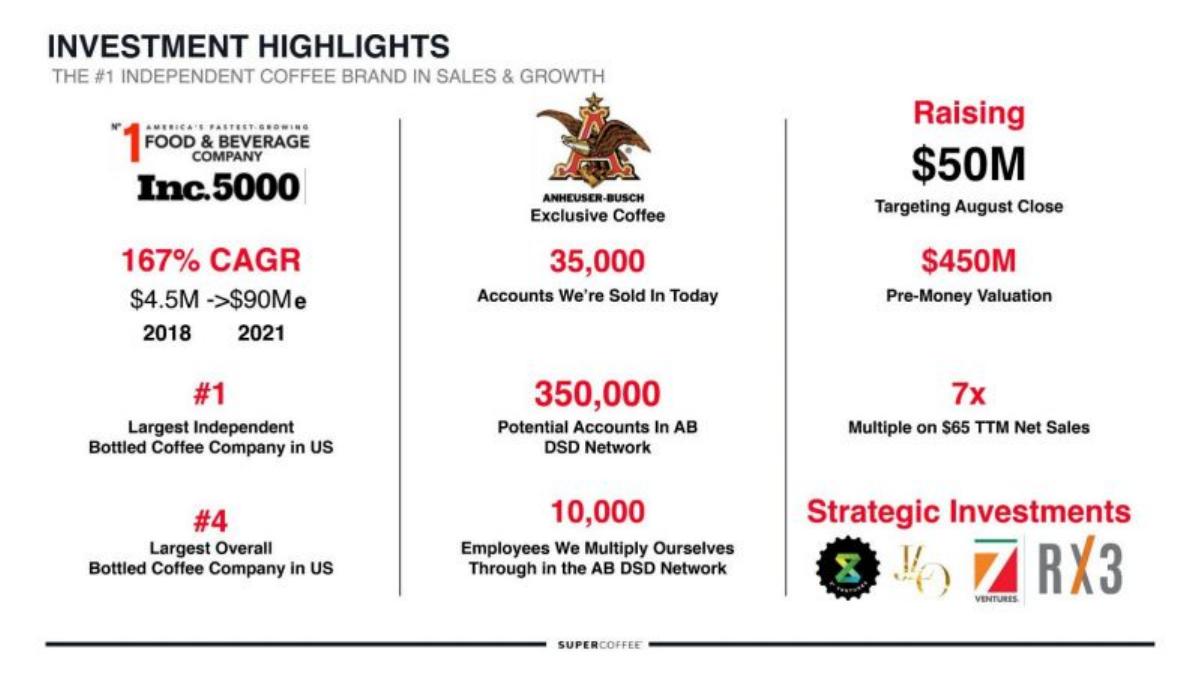
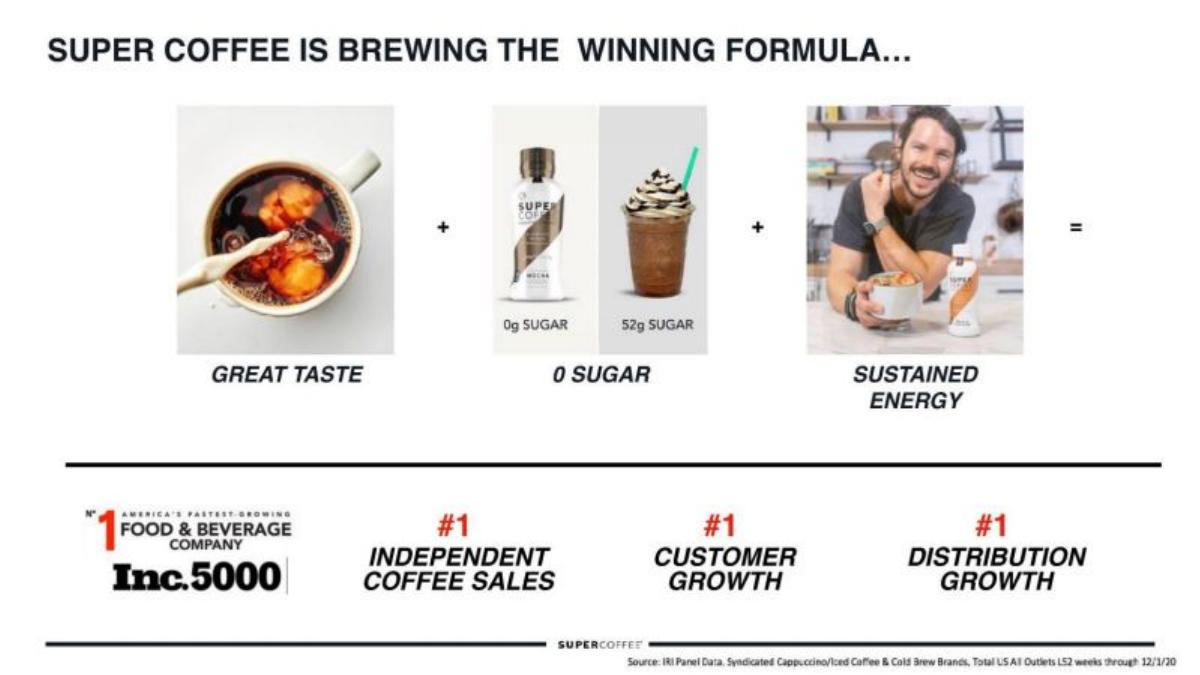
Slide 3 introduces the core product thesis: Great Taste + 0 Sugar + Sustained Energy. The slide uses a visual equation to contrast their 0g sugar mocha against a 52g sugar competitor. This is supported by high-level accolades, including being named the #1 America's Fastest-Growing Food & Beverage Company by Inc. 5000. This slide serves as the 'hook,' validating the product-market fit before diving into the mechanics of their growth.
On Slide 4, the company demonstrates a sophisticated understanding of retail geography. They illustrate a 'Total Coffee Solution' by mapping their product lines—Multi-Serve, Creamer, Ready-to-Drink (RTD), Espresso, Grounds, and Pods—across five different sections of a grocery store. This 'omni-aisle' strategy is a key differentiator, as it increases the probability of a consumer encountering the brand during a single shopping trip.
Customer Demographics and Loyalty Metrics
Slide 5 and Slide 7 define the target audience, dubbed 'The Healthy Hustler.' The deck segments the US adult population (194.1 million) down to a 'Core' demographic of 17.4 million people. By stating they have only reached 1.4% of US adults (2.3 million), they effectively argue that the brand has massive headroom for growth without needing to change its core messaging. The 'Healthy Hustler' is defined by traits like a 'packed schedule' and 'striving for success,' aligning the product with a lifestyle rather than just a flavor profile.
Loyalty is a critical metric for Series C investors, and Slide 6 delivers a compelling chart. Super Coffee claims the #3 spot in RTD coffee loyalty (62%), trailing only Monster (76%) and Starbucks (72%), and ranking #1 among all independent brands. This data, sourced from IRI Panel Data, suggests that once a customer tries the product, they are highly likely to repeat the purchase, which de-risks the cost of customer acquisition.
Retail Velocity and Category Expansion
Slides 8, 9, and 10 are perhaps the most important for a CPG investor. Slide 8 shows that Super Coffee's share of growth relative to its category index (284) far outpaces La Colombe (221), Starbucks (104), and Monster (127). Slide 9 takes this further by claiming that 71-77% of their sales are 'Net New' to the category. This is a powerful 'sell-in' point for retail category managers: stocking Super Coffee doesn't just swap one dollar for another; it grows the total revenue of the coffee aisle.
Slide 10 provides a 'war map' of distribution growth. It shows Super Coffee gaining 108 points in Total Distribution Points (TDP) while Starbucks and Dunkin' lost 449 and 109 points respectively. This visualizes a market shift where legacy brands are losing shelf space to functional, health-conscious innovators. Slide 13 supports this with a geographic breakdown of ACV (All Commodity Volume), showing strong penetration in the Northeast (68.2%) and Southeast (56.2%), with significant room to grow in the Great Lakes and West regions.
Financial Performance and Projections
The financial core of the deck is found in Slides 11 and 12. Slide 11 shows a 5-year CAGR of 167%, with gross sales jumping from $0.7 million in 2017 to a budgeted $93 million in 2021. The green line representing EBITDA % shows a steady upward trend, indicating that the company is successfully narrowing its losses as it scales. Slide 12 projects this forward to $385 million in sales by 2024, with the explicit goal of reaching EBITDA positivity in 2022 at the $160 million revenue mark.
Slide 14 and 15 pivot to their 'Digital Native' roots. Slide 14 shows a breakdown of volume by channel, where grocery accounts for 60% of their business, but DTC (Direct to Consumer) and Amazon combined represent 18%. Slide 15 highlights a 4.9% e-commerce conversion rate, which is more than double the industry average. This omnichannel strength is a hallmark of modern CPG brands, allowing them to collect first-party data that legacy brands cannot access.
Innovation Playbook and Pricing Power
Slide 16 outlines the 'Innovation Case Study,' showing a four-step process: Ideate, Validate, Launch, and Sell-Out. They cite the 'Blueberry Latte' as a first-to-market success and show a 'Renovation' example where a packaging update led to a 575% increase in 'Likely to Buy' scores. This slide proves that the company has a repeatable system for product development, reducing the risk of future launches.
Finally, Slide 17 addresses pricing. Super Coffee positions itself as a premium product at $0.27 per ounce. This is significantly higher than Java Monster ($0.16) and Starbucks ($0.20), but slightly below La Colombe ($0.29). This 'premium but accessible' pricing strategy allows for healthier margins while maintaining the brand's 'indulgent' positioning.
What Works in This Deck
Data Density: The deck is packed with third-party verified data (IRI, SPINS, Simmons/MRI). This builds immediate credibility for a Series C raise. · Retailer Empathy: By focusing on 'Category Expansion' and 'Net New Sales,' the founders speak the language of the people who control their fate: grocery category managers. · Visual Clarity: Despite the high volume of data, the charts are clean and the 'so what' of each slide is clearly stated in the header. · Omnichannel Proof: Showing high e-commerce conversion rates alongside massive retail growth proves the brand has a pull-effect, not just a push-effect from distribution.
What is Omitted
Team Slide: In this 17-slide selection, there is no mention of the founders or the executive leadership team. For a Series C, investors want to see the 'operators' who will manage a $300M+ revenue business. · Unit Economics: While EBITDA % is shown, the deck does not break down Gross Margins, COGS, or Contribution Margin per case. · The Ask: There is no slide detailing how much capital is being raised or how those funds will be allocated (e.g., marketing vs. inventory vs. headcount). · Competition Deep Dive: While they benchmark against Starbucks and Monster, they don't address emerging 'clean energy' competitors in the coffee space.
Founder Takeaways
Lead with Velocity: If you are a CPG founder, your most important metrics are TDP, ACV, and Loyalty. Kitu Life puts these front and center. · Map the Store: Don't just say you are in grocery; show where you sit. The 'Total Coffee Solution' map (Slide 4) is a brilliant way to show market dominance potential. · Project the Path to Profit: Investors in the current climate want to see the 'EBITDA Positive' crossover point. Slide 12 does this perfectly by tying it to a specific revenue milestone ($160M). · Use Equations: The 'Winning Formula' slide (Slide 3) simplifies a complex brand identity into a simple math problem that is easy for an investor to remember and repeat.
Frequently asked questions
- What is the primary value proposition of Super Coffee according to the deck?
- The brand positions itself as the 'winning formula' by combining great taste with 0g of sugar and sustained energy. Slide 3 explicitly contrasts their 0g sugar content against a traditional 52g sugar latte, framing the product as a healthier alternative that doesn't sacrifice the indulgent experience consumers expect from the coffee category.
- How does Kitu Life justify its retail expansion strategy?
- They use 'Category Expansion' data to win over retail managers. Slide 9 shows that 71% of their pod sales and 77% of their creamer sales are 'Net New/Expanded Sales' at national grocers. This argues that Super Coffee isn't just stealing market share from competitors; it is bringing new shoppers into the coffee category entirely.
- What are the specific financial projections for the company?
- The deck outlines a steep growth trajectory: $93 million in 2021, $160 million in 2022, $250 million in 2023, and $385 million by 2024 (Slide 12). Crucially, they project becoming EBITDA positive in 2022, showing a transition from high-burn growth to a sustainable business model as they scale.
- How does the company perform in digital channels compared to retail?
- While 80% of revenue comes from physical retail, the 20% from e-commerce is highly efficient. Slide 15 shows digital revenue growing from $1 million in 2018 to a projected $18 million in 2021. Their 4.9% conversion rate is a key metric used to prove brand resonance and digital native capabilities.
- What is missing from this version of the pitch deck?
- The 17-slide sample provided lacks a dedicated team slide, an explicit 'Ask' slide detailing the round size and terms, and a deep dive into unit economics (COGS/Gross Margin). While the financial charts show gross sales and EBITDA %, the underlying cost structure per unit is not detailed in these slides.