Predina Tech’s seed deck is a masterclass in identifying a specific data gap within a massive legacy industry. By focusing on 'Location Intelligence,' the company argues that current insurance models—which rely on driver behavior (telematics) and demographics—ignore the dynamic risk of specific locations at specific times. The deck uses clear, high-contrast visuals to demonstrate how their AI analyzes over 14 million accident records alongside weather and road geometry. While the deck excels at problem identification and technical approach, it is notably silent on specific financial asks, val…
Key takeaways
- The company identifies a $500BN market opportunity with 1.3M annual events as the primary pain point (Slide 1).
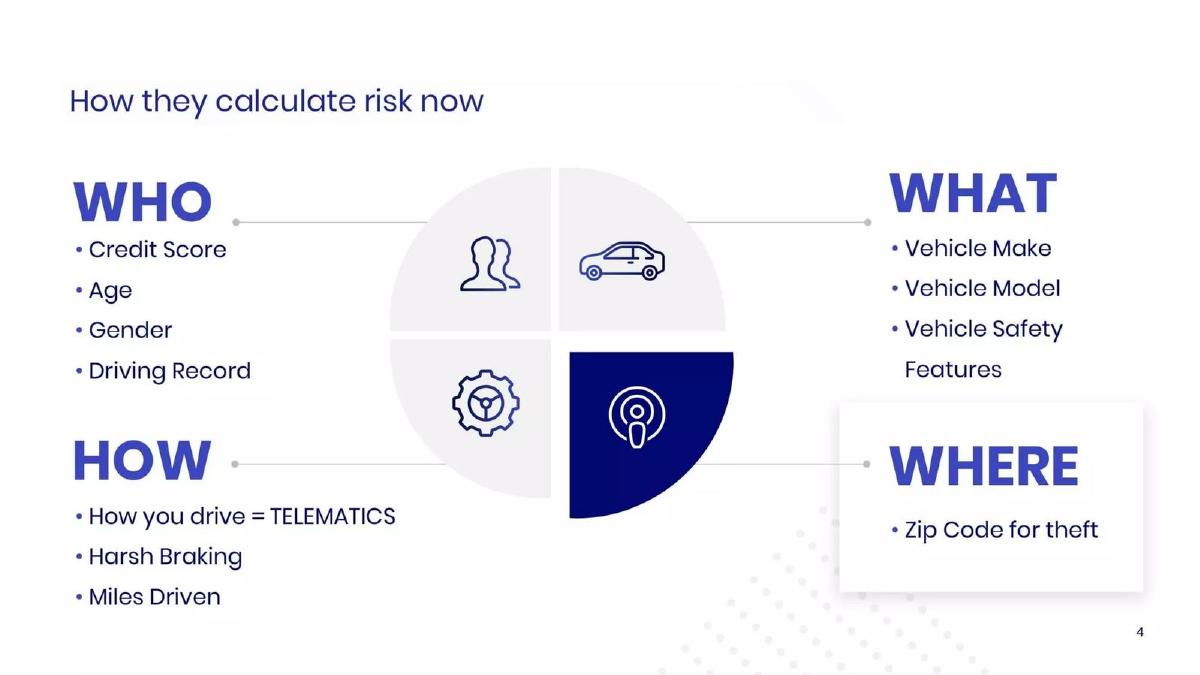
- Predina positions itself as the 'Where' in the risk calculation matrix, supplementing existing 'Who,' 'What,' and 'How' data points (Slide 4).
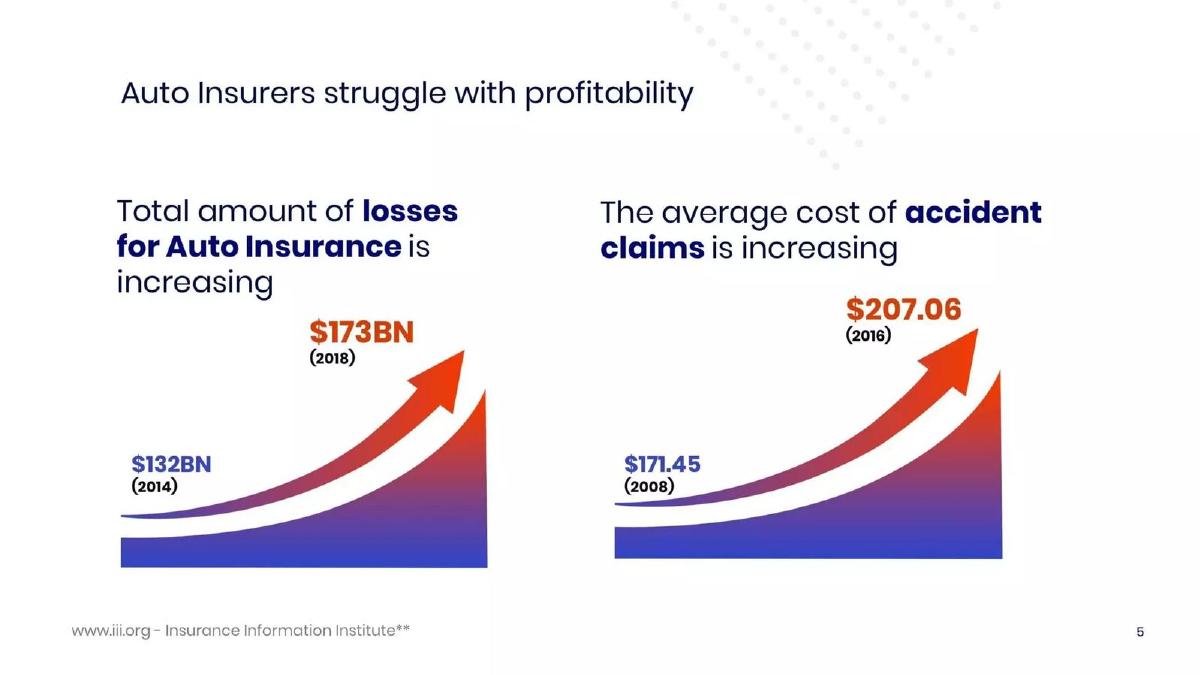
- Total losses for auto insurance are shown rising from $132BN in 2014 to $173BN in 2018, creating an urgent need for better pricing models (Slide 5).
- The technical core involves processing >14 million accident data points combined with weather and road intersections (Slide 8).
- A 1% improvement in risk modeling is equated to a $1.73BN value proposition for the US market (Slide 10).
- Early traction is demonstrated through partnerships with a leading UK Insurtech, a large UK UBI insurer, and a US connected car manufacturer (Slide 11).
- The management team brings over 20 years of combined experience in automotive data and risk scoring (Slide 12).
- The deck completely omits a formal 'Ask' slide, leaving out the funding amount, valuation, and use of proceeds.
The Hook: Quantifying the Crisis
Slides 1-2: Market Scale and Vision
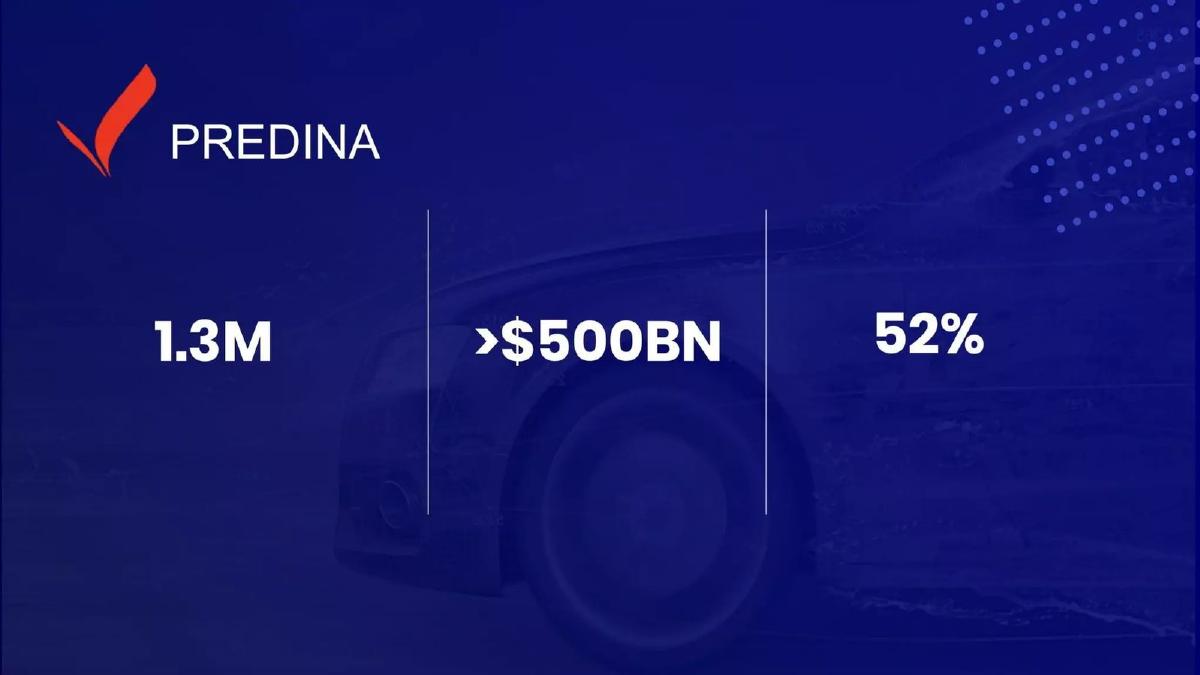
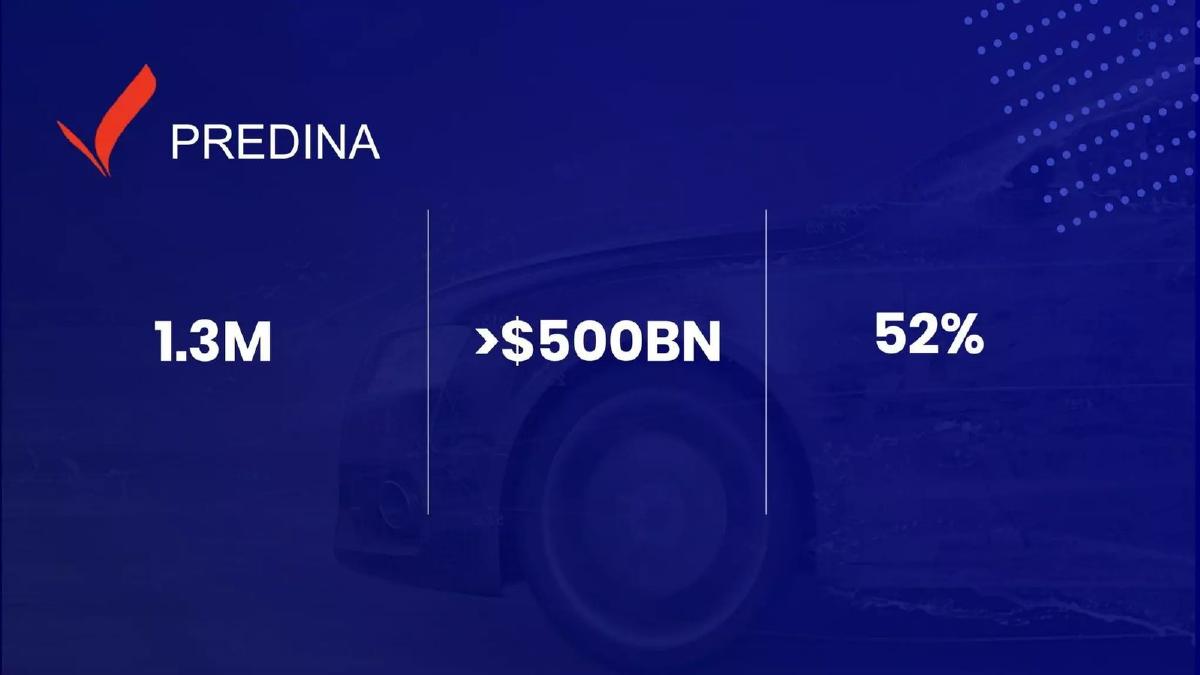
Predina opens with a high-impact, minimalist slide. Three numbers dominate the frame: 1.3M , >$500BN , and 52% . While the slide doesn't explicitly label these on the page, the context of the following slides suggests these represent annual accidents, the total addressable market, and perhaps a loss ratio or efficiency metric. This is a classic 'big number' opening designed to establish the gravity of the problem before introducing the solution.
Slide 2 provides the mission statement: "Location Intelligence to power the future of Auto Insurance." This immediately categorizes the company as an Insurtech/AI play, focusing on a specific niche—location—rather than trying to reinvent the entire insurance stack.
The Problem: The Blind Spot in Risk Calculation
Slides 3-5: The Limitations of Current Telematics
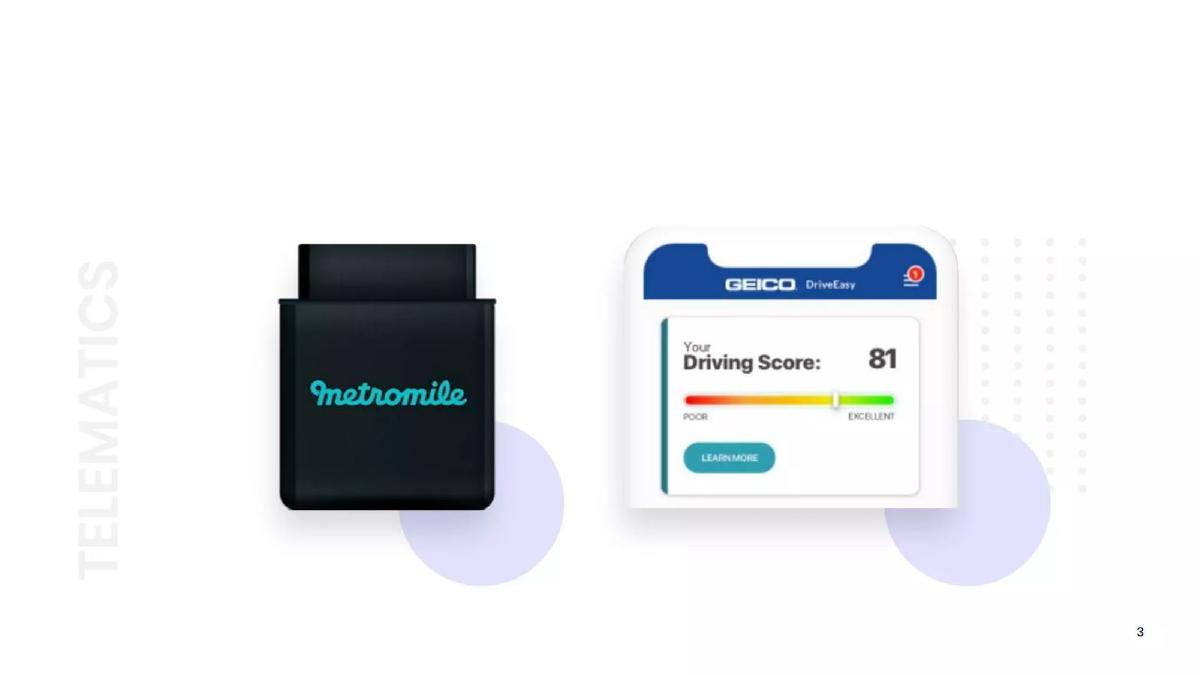
Slide 3 uses visual cues (Metromile and GEICO DriveEasy) to reference the current state of the art: Telematics. By showing these, Predina acknowledges that the industry has already moved toward data-driven pricing but implies that something is still missing.
Slide 4 is the most critical conceptual slide in the deck. It breaks down risk into four quadrants: WHO (Credit score, age, gender), WHAT (Vehicle make/model), HOW (Telematics, harsh braking), and WHERE . Crucially, it points out that 'Where' is currently limited to 'Zip Code for theft.' This identifies the 'blind spot' Predina intends to fill. They aren't competing with telematics; they are completing the data set.
Slide 5 provides the economic justification. It shows that auto insurers are struggling with profitability. Total losses increased from $132BN in 2014 to $173BN in 2018 , and the average cost of accident claims rose from $171.45 in 2008 to $207.06 in 2016 . This slide establishes 'urgency'—the current models are failing to keep pace with rising costs.
The Solution: Dynamic Location Risk
Slides 6-7: From Static Zip Codes to AI Maps
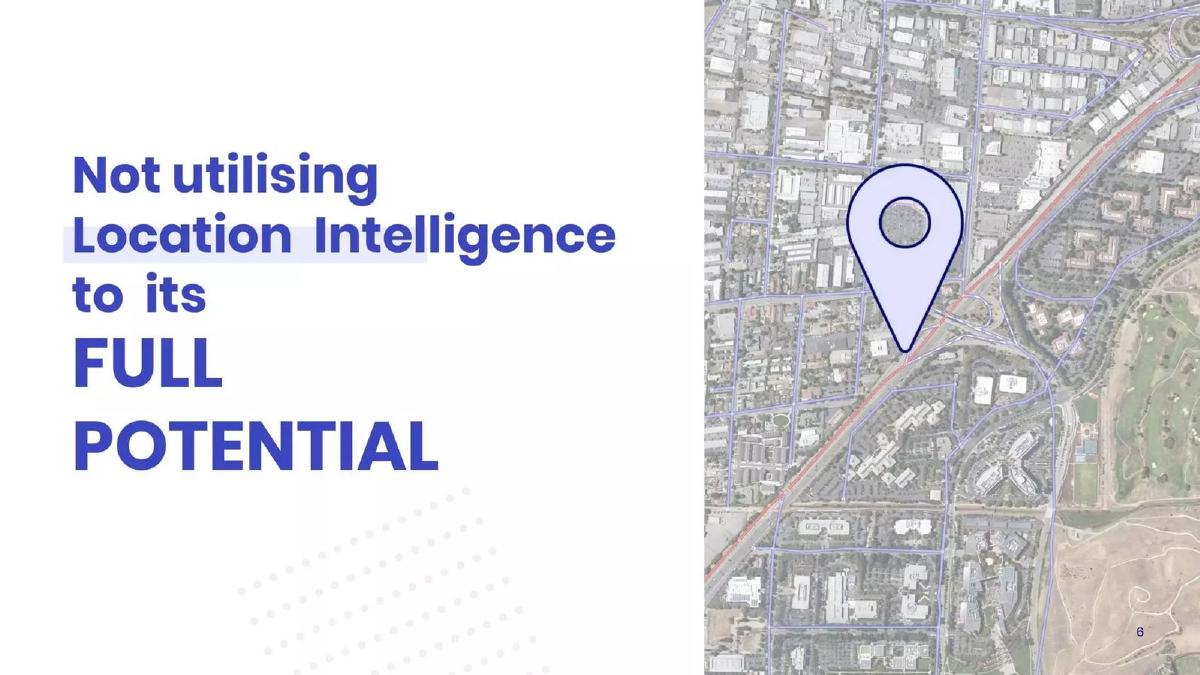
Slide 6 is a transition slide with a simple, powerful statement: "Not utilising Location Intelligence to its FULL POTENTIAL." It uses a map overlay to suggest that risk is more granular than a broad zip code.
Slide 7 introduces the product interface. It shows a Mapbox-powered visualization of a route between San Francisco and San Jose. The route is color-coded from 'Safer' (blue) to 'Hotspot' (yellow). This demonstrates the 'Spatio-temporal' nature of the product—risk isn't just about the road; it's about the specific point on that road at a specific time.
The Technology: Data Layers and AI
Slide 8: The Engine Under the Hood
This slide details the inputs for Predina's AI. It claims the system learns from >14 MILLION ACCIDENT DATA points. It categorizes data into three concentric circles: Near Field (Road features, geometry, traffic), Far Field (Weather, amenities), and Environment (Events, holidays, historic accidents). This is a strong technical slide because it shows the complexity of the model without becoming an unreadable white paper. It suggests a high barrier to entry for competitors who lack this specific data aggregation.
The Value Proposition and Traction
Slides 9-11: The 1% Improvement
Slide 9 returns to the quadrant model from Slide 4, but now the 'WHERE' box is filled with the Predina logo. The headline is clear: "Compliment Auto Insurer’s existing risk model’s to help price in a more profitable way." This is a smart 'low-friction' sales pitch; they aren't asking insurers to rip and replace, just to add a data layer.
Slide 10 quantifies the value of this addition. It states that a 1% improvement = $1.73BN across the US Auto Insurance market for 2018. By framing the benefit as a percentage of the total market losses shown on Slide 5, they make the ROI feel inevitable even if their impact is marginal.
Slide 11 showcases traction. In "less than 6 months," they have engaged with a leading UK Insurtech, the largest UK UBI insurer, and a US connected car manufacturer. While the lack of names might be due to NDAs, the specific categories of these partners validate the product's utility across different segments of the automotive ecosystem.
The Team and Conclusion
Slides 12-13: Domain Expertise
The management team slide (Slide 12) is robust. Bola Adegbulu (CEO) is noted as a Forbes 30 Under 30 in Mobility and founder of a previous telematics startup. Guy Barbor brings 20 years of experience and two exits in the space. Carlo Corsario (CTO) provides the academic and technical weight with a PhD and experience in deep learning. The summary "20+ years experience across Automotive Data, AI & Insurance/Telematics" anchors the pitch in credibility.
Slide 13 is a repeat of the title slide, serving as a contact page.
What Works
Clear Gap Identification: The 'Who, What, How, Where' framework is an excellent way to explain a complex data product to a generalist investor. · Economic Urgency: By showing rising insurance losses, they move the product from a 'nice to have' to a 'must have' for insurer survival. · Granular Data Story: Slide 8 effectively communicates the depth of their data moat without getting lost in jargon. · Low-Friction Integration: Positioning the product as a 'compliment' to existing models lowers the perceived barrier to sales.
What is Missing
The Ask: There is no slide stating how much money they are raising, the valuation, or what the milestones for the next 18 months are. · Business Model: The deck doesn't explain how Predina makes money. Is it a per-API-call fee? A percentage of the premium? A flat SaaS license? · Competition: There is no mention of other location intelligence firms or why an insurer wouldn't just build this in-house using their own historical claims data. · Financial Projections: There are no charts showing projected revenue growth or headcount expansion.
What a Founder Should Copy
The 'Quadrant' Strategy: If your startup provides a specific data point or service that fits into a larger legacy workflow, use a visual like Slide 4 to show exactly where you fit and why you aren't a threat to existing incumbents. · The '1% Improvement' Logic: In massive industries (Insurance, Logistics, Energy), showing that even a tiny fractional improvement leads to billions in savings is a highly effective way to justify a high valuation. · Visual Consistency: The deck uses a consistent color palette and clean iconography, which makes the technical subject matter feel more accessible and professional.
Frequently asked questions
- What is the core problem Predina Tech is solving?
- Predina addresses the lack of precise location-based risk data in auto insurance. While insurers track driver behavior (telematics) and vehicle types, they often only use zip codes for location risk. Predina uses AI to predict accident risk for specific locations and times by analyzing historical crashes, weather, and road geometry, helping insurers price policies more accurately.
- How does Predina's technology integrate with existing insurance models?
- According to slide 9, Predina is designed to 'compliment' rather than replace existing models. It fills the 'Where' quadrant of risk assessment. By providing a more granular understanding of location risk, it allows insurers to refine their pricing and improve profitability without discarding their current demographic or telematics data.
- What kind of data does Predina use for its predictions?
- Slide 8 specifies that their AI learns from over 14 million accident records. This is combined with spatio-temporal data including weather conditions, road intersections, traffic volumes, road geometry, and even local amenities or events. This multi-layered approach allows them to move from 'Near Field' road features to 'Environment' level factors like holidays.
- What traction has the company achieved?
- Slide 11 lists three key milestones achieved in under six months: engagement with a 'Leading Series B Insurtech UK,' the 'Largest UBI Insurer in UK,' and a 'Leading US Connected Car Manufacturer.' While specific names are not disclosed, these represent significant pilot or partnership categories for a seed-stage company.
- What is missing from the Predina pitch deck?
- The deck is missing several standard fundraising elements. There is no 'Ask' slide detailing how much capital is being raised or the terms. It also lacks a detailed business model slide explaining how they charge (SaaS vs. per-quote), a competitive landscape analysis, and a financial projection or 'burn' slide.