The Prealize Health (presented as Cardinal Analytx) Series B deck is a data-dense presentation that prioritizes technical credibility and financial outcomes over flashy design. Spun out of Stanford's Start-X, the company leverages four years of R&D to predict 'cost blooms' in healthcare populations. The deck is notable for its transparency regarding pricing—listing average annual prices per customer between $400k and $850k—and its aggressive competitive benchmarking. By showcasing a 2.5x accuracy advantage over industry incumbents like Optum and Verscend, the company successfully positioned i…
Key takeaways
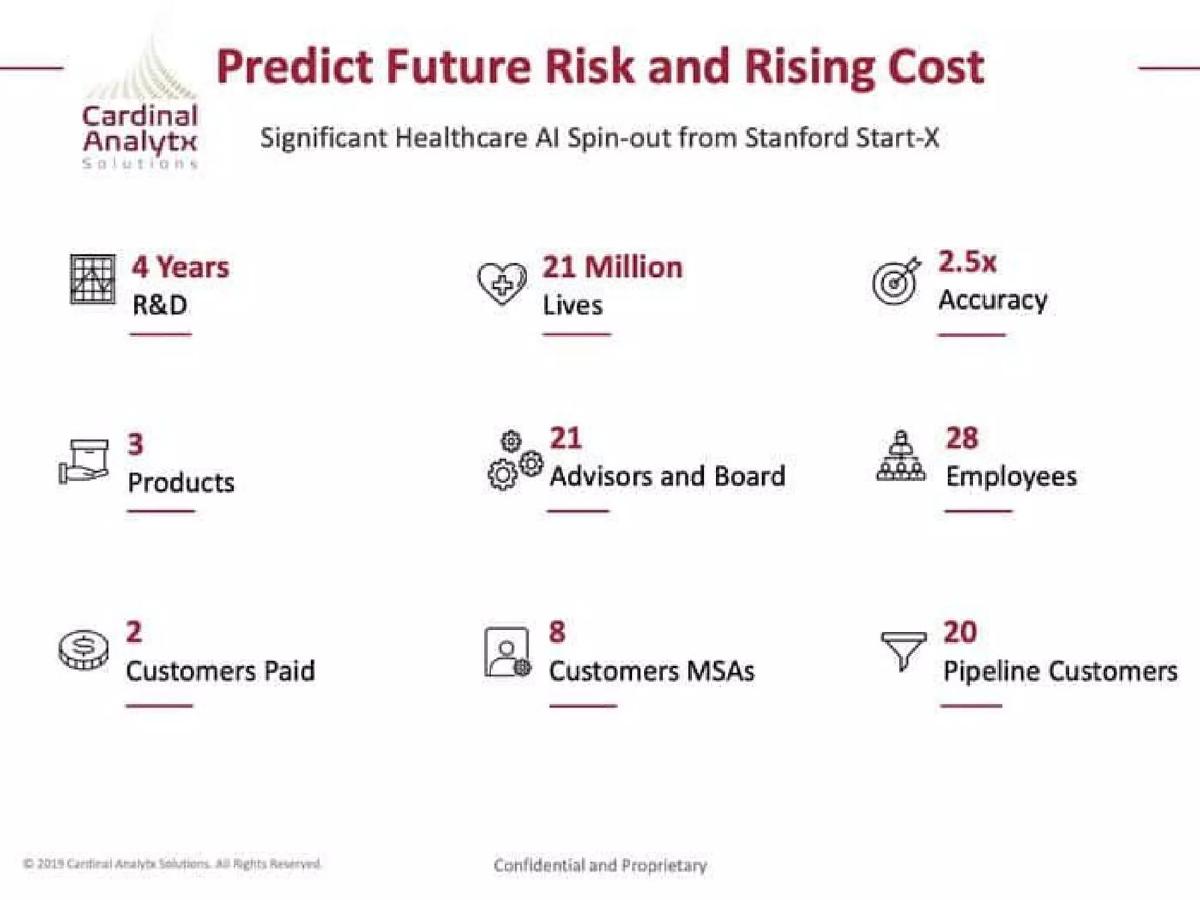
- The company highlights a 4-year R&D history and a 2.5x accuracy advantage to establish technical superiority (Slide 2).
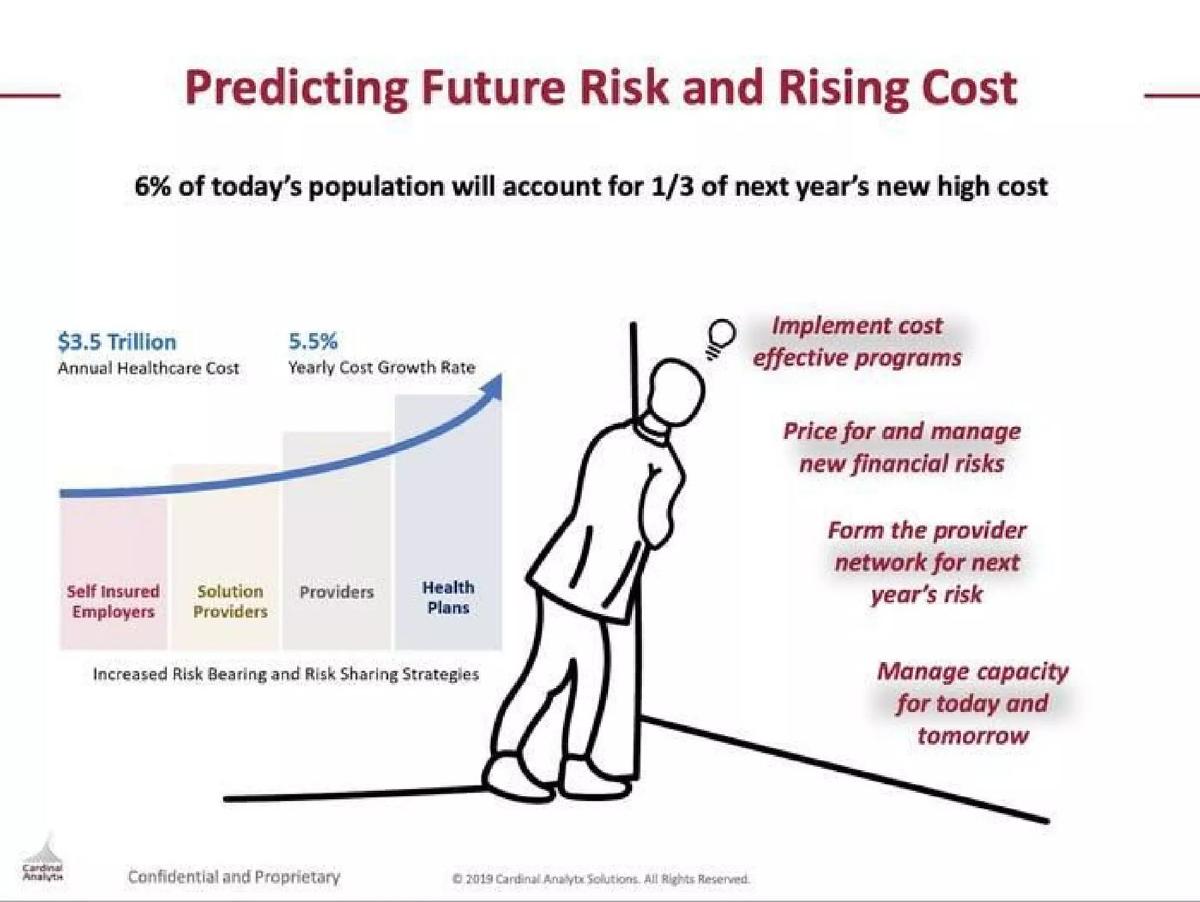
- A specific 'Cost Bloom' metric identifies that 6% of the population accounts for 1/3 of next year's new high costs (Slide 3).
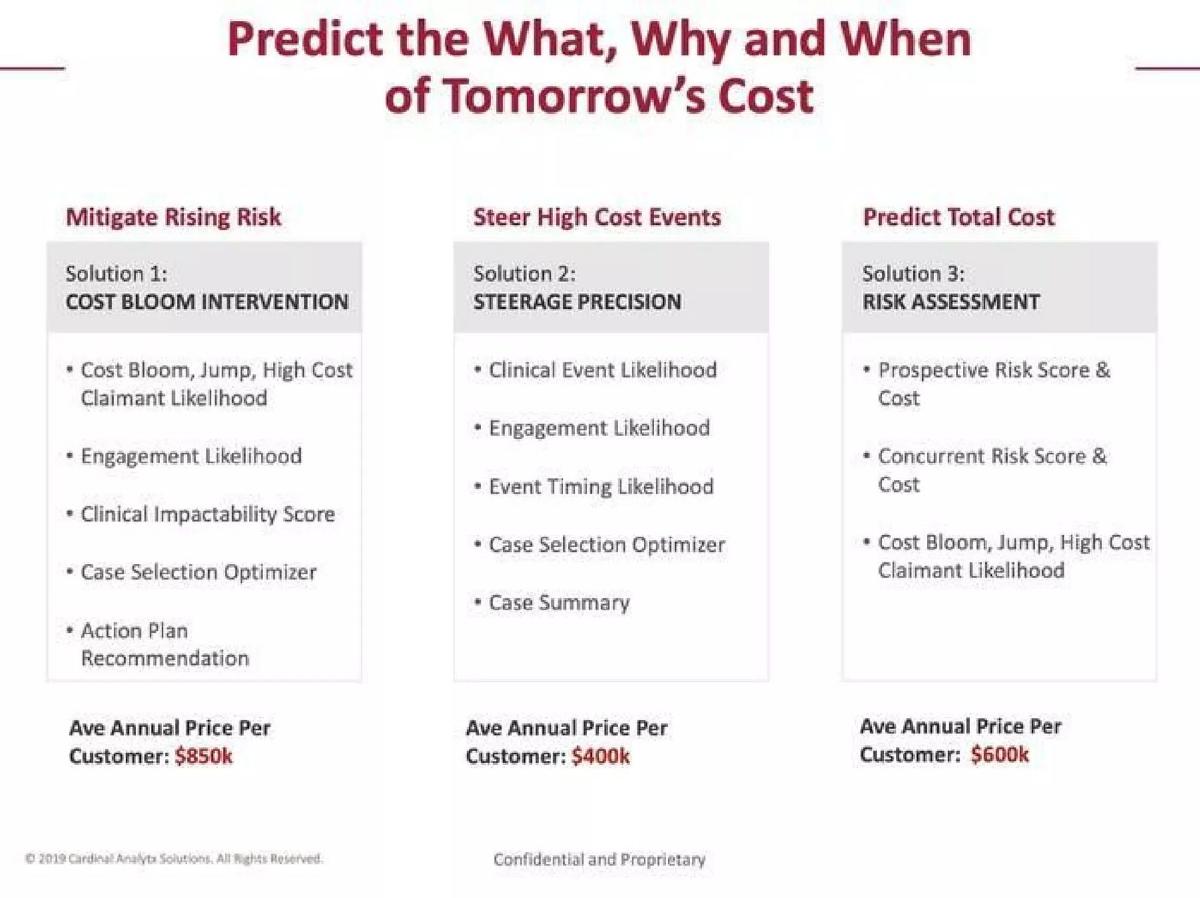
- The deck explicitly lists pricing for its three core products, ranging from $400k to $850k per customer (Slide 4).
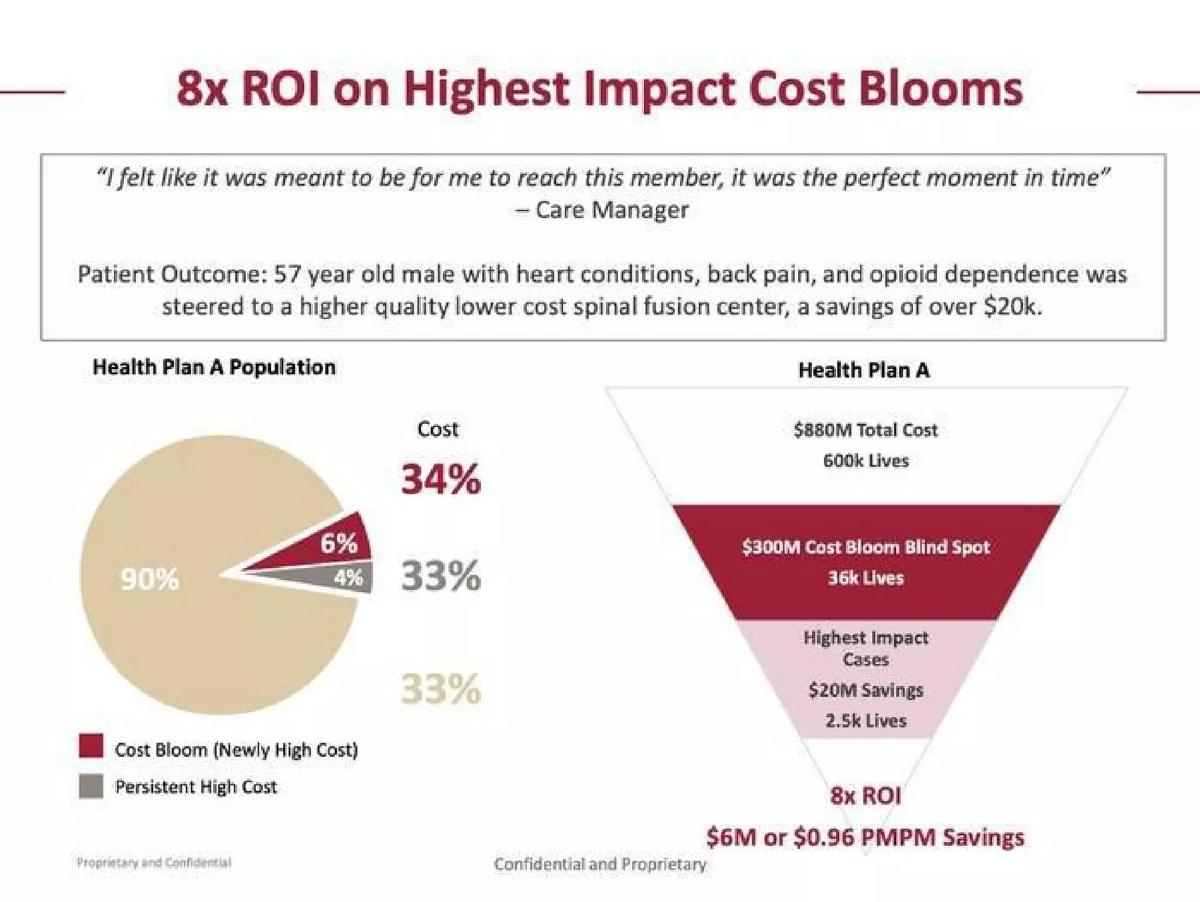
- Clinical validation is provided through a case study showing $6M in savings, or $0.96 PMPM, for a specific health plan (Slide 5).
- The company uses R-Squared metrics to demonstrate that its machine learning beats competitors like Optum (ERG) and Verscend (DxCG) across all data durations (Slide 8).
- The competitive landscape is categorized by 'Strategic Approaches,' placing the company in the most advanced 'ML Predictions with Drivers and Actions' tier (Slide 9).
- The board of directors includes high-profile figures such as John Doerr (Kleiner Perkins) and Elizabeth Spaulding (Bain & Company) (Slide 11).
- The investment roadmap projects a growth path from 11 clients in 2019 to 53 clients by 2021+ (Slide 13).
Executive Summary: The Data-Driven Series B
Prealize Health, operating under its former name Cardinal Analytx Solutions in this deck, presents a highly technical and results-oriented Series B pitch. With 13 slides, the deck avoids the common pitfall of over-explaining the healthcare crisis and instead focuses on the company's specific ability to solve a multi-trillion dollar problem through superior predictive accuracy. The deck is characterized by its heavy use of clinical metrics, R-squared values, and transparent pricing models, which is rare in early-to-mid-stage startup decks.
The Hook: Traction and Technical Pedigree
Slide 1: Title Slide The deck opens with the legacy branding 'Cardinal Analytx Solutions' and the tagline 'Better Care, Sooner.' It is a standard, clean title page with a confidentiality notice at the bottom.
Slide 2: Predict Future Risk and Rising Cost Instead of a traditional problem/solution narrative, slide 2 acts as a 'Company at a Glance' summary. It highlights the company as a 'Significant Healthcare AI Spin-out from Stanford Start-X.' Key metrics listed include 4 years of R&D, 21 million lives covered, 2.5x accuracy (relative to unnamed benchmarks here), 3 products, 2 paid customers, 8 MSAs, and a pipeline of 20 customers. This slide establishes immediate credibility by showing that the technology is not just theoretical but has been battle-tested over several years.
The Problem and Product Suite
Slide 3: Predicting Future Risk and Rising Cost This slide defines the 'Cost Bloom' problem. It states that 6% of today's population will account for 1/3 of next year's new high costs. It cites a $3.5 Trillion annual healthcare cost with a 5.5% yearly growth rate. The graphic illustrates the pressure on self-insured employers, solution providers, and health plans to manage capacity and price for new financial risks. This is the closest the deck gets to a 'Problem' slide, framing the issue as a financial risk management failure.
Slide 4: Predict the What, Why and When of Tomorrow's Cost This is one of the most transparent slides in the deck. It breaks down the three core products and, unusually, lists their average annual price per customer:
Solution 1: Cost Bloom Intervention - $850k. Focuses on high-cost claimant likelihood and clinical impactability. · Solution 2: Steerage Precision - $400k. Focuses on clinical event likelihood and case selection optimization. · Solution 3: Risk Assessment - $600k. Focuses on prospective and concurrent risk scores.
By putting price tags on the solutions, the company signals to investors that they have a validated sales model and a clear understanding of their contract value.
Validation and ROI Case Studies
Slide 5: 8x ROI on Highest Impact Cost Blooms This slide provides a deep dive into a case study for 'Health Plan A.' It uses a funnel graphic to show how they move from 600k lives ($880M total cost) down to 'Highest Impact Cases' (2.5k lives). The result is $20M in savings, yielding an 8x ROI. They also break this down to a Per Member Per Month (PMPM) savings of $0.96. The inclusion of a specific patient outcome—a 57-year-old male with heart conditions—adds a human element to the data.
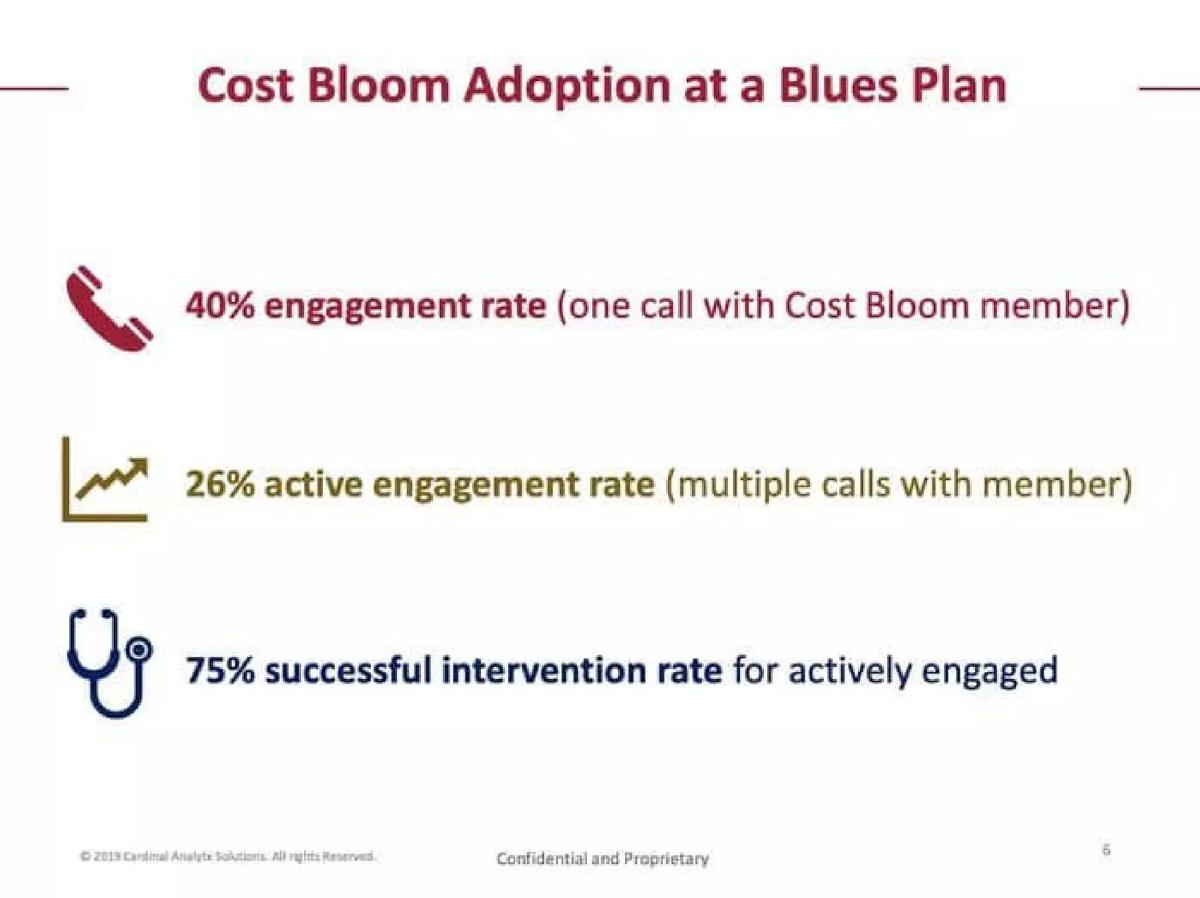
Slide 6: Cost Bloom Adoption at a Blues Plan This slide focuses on engagement metrics, which are critical in healthcare interventions. It claims a 40% engagement rate (one call), a 26% active engagement rate (multiple calls), and a 75% successful intervention rate for those actively engaged. This proves that the 'predictions' lead to actual clinical actions.
Slide 7: 6x ROI on Ortho Joint Surgery Steerage Further validation is provided for a specific clinical area: Orthopedics. It notes that 1/3 of cost blooms were ortho joint surgeries and projects $3.6M in savings for Health Plan A. It also identifies a market gap, noting that 50% of clients expressed interest in 'Steerage' and mentions partners like Vitals, Relay, and MOBE.
Competitive Advantage and Technical Superiority
Slide 8: $100M Through Increased Accuracy This is the 'moat' slide. It uses a bar chart to compare 'Prospective Risk Accuracy' (R-Squared) against industry giants DxCG (Verscend) and ERG (Optum). Prealize shows a consistent lead, reaching 31% accuracy with 12 months of data compared to 20% for Optum. The sidebar quantifies the cost of this inaccuracy: $63M in missed dollars from under-pricing risk and $37M from over-pricing/retention risk.
Slide 9: Strong Competitive Position The company maps the landscape based on 'Strategic Approaches.' They categorize competitors into four tiers, placing themselves in the top tier: 'Machine Learning Predictions with Drivers and Actions.' This differentiates them from 'Traditional Predictions' (Optum, Milliman, Lexis Nexis) and 'ML Predictions' (Lumiata, IBM Watson) by emphasizing that they don't just predict risk, but provide the 'drivers' to fix it.
The Team and Governance
Slide 10: Professional Team The executive team is led by CEO Linda Hand (35 years experience, exit of DecisionView to IMS Health). Other key members include Niall O'Cathasaigh (CFO), Brian Maples (VP of Data Science), Lu Lu (Head of Product), and Chris DeRienzo (Chief Medical Officer). The bios emphasize a mix of startup exits, clinical experience (MDs), and technical PhDs from Stanford.
Slide 11: Engaged Founders, Investors & Board This slide is a 'who's who' of healthcare and venture capital. Founders include Stanford professors Nigam Shah and Arnold Milstein. The investor list features Blue Shield of California and Florida Blue, indicating that their customers are also their backers. The board includes John Doerr (Kleiner Perkins) and Elizabeth Spaulding (Bain), which provides a massive amount of institutional signal for a Series B round.
Slide 12: Industry Leading Advisors The company lists 14 advisors categorized by Science, Industry, Health Plan, and Clinical. This reinforces the 'Stanford spin-out' pedigree and shows deep ties into the payer organizations they are selling to.
The Ask and Future Roadmap
Slide 13: Investment Opportunity The final slide is a roadmap from 2017 to 2021+. It details the funding history: a $6M Series A in 2017 and a $7M Series A Bridge in 2018. The current 'Series B New Money' is listed at $22M for 2019. The roadmap projects growth in FTEs (from 46 to 83), lives covered (from 26m to 50m), and clients (from 11 to 53). This slide clearly defines what the $22M will be used for: scaling from 'Market Fit' to 'Channel Partner Optimization.'
What Works in This Deck
Specific ROI Quantification: The deck doesn't just say they save money; it specifies $0.96 PMPM and 8x ROI. For healthcare payers, these are the only metrics that matter.
Direct Competitive Benchmarking: Slide 8 is incredibly bold. By naming Optum and Verscend and showing higher R-squared values, Prealize turns a technical metric into a compelling financial argument.
Pricing Transparency: Including the average annual price per customer (Slide 4) is a sophisticated move for a Series B deck. It shows the business model is mature and the sales team has a repeatable 'sticker price.'
Institutional Signal: The combination of Stanford founders, Blue Cross investors, and John Doerr on the board makes the 'execution risk' appear significantly lower to a new investor.
What Is Missing
Unit Economics: While the deck lists the 'price' per customer, it does not detail the 'cost to serve' or the Customer Acquisition Cost (CAC). For a Series B, investors usually want to see the LTV/CAC ratio.
Sales Cycle Details: Selling to 'Blues' plans is notoriously slow. The deck mentions a pipeline of 20 customers but doesn't explain the typical length of the sales cycle or the implementation timeline.
Product Visuals: The deck is very heavy on charts and text but lacks a single screenshot of the actual software interface. It remains unclear how a 'Care Manager' actually interacts with the data.
What a Founder Should Copy
The 'Company at a Glance' Slide: Slide 2 is a perfect example of how to front-load traction. If you have good numbers, don't hide them on slide 10.
The Roadmap of Lives: In healthcare, 'lives covered' is the standard unit of scale. Slide 13's progression of FTEs vs. Lives vs. Clients is a great way to show how the organization needs to grow to support its scale.
The 'Strategic Approaches' Matrix: Instead of a standard 'check-box' competitor grid, the matrix on slide 9 explains why the company is better based on their methodology (Predictions + Drivers + Actions), which is more persuasive than just listing features.
Frequently asked questions
- What is the core value proposition of Prealize Health?
- Prealize Health uses machine learning to predict 'cost blooms'—individuals who are currently low-cost but are likely to become high-cost in the near future. According to slide 3, 6% of the population accounts for 1/3 of next year's new high costs. By identifying these individuals early, health plans can intervene and reduce spending, as demonstrated by the $0.96 PMPM savings shown on slide 5.
- How does Prealize Health differentiate itself from incumbents like Optum?
- The company relies on a direct head-to-head accuracy comparison on slide 8. Using R-Squared as a measure of prospective risk accuracy, Prealize claims to significantly outperform DxCG (Verscend) and ERG (Optum). For example, with 12 months of data, Prealize shows a 31% accuracy rate compared to Optum’s 20%, translating to millions of dollars in correctly priced risk.
- What are the specific product offerings and their costs?
- Slide 4 outlines three distinct solutions: Cost Bloom Intervention ($850k average annual price), Steerage Precision ($400k average annual price), and Risk Assessment ($600k average annual price). Each product targets a different aspect of cost management, from identifying high-cost claimants to optimizing case selection for clinical interventions.
- Who are the key investors and board members mentioned in the deck?
- The company boasts a high-pedigree cap table and board. Slide 11 lists investors including Cardinal Partners, Premera Blue Cross, StartX, the John Doerr Family Fund, Blue Shield of California, and Florida Blue. The board features John Doerr (Chairman of Kleiner Perkins), Elizabeth Spaulding (Bain & Company), and several former healthcare executives.
- What is the projected growth trajectory for the company?
- According to the 'Investment Opportunity' timeline on slide 13, the company aimed to scale from 11 clients and 26 million lives covered in 2019 to 53 clients and 50 million lives by 2021. This growth was supported by a Series B 'New Money' injection of $22M intended to achieve market fit across segments and scale partnerships.