Predina presents a compelling case for the integration of location intelligence into auto insurance underwriting. The deck highlights a significant market pain point: rising accident claim costs, which reached an average of $207.06 in 2016. By analyzing over 14 million accident records alongside weather, traffic, and road geometry data, Predina claims to offer a more granular risk assessment than traditional zip-code-based models. The deck emphasizes that a mere 1% improvement in risk modeling translates to a $1.73 billion gain across the US market. While the deck successfully establishes the…
Key takeaways
- The deck identifies a massive market opportunity, noting that a 1% improvement in risk assessment equals $1.73BN for the US auto insurance market (Slide 10).
- Predina positions its technology as a 'compliment' to existing risk models, specifically filling the 'Where' gap currently limited to zip codes (Slide 9).
- The AI utilizes over 14 million accident records combined with spatio-temporal data like weather and road intersections (Slide 8).
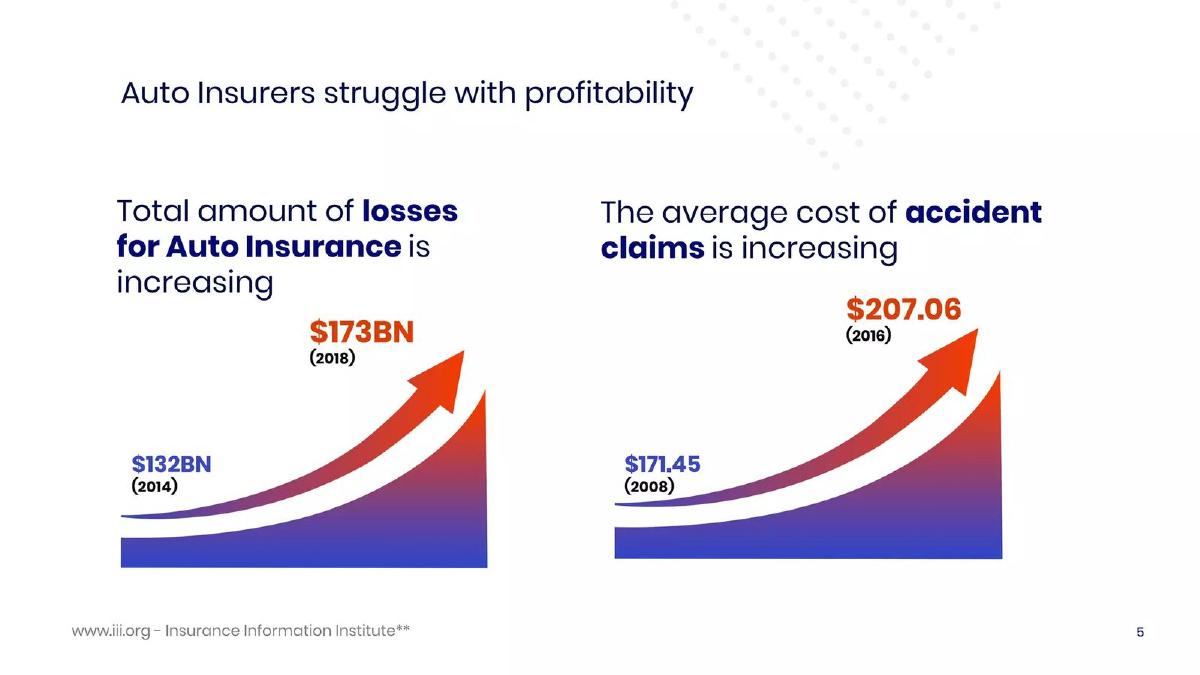
- Market pressure is established by showing total auto insurance losses rising from $132BN in 2014 to $173BN in 2018 (Slide 5).
- Average accident claim costs increased from $171.45 in 2008 to $207.06 in 2016 (Slide 5).
- The company demonstrates early traction with a leading US connected car manufacturer and the largest UBI insurer in the UK (Slide 11).
- The management team brings significant domain expertise, including a founder featured in Forbes 30 Under 30 for Mobility (Slide 12).
- The deck completely omits a financial ask, use of funds, or five-year revenue projections.
Executive Summary: The Data-Driven Shift in Insurance
Predina’s pitch deck is a focused narrative on the evolution of risk assessment. It moves quickly from the macro-economic pressures facing auto insurers to a granular technical solution. The deck is designed to convince an investor that the current 'zip code' approach to location risk is archaic and that Predina’s AI is the necessary upgrade for a multi-billion dollar industry struggling with profitability.
Slides 1-2: The Hook and the Vision
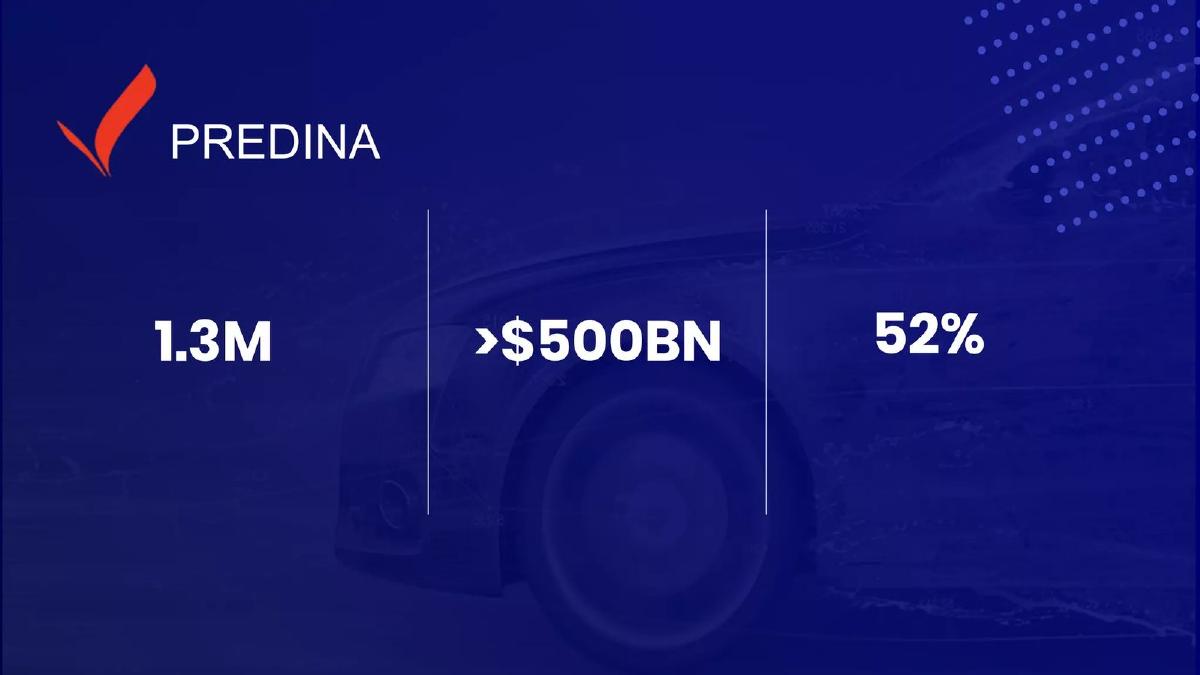
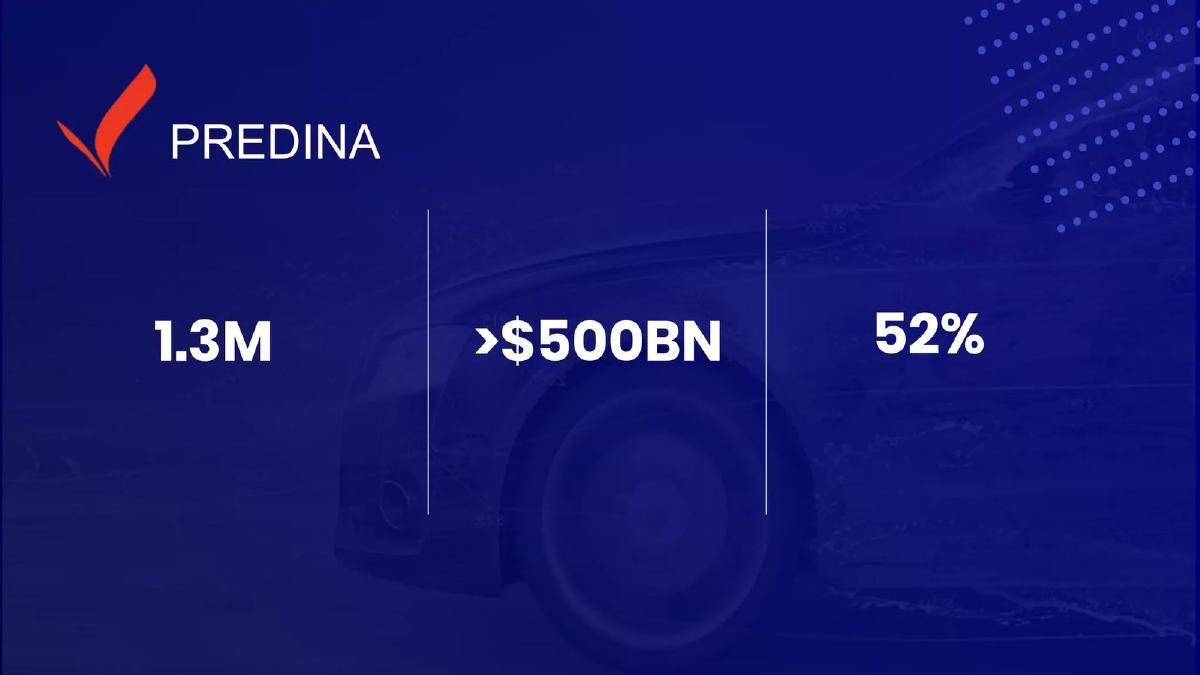
The deck opens with a minimalist title slide featuring three key figures: 1.3M , >$500BN , and 52% . While these aren't explicitly defined on slide 1, they set a tone of scale. Slide 2 introduces the core mission: "Location Intelligence to power the future of Auto Insurance." The branding is clean, using a dark blue palette that suggests stability and professional services.
Slides 3-4: The Current State of Telematics
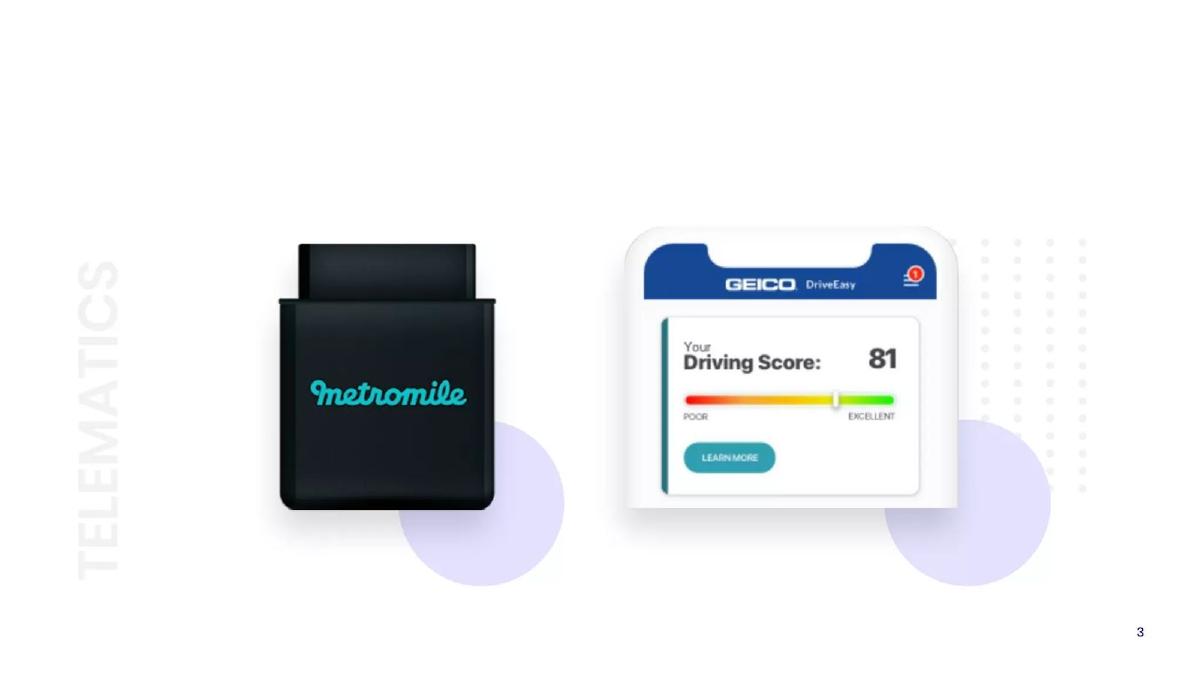
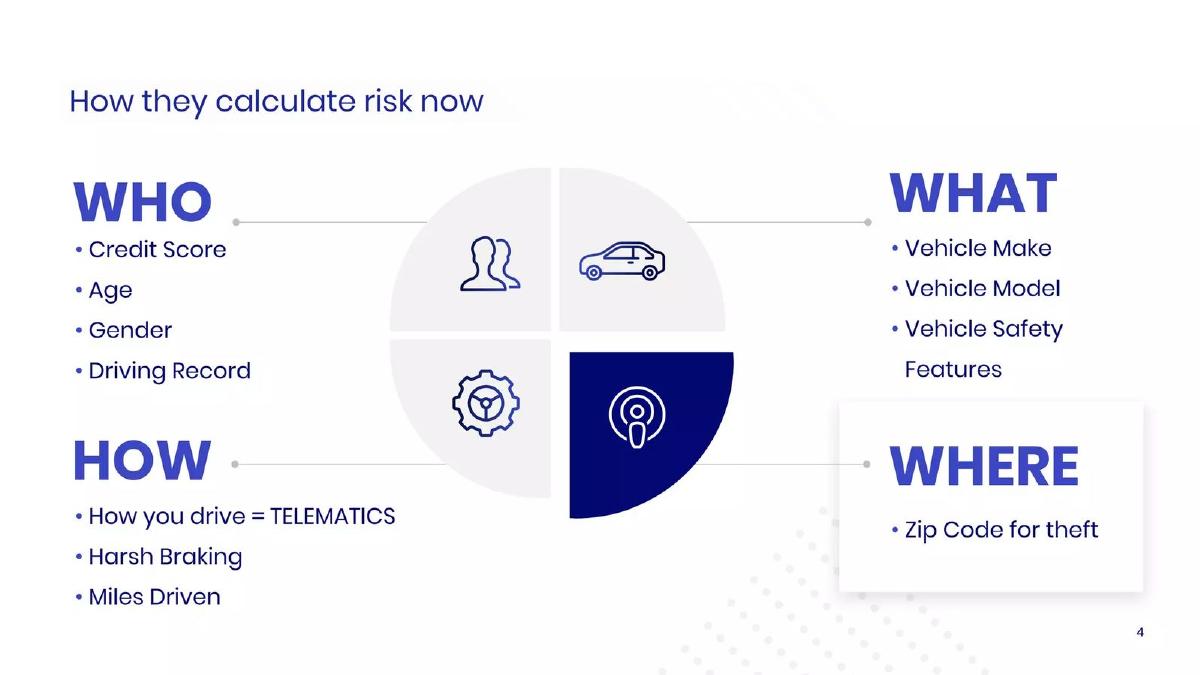
Slide 3 uses visual cues from Metromile and Geico's DriveEasy to establish the current market standard: telematics. Slide 4 breaks down the four pillars of current risk calculation: WHO (Credit score, age, gender), WHAT (Vehicle make/model), HOW (Telematics, harsh braking), and WHERE . Crucially, it points out that 'WHERE' is currently limited to "Zip Code for theft." This identifies the specific gap Predina intends to fill.
Slide 5: The Burning Platform
This slide establishes the 'Why Now?' by showing declining profitability in the sector. It cites the Insurance Information Institute, noting that total losses for Auto Insurance rose from $132BN in 2014 to $173BN in 2018 . Simultaneously, the average cost of accident claims rose from $171.45 in 2008 to $207.06 in 2016 . The message is clear: insurers are losing more money on more expensive accidents, and their current models aren't stopping it.
Slides 6-7: The Solution - Location Risk
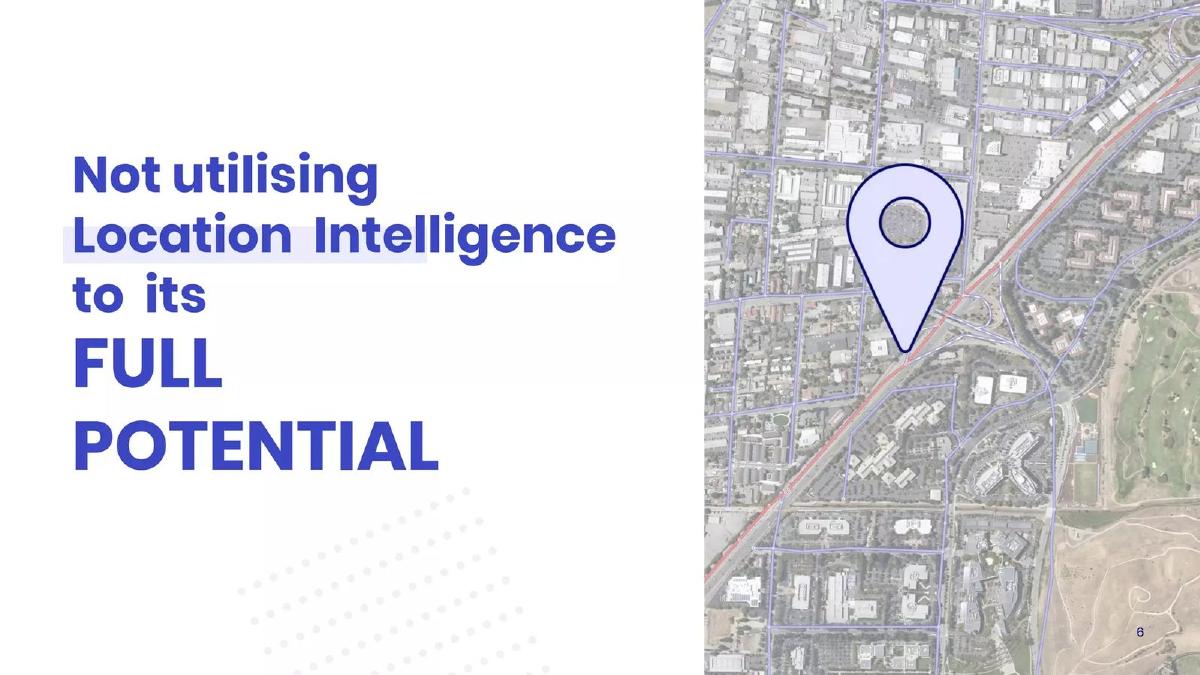
Slide 6 explicitly states the failure: "Not utilising Location Intelligence to its FULL POTENTIAL." Slide 7 introduces the product interface—a map of the San Francisco Bay Area showing a route color-coded by risk levels: Safer , Medium safe , Caution , and Hotspot . This visualizes the 'missing piece' of location risk in real-time.
Slide 8: The Data Engine
This is the technical heart of the deck. Predina claims their AI learns from >14 Million Accident Data points, Weather Data , and Road Intersections . It categorizes data into three layers: Near Field (Road features, geometry, traffic volumes), Far Field (Amenities, weather), and Environment (Events, holidays, historic accidents). This slide demonstrates the complexity and depth of their proprietary model.
Slides 9-10: The Value Proposition
Slide 9 revisits the four-quadrant risk model from slide 4, now showing the Predina logo occupying the 'WHERE' quadrant. Slide 10 provides the 'Big Number' for investors: 1% improvement = $1.73BN . By linking their potential impact to the $173BN in total market losses cited earlier, they create a clear, quantifiable ROI for their software.
Slide 11: Traction and Momentum
The company highlights three key milestones achieved in "less than 6 months." These include partnerships or pilots with a Leading Series B Insurtech UK , the Largest UBI Insurer in UK , and a Leading US Connected Car Manufacturer . Using the UK and US flags emphasizes their global ambitions and cross-market applicability.
Slide 12: The Management Team
The team slide emphasizes deep domain expertise. Bola Adegbulu (CEO) is noted as a Forbes 30 Under 30 in Mobility and founder of a previous telematics startup. Guy Barbor (BD) brings 20 years of experience and two exits in the fleet/telematics space. Carlo Corsario (CTO) holds a PhD and background in satellite imagery AI. The summary claim is 20+ years experience across automotive data and AI.
What Predina Does Well
The deck is exceptionally good at problem framing . By isolating the 'Where' component of risk and showing how limited it currently is (zip codes for theft only), they make their solution feel like an obvious necessity rather than a luxury. The use of the 1% improvement metric is a classic and effective way to demonstrate market size without relying on generic TAM/SAM/SOM slides that investors often ignore.
What is Missing from the Deck
Despite the strong narrative, the deck is incomplete as a fundraising tool. There is no financial ask —we don't know if they are raising $1M or $10M. There is no roadmap showing what the next 18-24 months look like. Most importantly, there is no business model slide . It is unclear if they charge per API call, per policy written, or a flat annual license fee. Finally, the competitive landscape is ignored; while they mention Metromile and Geico as examples of the current state, they don't address other AI-driven risk scoring startups that might be competing for the same insurer budgets.
Founder Takeaways: Copy the Logic, Add the Detail
Quantify the 'Small' Win: Showing that a 1% improvement leads to billions in savings is more credible than claiming you will capture 10% of a trillion-dollar market. · The 'Missing Piece' Visual: Using a quadrant or pie chart to show exactly where your product fits into an existing workflow (Slide 9) helps investors understand your integration strategy immediately. · Layered Data Explanation: If you are an AI company, don't just say 'AI.' Break down the data sources into logical categories (Near Field, Far Field, Environment) as seen on Slide 8 to build technical credibility. · Don't Forget the Ask: Always include a slide detailing how much you are raising and what specific milestones that capital will unlock.
Frequently asked questions
- What specific problem is Predina solving for insurers?
- Predina addresses the inaccuracy of current 'Where' risk factors in insurance modeling. While insurers currently use zip codes primarily to assess theft risk, Predina uses AI to analyze dynamic factors like road geometry, traffic volume, and weather. This helps insurers price policies more profitably by identifying specific 'hotspots' and times of high accident risk that traditional static models miss.
- How does Predina's data set differ from standard telematics?
- Telematics focuses on 'How' a person drives (harsh braking, miles driven). Predina focuses on the environment. Their AI learns from over 14 million accident records and layers in 'near field' data (road features), 'far field' data (weather, amenities), and 'environment' data (holidays, events) to predict the likelihood of an accident at a specific location and time.
- What is the stated value proposition for a 1% increase in model accuracy?
- According to slide 10, a 1% improvement in risk modeling accuracy across the US auto insurance market for 2018 would result in a $1.73 billion benefit. This figure is derived from the total losses in the sector, which the deck states reached $173 billion that same year.
- Who are Predina's early partners or customers?
- Slide 11 indicates that within a six-month period, Predina engaged with three major entities: a 'Leading Series B Insurtech UK', the 'Largest UBI (Usage-Based Insurance) Insurer in the UK', and a 'Leading US Connected Car Manufacturer'. The deck does not name these companies specifically, which is common in early-stage decks involving sensitive B2B partnerships.
- What is missing from this pitch deck that an investor would need?
- The deck is missing several critical components for a formal investment round: a specific funding ask (how much money they want), a 'Use of Funds' slide (how they will spend it), a detailed competitive analysis (who else is doing AI risk scoring), and financial projections (revenue targets for the next 3-5 years).