Cove Capital Investments’ deck for its Opportunistic Income Fund 75 is a highly specialized real estate private placement memorandum (PPM) summary. The fund seeks to raise $100,000,000 to acquire a diversified portfolio of net lease, multifamily, and industrial assets without the use of debt. The primary hook is a targeted 10.00% preferred return with monthly ACH distributions. The deck relies heavily on the firm's track record, citing $452M in sponsored transactions and 81 properties across the U.S. It utilizes detailed case studies of 'full cycle' investments, such as a Winston-Salem indust…
Key takeaways
- The fund is targeting a $100,000,000 offering size for accredited investors under Regulation D, Rule 506 C (Slide 1).
- A core differentiator is the 'All-Cash/Debt-Free' acquisition strategy, intended to eliminate lender foreclosure risk (Slide 2).
- Investors are offered a targeted 10.00% preferred return with monthly distributions via ACH (Slide 2).
- The sponsor, Cove Capital, reports a track record of $452M in sponsored transactions across 81 properties (Slide 3).
- The fund requires a minimum investment of $25,000, making it accessible to a broader range of accredited individuals (Slide 2).
- Case studies highlight historical performance, such as the Cove Missoula Multifamily DST which provided distributions throughout the COVID-19 pandemic (Slide 4).
- The deck lists seven 'Full Cycle' summaries as of January 2023, with average annualized returns ranging from 5.57% to 18.29% (Slide 8).
- The strategy focuses on diversified assets including net lease, industrial, and multifamily properties across multiple U.S. markets (Slide 2).
Cove Opportunistic Income Fund 75: A Deep Dive into the $100M Debt-Free Strategy
The pitch deck for Cove Opportunistic Income Fund 75, LLC, is a structured presentation designed for accredited investors looking for real estate exposure without the traditional risks associated with leverage. The deck serves as a summary for a Private Placement Memorandum (PPM), emphasizing stability, monthly income, and a track record of successful exits.
Slide 1: Cover and Executive Summary
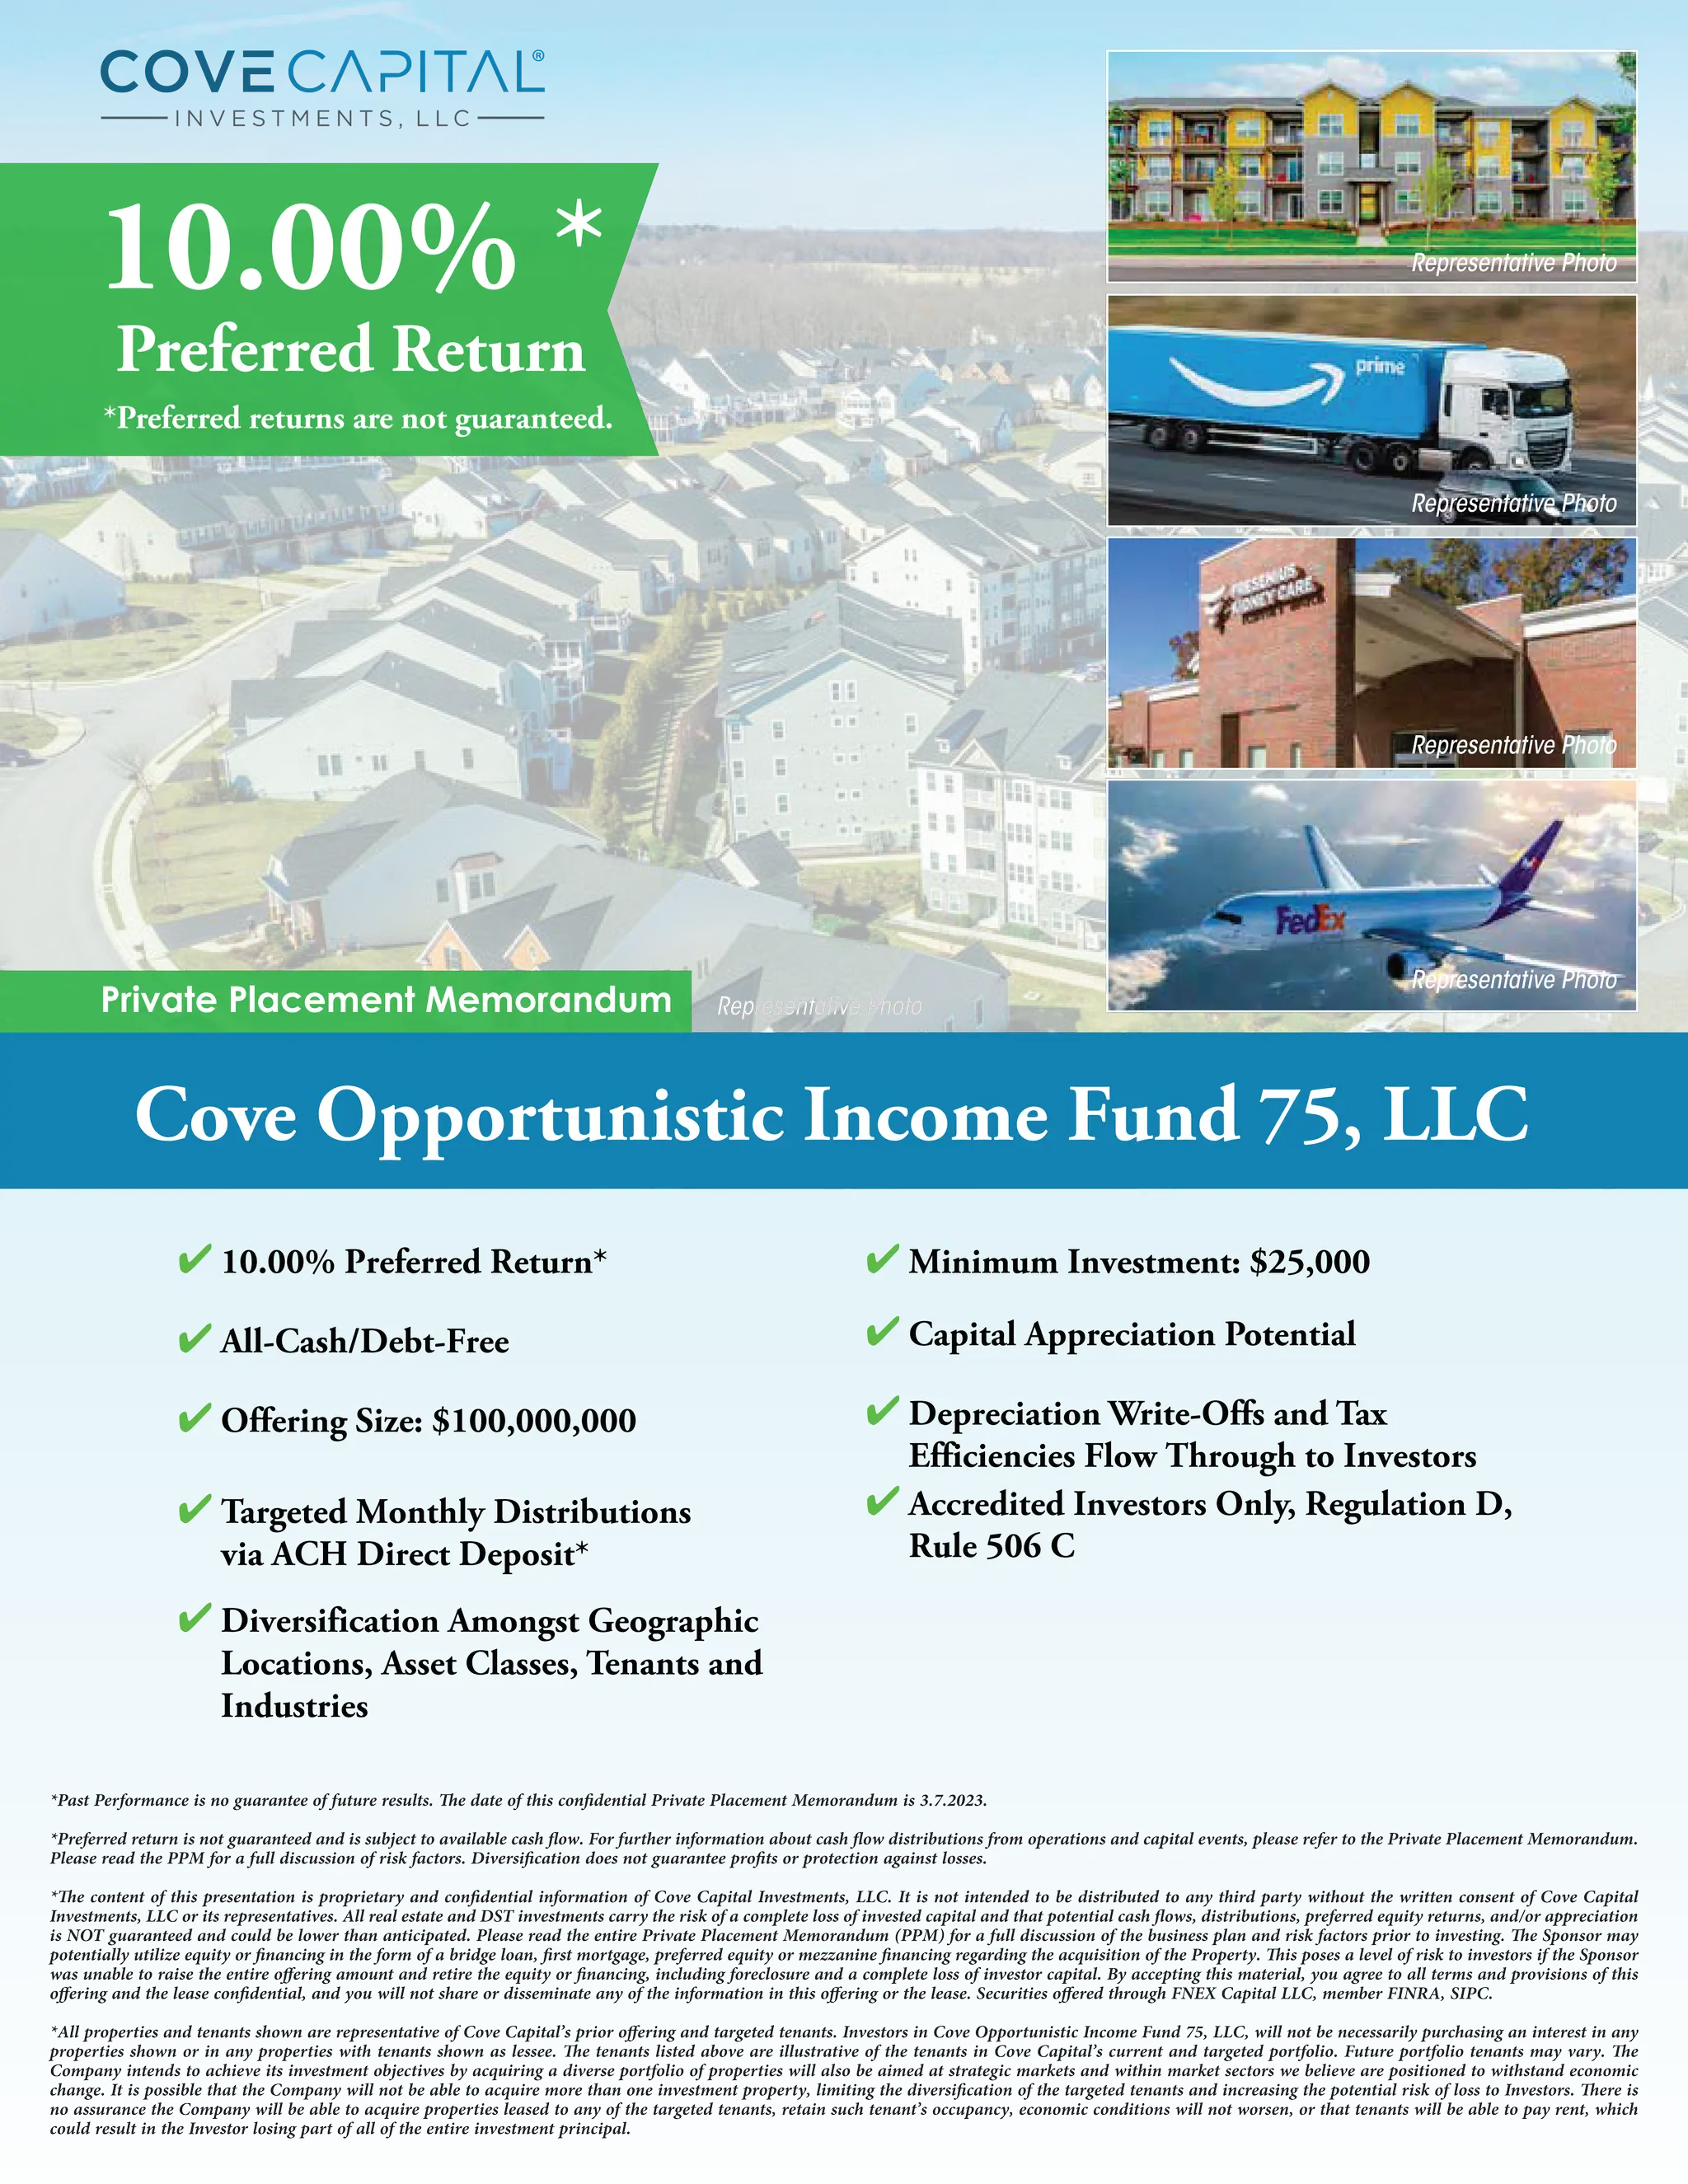
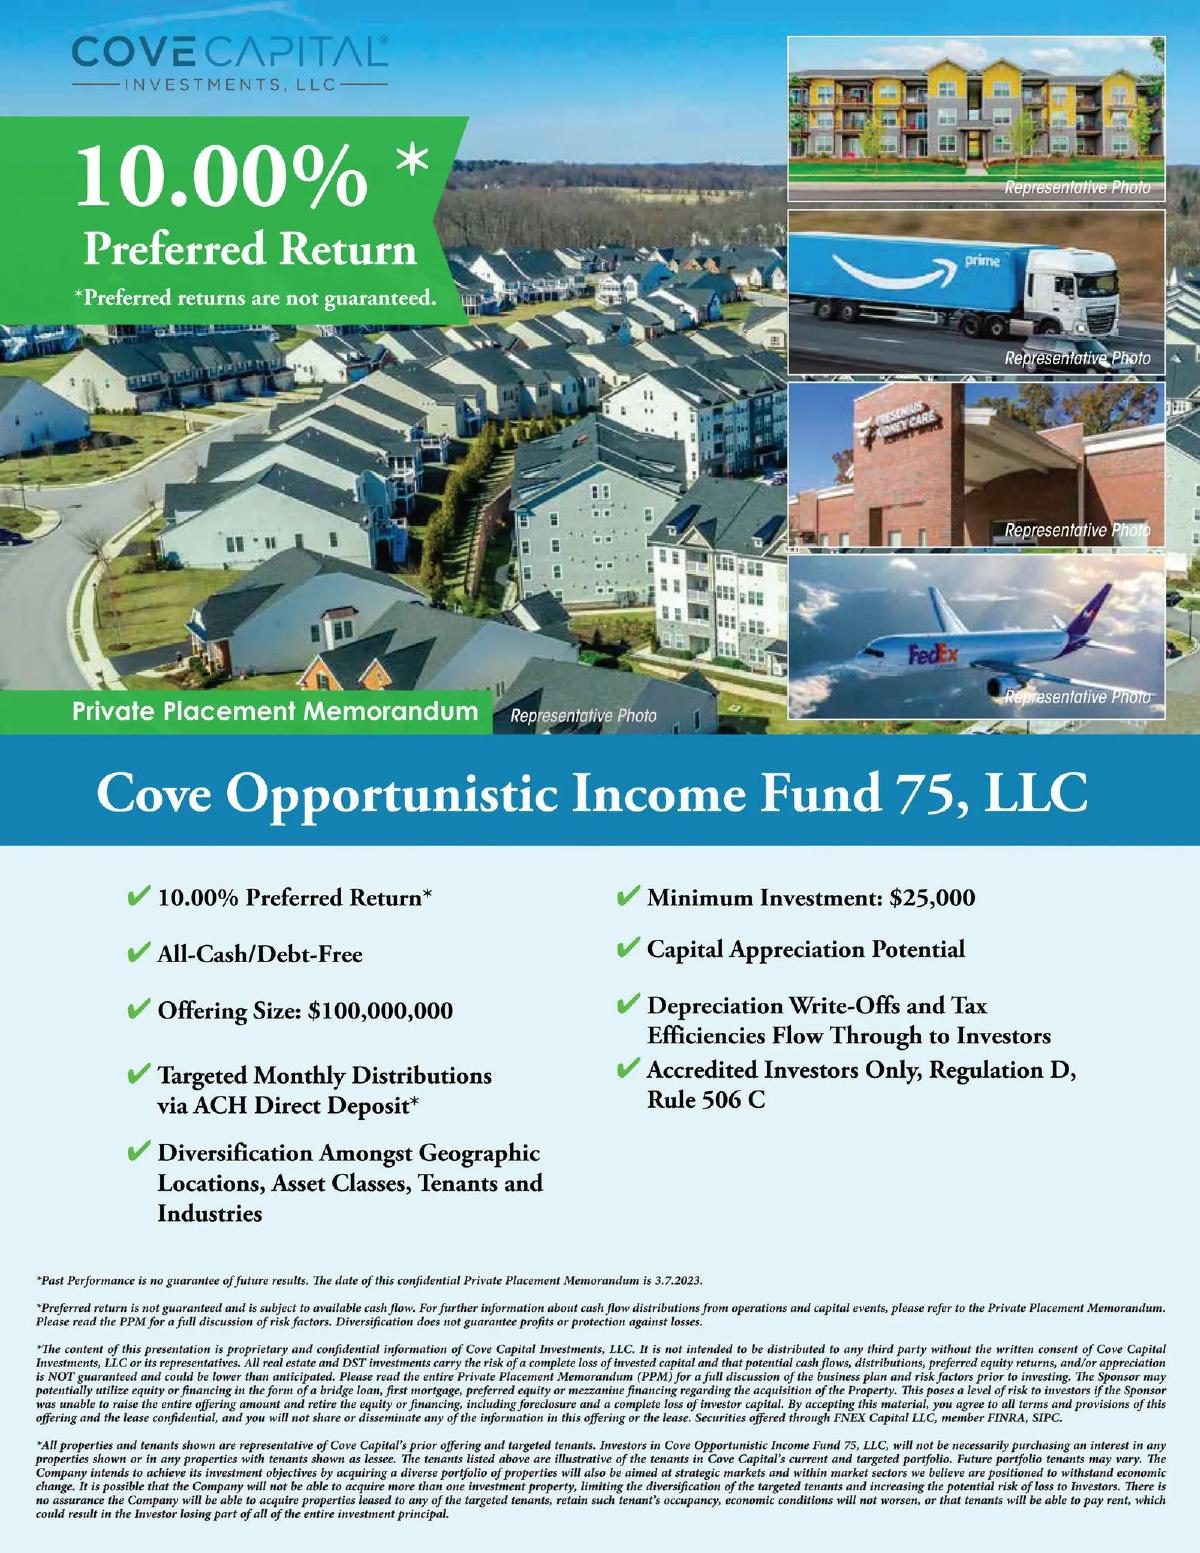
The opening slide establishes the primary value proposition: a 10.00% Preferred Return . It identifies the vehicle as the "Cove Opportunistic Income Fund 75, LLC" and specifies that it is a Private Placement Memorandum. The slide uses "Representative Photos" of multifamily housing, industrial logistics (Amazon and FedEx), and healthcare facilities (Fresenius Kidney Care) to signal the types of assets the fund targets. A checklist of highlights includes an Offering Size of $100,000,000 , a Minimum Investment of $25,000 , and the fact that the fund is All-Cash/Debt-Free . It also notes the regulatory framework: Accredited Investors Only, Regulation D, Rule 506 C.
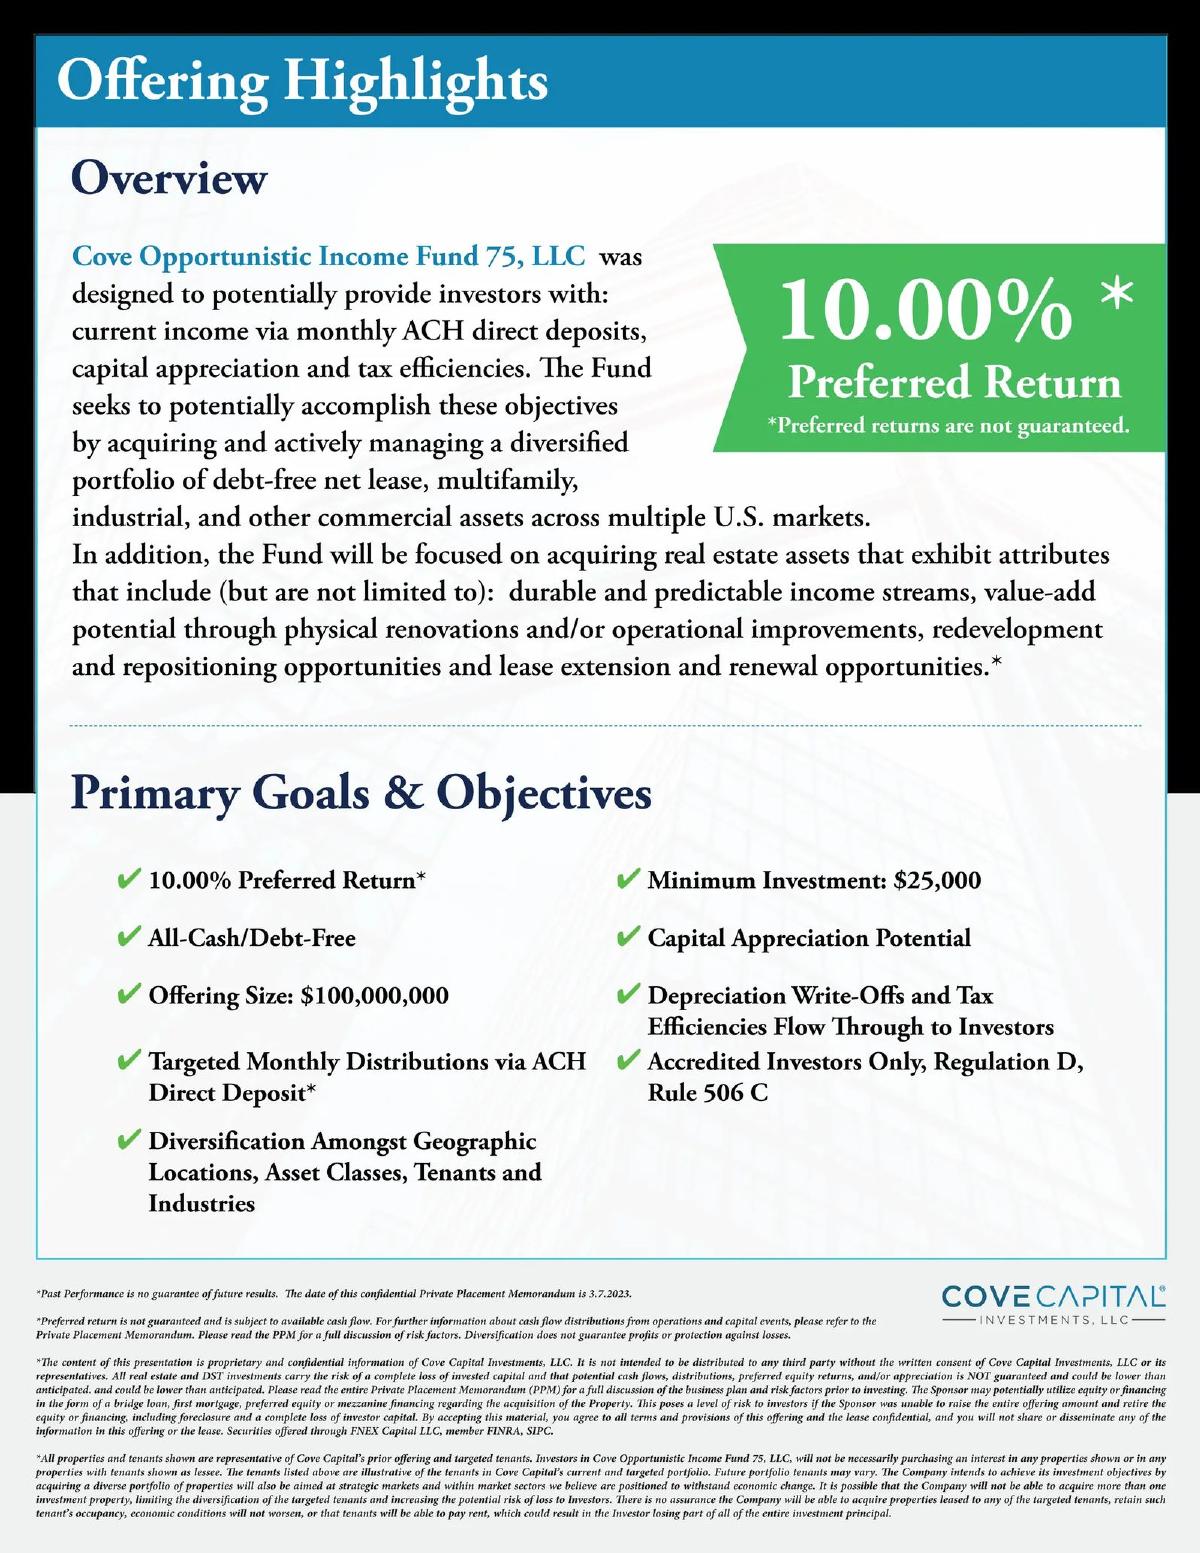
Slide 2: Offering Highlights and Objectives
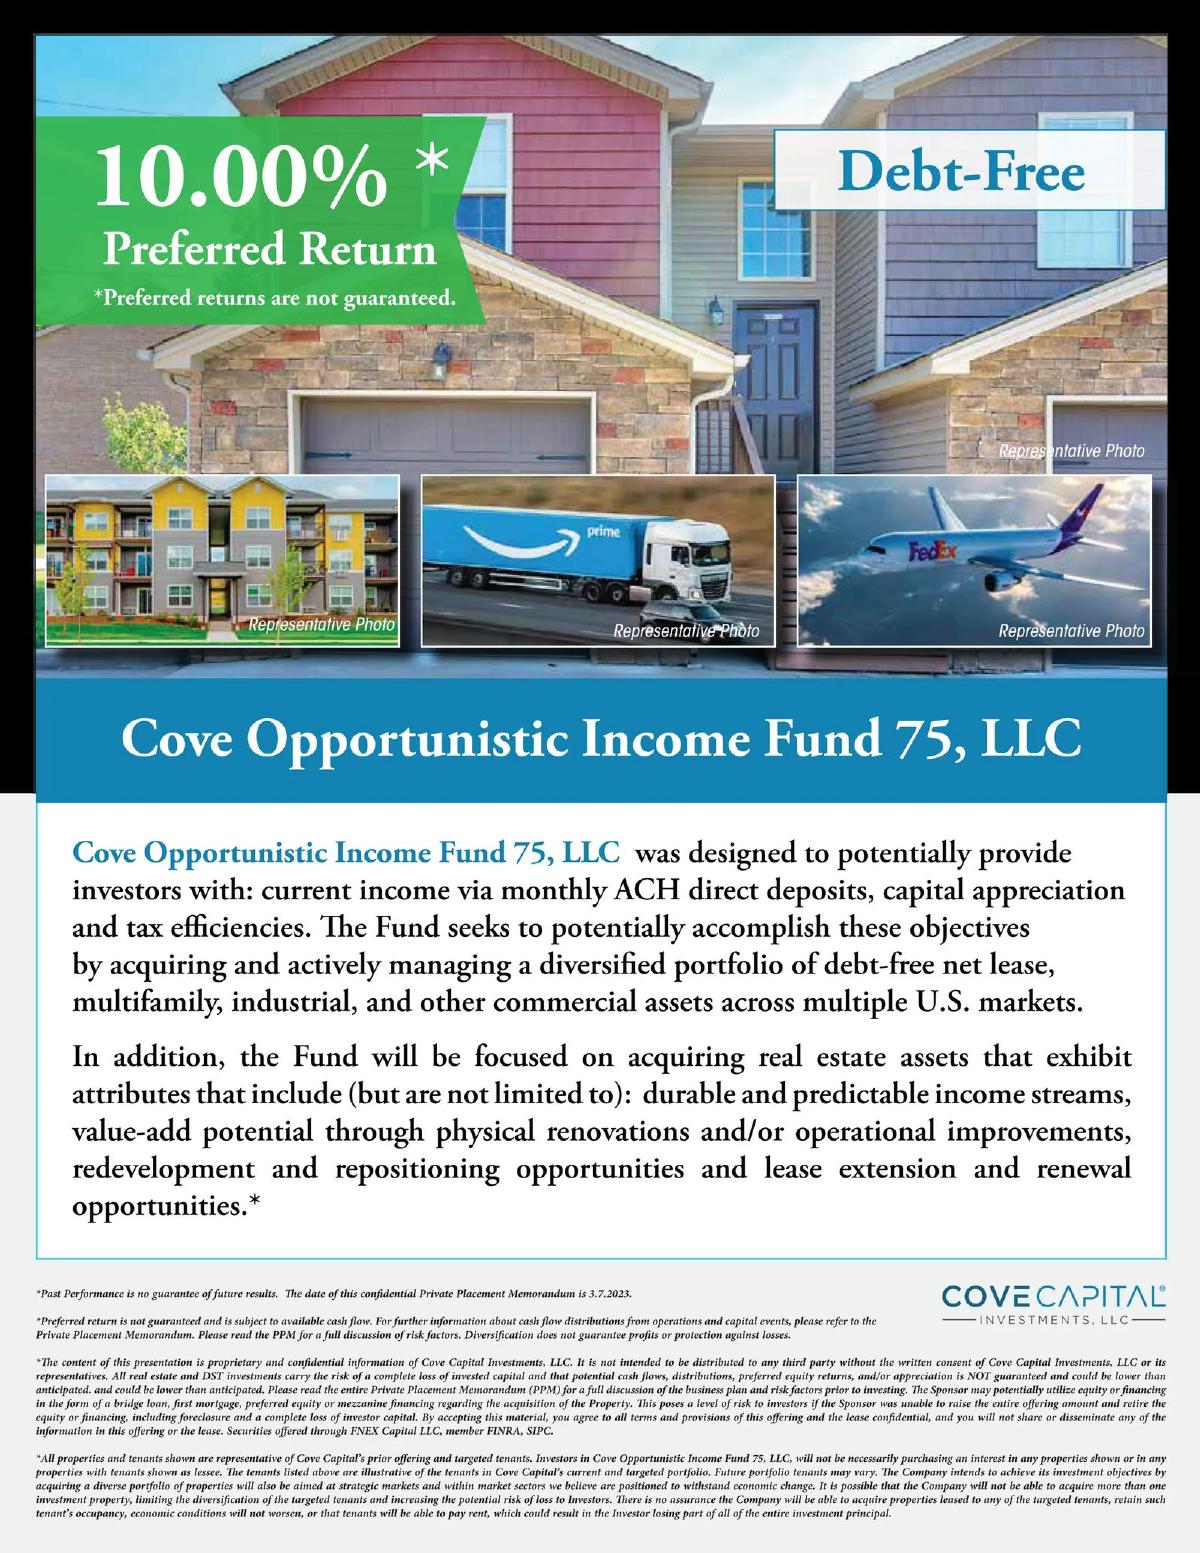
This slide expands on the fund's design. It states the fund is intended to provide current income via monthly ACH deposits, capital appreciation, and tax efficiencies. The strategy involves acquiring and actively managing a diversified portfolio of net lease, multifamily, and industrial assets across multiple U.S. markets. Key objectives listed include durable income streams, value-add potential through renovations, and repositioning opportunities. The slide reiterates the 10.00% preferred return target and the debt-free nature of the acquisitions, which is a central pillar of the Cove Capital pitch.
Slide 3: Cove Capital Portfolio Overview
To build credibility, Slide 3 presents the firm's aggregate metrics as of February 9, 2023. It claims $452M in Sponsored Transactions , 1,924,629 Square Feet of real estate sponsored, and 81 Properties in the portfolio. A map of the United States shows a wide geographic distribution of assets, with clusters in the Southeast, Midwest, and Pacific Northwest. This slide functions as the "traction" slide, proving that the sponsor has the infrastructure to manage a $100M fund.
Slide 4: Case Study - Missoula Multifamily DST
Slide 4 transitions into specific performance narratives. It details the "Cove Missoula Multifamily DST," a debt-free offering. The text highlights that this asset provided monthly distributions throughout the entire COVID-19 pandemic. It quotes Co-Founder Chay Lapin, who describes the asset as a "turnkey multifamily asset located in a highly desirable location." The slide emphasizes that the lack of debt mitigated risk during market volatility, allowing for a "contrarian approach" compared to leveraged models.
Slide 5: Case Study - Cove Greenville 17 DST
This slide focuses on a net lease asset, the "Cove Greenville 17 DST." The property was 100% occupied and secured by a long-term, absolute NNN lease that was corporately backed. The narrative emphasizes "risk adjusted durable income" and "risk mitigation via a debt-free offering with no balloon mortgage." This case study is used to illustrate the fund's ability to secure high-quality tenants and maintain high occupancy rates.
Slide 6: Case Study - Tacoma Data Center DST
Slide 6 highlights a specialized asset class: data centers. The "Cove Debt-free Tacoma Data Center DST" was acquired in December 2018 for $8,398,000. It was 100% leased to a Fortune 500 company providing dialysis treatments. The slide notes the building is an 18,733-square-foot facility in the Seattle-Tacoma region. This example serves to demonstrate the diversity of Cove's acquisition capabilities beyond standard retail or residential properties.
Slide 7: Full Cycle Exit - Winston-Salem Industrial
This slide announces a "Successful Return" for an industrial distribution facility in Winston-Salem, NC. The property went "full cycle," meaning it was bought, managed, and sold. The deck reports a 126.72% total return , or a 7.19% annualized return . The property was 100% leased to an investment-grade tenant with a BBB rating by Standard & Poor’s. This slide is critical for proving that the "debt-free" strategy can still produce significant total returns upon exit.
Slide 8: Full Cycle Summary as of January 2023
The final slide in this selection provides a table of seven full-cycle exits. The data points include:
Cove Greenville 17: 12.60% Average Annualized Return; 121.57% Total Return. · Cove Winston-Salem: 7.19% Average Annualized Return; 126.72% Total Return. · Cove Missoula Multifamily: 18.29% Average Annualized Return; 149.21% Total Return. · Cove Airport Distribution 21: 12.37% Average Annualized Return; 121.08% Total Return. · Cove Acquisition Fund 1: 7.00% Average Annualized Return; 109.80% Total Return. · Cove Dulles Distribution: 8.67% Average Annualized Return; 126.44% Total Return. · Cove Tacoma Data Center: 5.57% Average Annualized Return; 116.90% Total Return.
This summary slide provides the hard data necessary to back up the qualitative claims made in the preceding case studies.
What Cove Capital Does Well
The deck is exceptionally clear about its unique selling proposition (USP) : debt-free real estate investing. In a market where most real estate funds rely on high leverage to juice returns, Cove Capital leans into the safety and stability of all-cash acquisitions. This is a powerful message for conservative accredited investors or those looking to hedge against rising interest rates.
The use of specific case studies (Slides 4-7) provides a tangible look at what the fund actually buys. Rather than speaking in abstractions, they show the buildings, name the locations, and describe the tenant profiles. This transparency builds trust. Furthermore, the Full Cycle Summary (Slide 8) is a masterclass in providing proof of concept. By listing multiple exits with varying return profiles, they show a consistent ability to return capital to investors.
What is Missing from the Deck
Despite the wealth of property data, the deck is noticeably light on team biographies . While Co-Founders Chay Lapin and Dwight Kay are mentioned in quotes, there are no slides detailing their professional backgrounds, previous firm experience, or the size of the supporting team. For a $100M fund, investors usually want to see the pedigree of the people managing the money.
There is also a lack of market macro-analysis . The deck assumes the investor already wants real estate and simply needs to choose a fund. It does not provide data on why industrial or multifamily is a good bet in 2023 specifically, or how the current economic climate (inflation, interest rates) affects their specific strategy beyond the general benefit of being debt-free.
Finally, the fee structure is omitted from these slides. While likely contained in the full 32-slide deck or the PPM, the summary slides do not mention management fees, acquisition fees, or the sponsor's promote. For an "opportunistic" fund, understanding the alignment of interests is crucial.
Founder Takeaways: Copy the Proof, Not the Text
Founders in the real estate or fintech space should look at Slide 8 as a template for track record reporting . It is clean, data-rich, and uses imagery to make the numbers feel real. The use of a "Representative Photo" disclaimer is also a necessary legal touch that founders often forget when using stock imagery or similar assets.
However, founders should avoid the text-heavy layout seen in Slides 4, 5, and 6. These slides read more like press releases than pitch deck slides. In a live presentation, this much text is distracting. A better approach would be to use large-scale imagery of the property with 3-4 bullet points of the key financial outcomes, leaving the narrative for the speaker or the appendix.
The clear call to action and terms on Slide 1 and 2 is something every deck should emulate. Within 60 seconds of opening the file, a potential investor knows the target return, the minimum check size, and the regulatory requirements. This efficiency respects the investor's time and filters out non-qualified leads immediately.
Frequently asked questions
- What is the primary investment strategy of Cove Fund 75?
- The fund focuses on acquiring a diversified portfolio of debt-free net lease, multifamily, industrial, and other commercial assets. By operating all-cash and debt-free, the fund aims to provide durable income streams and eliminate the risk of lender foreclosure, while also seeking value-add potential through renovations or repositioning.
- Who is eligible to invest in this fund?
- According to Slide 2, the offering is limited to Accredited Investors only, as defined under Regulation D, Rule 506 C. The minimum investment threshold is set at $25,000, which is relatively low for private real estate equity funds of this size.
- What are the targeted returns for investors?
- The deck prominently features a targeted 10.00% preferred return. It also mentions potential for capital appreciation and tax efficiencies, such as depreciation write-offs that flow through to the investors. However, the deck repeatedly notes that these returns are not guaranteed and are subject to cash flow.
- How does the fund handle distributions?
- Cove Capital targets monthly distributions to investors. These are paid out via ACH direct deposit. The deck highlights that historical investments, like the Missoula Multifamily DST, maintained these distributions even during volatile periods like the COVID-19 pandemic.
- What is Cove Capital's historical track record?
- As of February 9, 2023, Cove Capital reported $452 million in sponsored transactions, covering over 1.9 million square feet of real estate across 81 properties. Slide 8 lists seven specific 'Full Cycle' exits with total returns ranging from 109.80% to 149.21%.