Bliss.ai successfully raised a $750,000 Seed round in 2015 using a 14-slide deck that targeted a specific pain point: the lack of visibility into code quality for non-technical stakeholders and engineering managers. The deck stands out for its strong traction metrics, reporting an $84,000 annual revenue run rate and 90% margins just months after launch. By positioning technical debt as a measurable business risk rather than just a developer grievance, Bliss.ai created a compelling case for a management-level dashboard. While the deck lacks a formal market size (TAM) slide, it compensates with…
Key takeaways
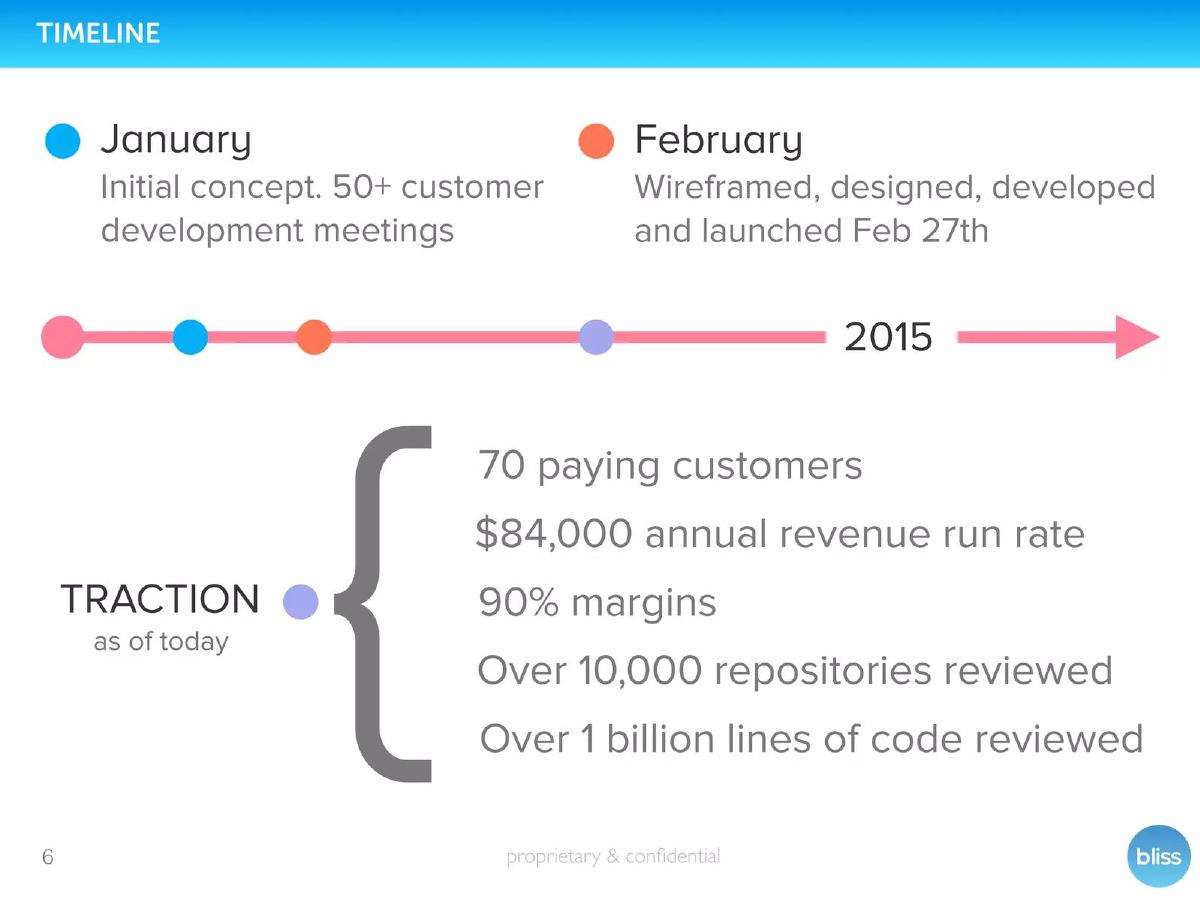
- The company reported an $84,000 annual revenue run rate with 70 paying customers by mid-2015 (Slide 6).
- Bliss.ai claims a 90% margin on its service, highlighting the efficiency of its automated analysis (Slide 6).
- The product analyzed over 1 billion lines of code across 10,000 repositories by the time of the pitch (Slide 6).
- The revenue model features a clear split between self-service website tiers ($29-$249/mo) and enterprise pricing starting at $1,500/mo (Slide 9).
- The deck identifies a 'huge disparity' between the growth of software and the growth of developer talent as a primary market driver (Slide 13).
- The financing slide explicitly states that $500k of the $750k round was already committed at the time of the pitch (Slide 11).
- Bliss.ai positions itself in the 'Business-side' and 'Manager' quadrant of the ecosystem, contrasting with developer-focused tools like RuboCop (Slide 10).
- The team slide highlights prior exit success, noting the CTO's previous company was acquired with a 4x return to investors (Slide 12).
Bliss.ai: Quantifying the Invisible Costs of Software Development
The Bliss.ai pitch deck from 2015 is a masterclass in taking a highly technical concept—static code analysis—and reframing it as a management and business intelligence problem. At a time when 'Software is eating the world' was the dominant narrative, Bliss.ai identified that the people managing that software lacked the tools to measure the quality of their primary asset. This teardown explores how they used a 14-slide deck to secure $750,000 in seed funding by focusing on high margins and clear management dashboards.
The Hook and The Problem (Slides 1-3)
Slide 1: Title The deck opens with a clean, minimalist title slide. The tagline, 'Code quality metrics for engineering managers,' immediately identifies the target persona. It isn't for developers; it is for the people who manage them. This distinction is critical for the business model that follows.
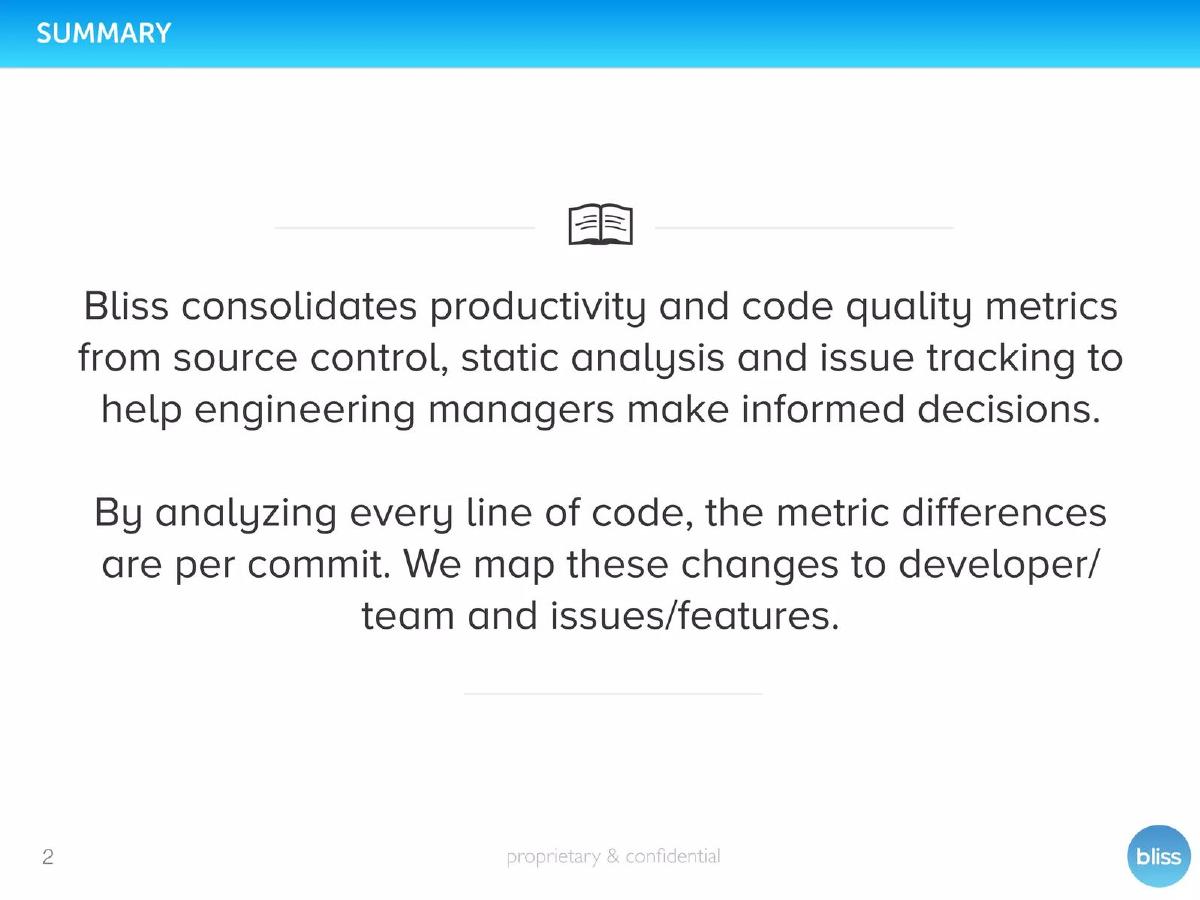
Slide 2: Summary The summary slide provides a high-level overview of the product's mechanics. It states that Bliss consolidates productivity and code quality metrics from source control, static analysis, and issue tracking. The key value proposition is helping managers make 'informed decisions' by mapping code changes to specific developers, teams, and features. This sets the stage for a tool that acts as a layer of accountability.
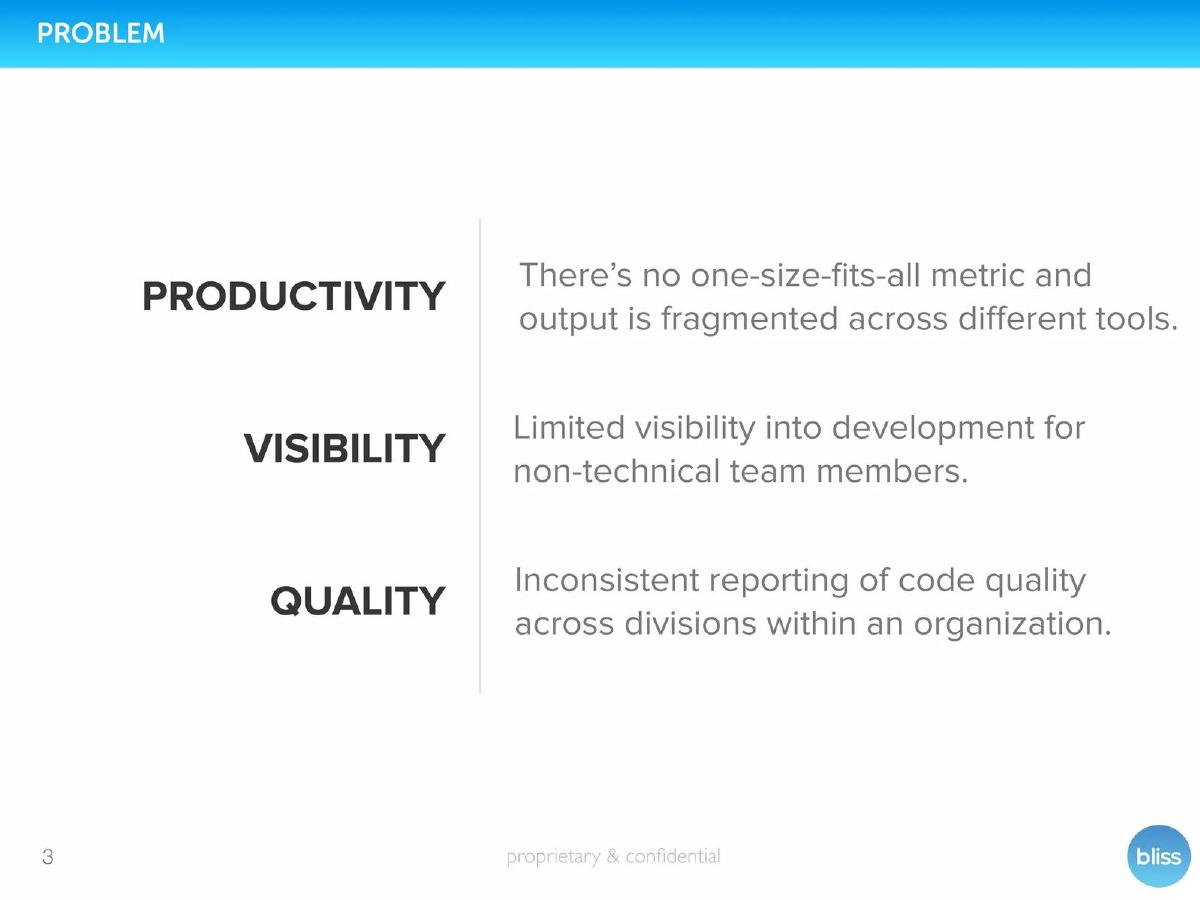
Slide 3: Problem The problem is categorized into three pillars: Productivity, Visibility, and Quality. The deck argues that there is no 'one-size-fits-all metric' and that output is currently fragmented. Most importantly, it highlights the 'limited visibility' for non-technical team members, which is the primary pain point Bliss.ai intends to solve. By framing the problem this way, they expand their potential user base from just CTOs to CEOs and Product Managers.
The Solution and Proprietary Tech (Slides 4-5)
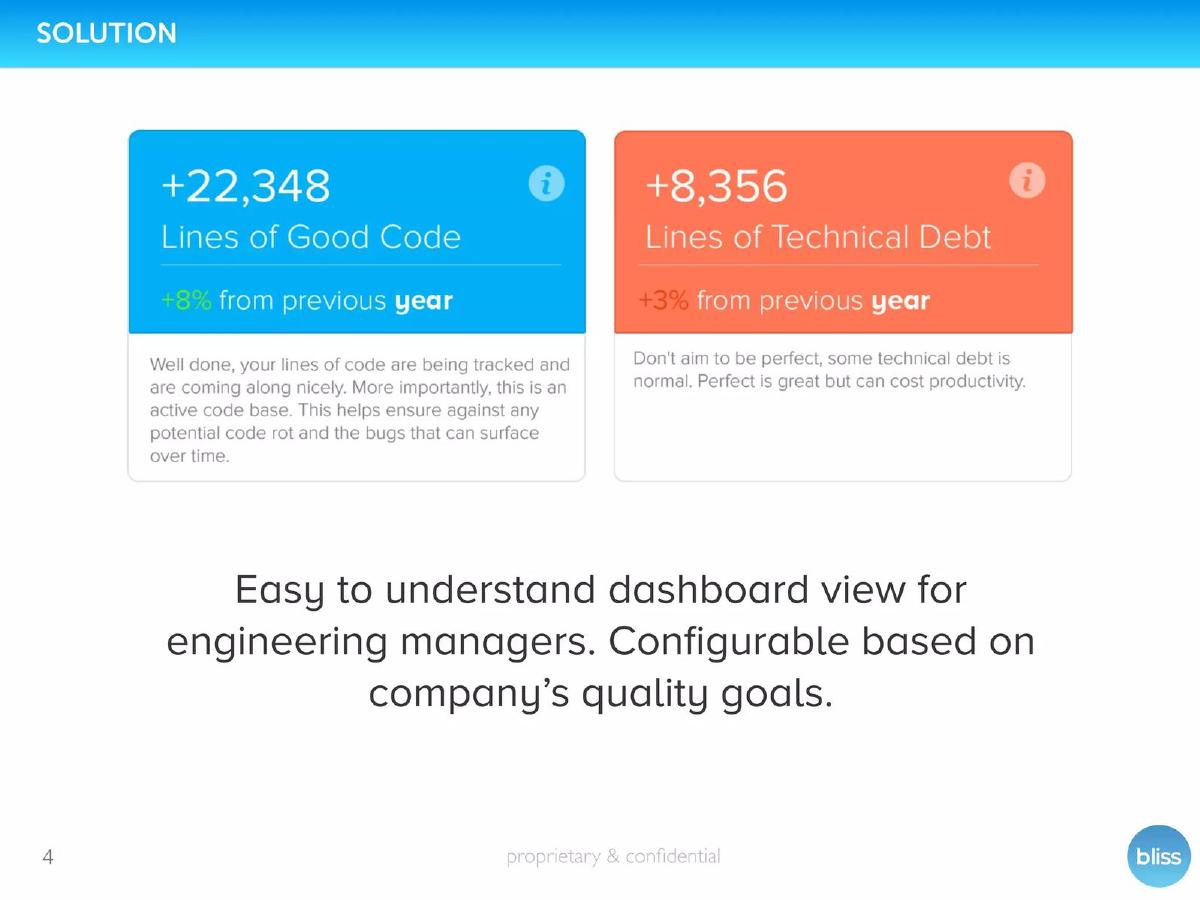
Slide 4: Solution Instead of showing a complex IDE or terminal, the solution slide shows a simplified dashboard. It features two large cards: '+22,348 Lines of Good Code' and '+8,356 Lines of Technical Debt.' This visualization turns abstract code quality into a balance sheet. The text emphasizes that the dashboard is 'configurable based on company’s quality goals,' suggesting a flexible enterprise-ready tool.
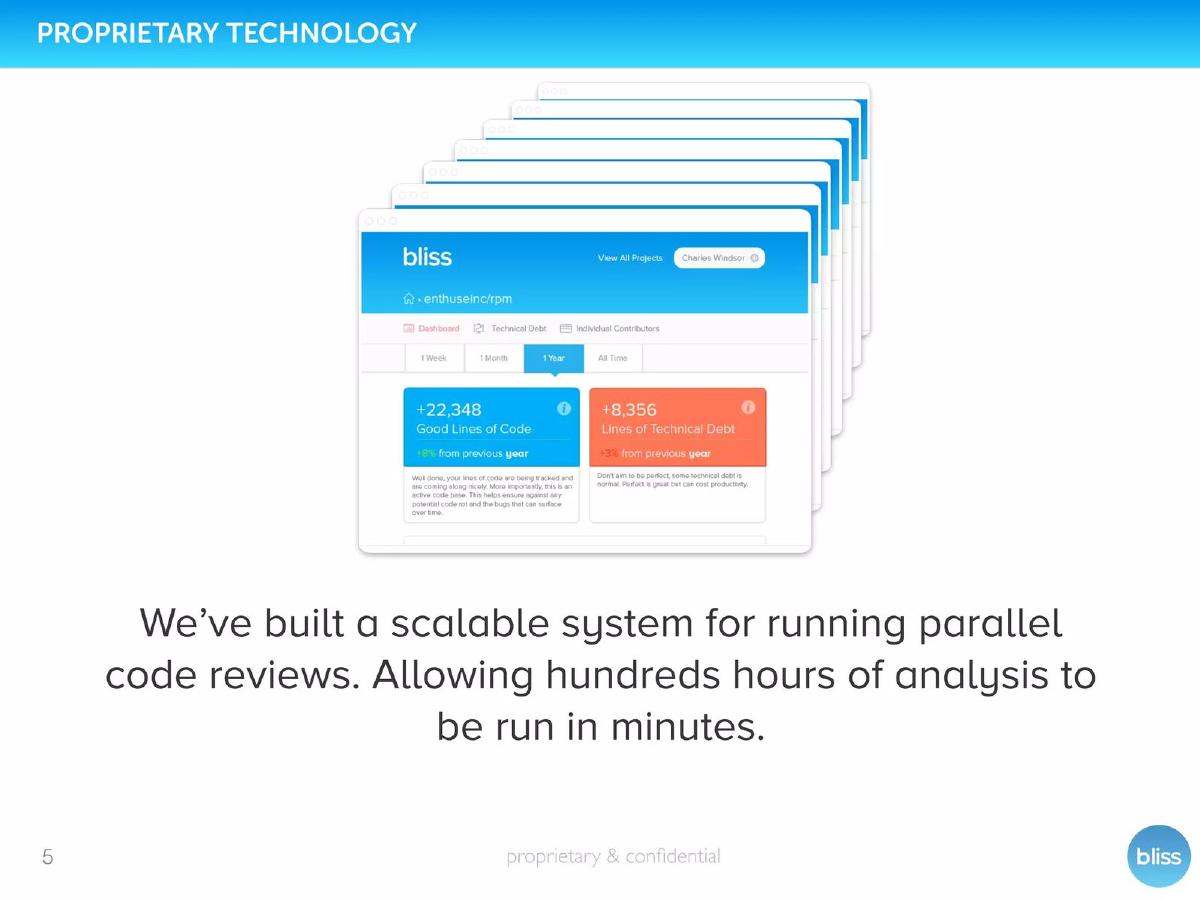
Slide 5: Proprietary Technology This slide addresses the 'how.' Bliss.ai claims to have built a scalable system for running parallel code reviews. The core claim is the ability to run 'hundreds [of] hours of analysis in minutes.' The visual shows a stack of browser windows, implying a cloud-based, multi-project capability. This slide is meant to reassure investors that the backend is robust enough to handle large-scale enterprise codebases.
Traction and Social Proof (Slides 6-8)
Slide 6: Timeline & Traction This is arguably the strongest slide in the deck. It shows a rapid progression from 'Initial concept' in January 2015 to a launch on February 27th. As of the pitch date, they report 70 paying customers, an $84,000 annual revenue run rate, and 90% margins. The scale is also impressive: over 10,000 repositories and 1 billion lines of code reviewed. These hard numbers provide immediate credibility to the founders' execution speed.
Slide 7: Go To Market The strategy was to focus on startups first for 'faster sales cycles and more homogeneous stacks.' The slide includes testimonials from Roger Graves (CTO of Cloverpop) and Noah Abelson (CEO of ShareRoot). Abelson’s quote, 'Having visibility into my code has helped me be a better CEO,' reinforces the earlier claim that this is a tool for the business side of the house.
Slide 8: Current Focus This slide signals a shift toward the enterprise. It highlights features like 'behind firewall' deployment and integration with JIRA and GitHub Enterprise. The inclusion of logos for Xero, Intuit, and Accellion serves as powerful social proof that large organizations are already trusting Bliss.ai with their code data.
Business Model and Competitive Landscape (Slides 9-10)
Slide 9: Revenue Model The pricing is transparent and tiered. The 'Website' side offers self-service plans ranging from $29/month for one project to $249/month for ten projects. The 'Enterprise' side starts at $1,500/month for 50 repositories. A 'Team Leaderboard' visual on the left shows how the product gamifies code quality, ranking developers by their 'Good/Debt Ratio.' This further emphasizes the management aspect of the tool.
Slide 10: Ecosystem The competitive matrix is well-constructed. It places Bliss.ai in the top-right corner, defined by a 'Manager' focus and a 'Team' dashboard view. It successfully differentiates the product from developer-centric tools like RuboCop or Code Climate, which are positioned lower on the 'Product Focus' axis. By grouping themselves with GitPrime and tenXer, they align with the emerging category of engineering intelligence.
The Ask and The Team (Slides 11-13)
Slide 11: Financing The ask is for a $750k seed round via convertible equity. Crucially, it notes that $500k was already committed, creating a sense of urgency for the remaining $250k. The 'Use of proceeds' is specific: hiring two engineers, one product person, and two sales reps. The milestones are equally clear: 1k paying customers, $1m ARR, and 50 enterprise customers. This level of detail gives investors a clear roadmap of what their money will buy.
Slide 12: Team The team slide focuses on 'founder-market fit' and previous success. CEO Brian York is described as having self-funded three businesses to profitability, with his most recent venture hitting $500k in revenue in its first year. CTO Ian Connor is highlighted for a previous exit (Pubget) that delivered a 4x return to investors. The 'Investors' section adds further weight, listing Mike Edelhart (Social Starts) and executives from Oracle and LinkedIn.
Slide 13: Why Now?! The final content slide provides the macro context. It uses a graph to show the 'huge disparity' between the growth of software and the availability of developer talent. It also cites a New York Times statistic about the rise of remote work, implying that managers need digital tools to oversee teams they can no longer see in person. This creates a 'tailwinds' argument for why Bliss.ai is a timely investment.
What Works in This Deck
1. Velocity of Execution: The timeline on Slide 6 is incredibly compelling. Moving from concept to $84k ARR and 70 paying customers in less than six months is a strong signal of product-market fit and founder hustle.
2. Clear Persona Targeting: Many technical startups fail by trying to sell to everyone. Bliss.ai is very clear that they are selling to the manager, not the developer. This clarity informs the dashboard design, the pricing, and the competitive positioning.
3. High-Margin SaaS Profile: Stating a 90% margin on Slide 6 is a 'green flag' for investors. It suggests that the analysis is highly automated and that the business can scale efficiently without a massive increase in COGS (Cost of Goods Sold).
4. Specificity of the Ask: Slide 11 doesn't just ask for money; it explains the exact headcount and the exact revenue milestones that money will unlock. This makes the investment feel like a calculated bet rather than a blind leap.
What is Missing
1. Total Addressable Market (TAM): The deck lacks a traditional market size slide. While they mention 'Software eating the world,' they don't quantify how many engineering teams exist globally or what the total spend on engineering management tools looks like. This might lead some investors to wonder if the ceiling for this niche is too low.
2. Retention Data: While they have 70 paying customers, there is no mention of churn or net revenue retention. Given that they launched only a few months prior, this data might have been too early to be meaningful, but its absence is notable in a SaaS pitch.
3. Deep Technical Moat: Slide 5 mentions 'parallel code reviews,' but it doesn't explain what makes their static analysis engine better than open-source alternatives. A savvy technical investor might question if the 'proprietary' part is the analysis itself or just the dashboarding layer.
What a Founder Should Copy
1. The 'Committed Capital' Tactic: If you have already raised a portion of your round, put it on the financing slide (Slide 11). It validates the deal and creates FOMO (Fear Of Missing Out) for the remaining investors.
2. The 2x2 Competitive Matrix: Slide 10 is a perfect example of how to use axes to your advantage. By choosing 'Product Focus' (Developer vs. Manager) and 'Dashboard View' (Line of Code vs. Team), they carved out a space where they were the clear leader.
3. Outcome-Oriented Milestones: Don't just list what you will spend the money on; list what the business will look like after you spend it. Bliss.ai’s link between hiring and reaching $1m ARR is a great way to show strategic thinking.
4. The Summary Slide: Starting with a one-page summary (Slide 2) that explains exactly what the product does and who it is for is an excellent way to orient the reader before diving into the details.
Frequently asked questions
- What specific problem does Bliss.ai solve for engineering managers?
- According to Slide 3, the problem is three-fold: productivity metrics are fragmented across tools, non-technical team members have limited visibility into development, and code quality reporting is inconsistent across different divisions within an organization. Bliss.ai solves this by consolidating metrics from source control, static analysis, and issue tracking into a single dashboard.
- How does Bliss.ai differentiate itself from other code analysis tools?
- Slide 10 uses a 2x2 matrix to show that while many tools like RuboCop or ReSharper focus on the 'Developer' and 'Line of Code' level, Bliss.ai focuses on the 'Manager' and 'Business-side.' It positions itself as a dashboard view for teams rather than just a linting tool for individual files.
- What are the key milestones Bliss.ai aimed to achieve with the $750k seed round?
- As detailed on Slide 11, the company set three specific targets: reaching 1,000 paying customers, achieving a $1 million annual revenue run rate (ARR), and securing 50 enterprise-level customers. These milestones were tied to the hiring of two engineers, one product person, and two sales development reps.
- Does the deck provide evidence of product-market fit?
- Yes, Slide 6 shows rapid execution. The concept started in January 2015, and by the time of the pitch, they had 70 paying customers and had reviewed over 1 billion lines of code. Slide 8 further validates this with logos from major enterprise clients including Xero, Intuit, and Accellion.
- What is the technical debt metric mentioned in the solution?
- Slide 4 shows a dashboard view that quantifies 'Lines of Good Code' versus 'Lines of Technical Debt.' It provides a percentage change from the previous year, helping managers understand if their code base is improving or rotting over time. The slide notes that 'some technical debt is normal' but needs to be tracked to prevent productivity loss.