Bliss.ai (2015) presents a highly structured seed-stage pitch focused on the 'person-centric' analysis of code quality. The deck is notable for its transparency regarding financials, reporting an $84,000 annual revenue run rate and 90% margins just months after launch. By positioning itself as a tool for engineering managers rather than just developers, Bliss.ai carved out a niche in the crowded static analysis market. The narrative moves logically from the problem of fragmented productivity metrics to a solution that integrates with existing stacks like JIRA and GitHub. While the deck lacks…
Key takeaways
- The company reported 70 paying customers and an $84,000 annual revenue run rate as of the 2015 pitch (Slide 6).
- Bliss.ai claims high capital efficiency with 90% margins on their product (Slide 6).
- The revenue model is bifurcated between a $1,500/month enterprise tier and a self-service website tier starting at $29/month (Slide 9).
- The competitive 'Ecosystem' map specifically positions Bliss.ai as the most business-side and team-focused tool compared to rivals like Code Climate or SonarQube (Slide 10).
- The financing ask is for a $750k seed round via convertible equity, with $500k already committed at the time of the deck (Slide 11).
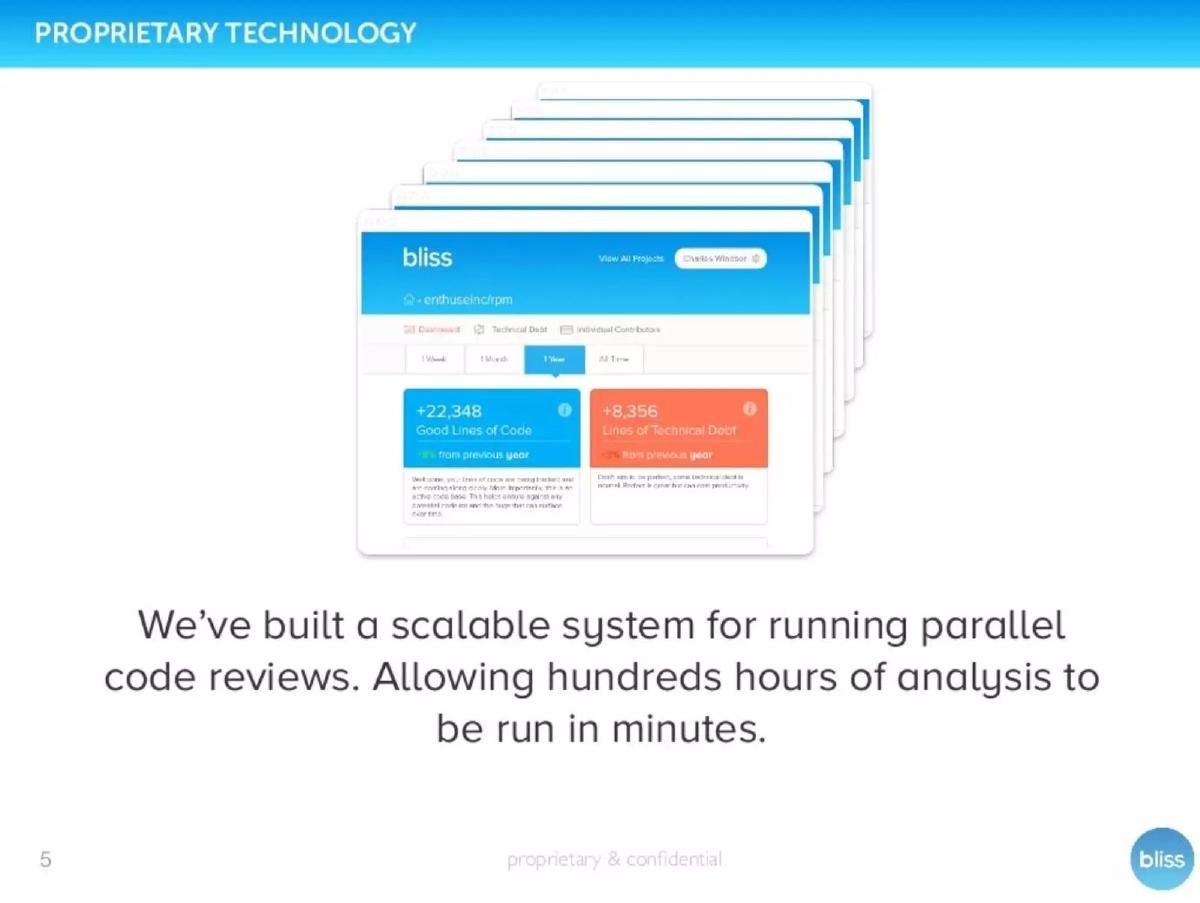
- The product is designed for speed, claiming to run hundreds of hours of analysis in minutes through parallel code reviews (Slide 5).
- The team slide highlights previous exits, including a 4x return for investors from the CTO's previous venture (Slide 12).
- The 'Why Now' slide relies on the 'software eating the world' thesis and the rise of remote work as primary market drivers (Slide 13).
Introduction: The Manager-First Approach to Code Quality
Bliss.ai's 2015 seed deck is a study in how to pitch a developer tool to a non-developer audience—specifically, engineering managers and executives. While many tools in the DevOps space focus on the technical 'how,' Bliss.ai focuses on the managerial 'who' and 'how much.' The deck is 14 slides long and follows a traditional but effective narrative arc that emphasizes traction and business value over deep technical specifications.
The Executive Summary and Problem Statement
Slide 1: Title The deck opens with a clear, one-sentence value proposition: "Code quality metrics for engineering managers." This immediately identifies the target persona and the core product category. It includes contact information for CEO Brian York, signaling a direct and accessible leadership style.
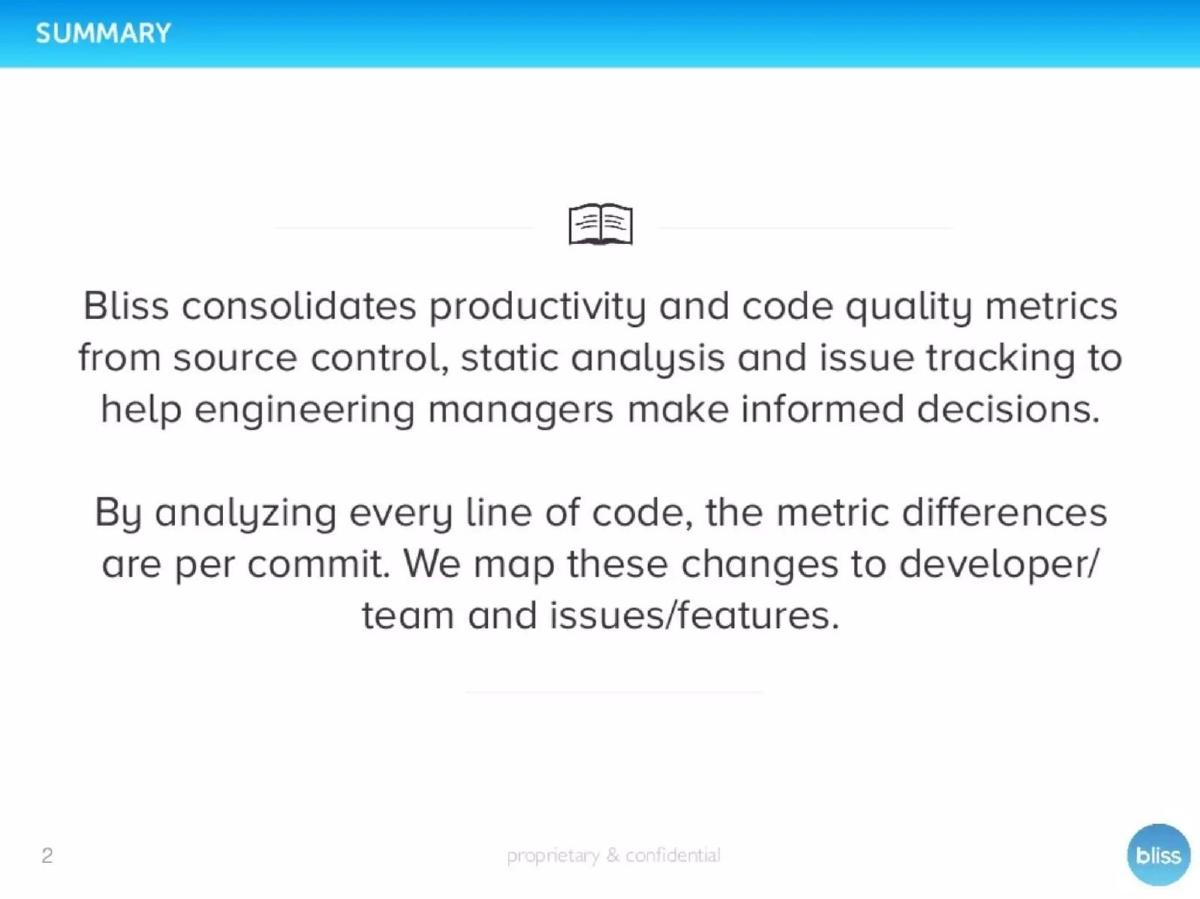
Slide 2: Summary The summary slide explains the mechanism of the product. Bliss consolidates productivity and code quality metrics from source control, static analysis, and issue tracking. The key differentiator mentioned here is the 'per commit' analysis and the mapping of changes to specific developers, teams, and features. This sets the stage for a 'person-centric' analysis tool.
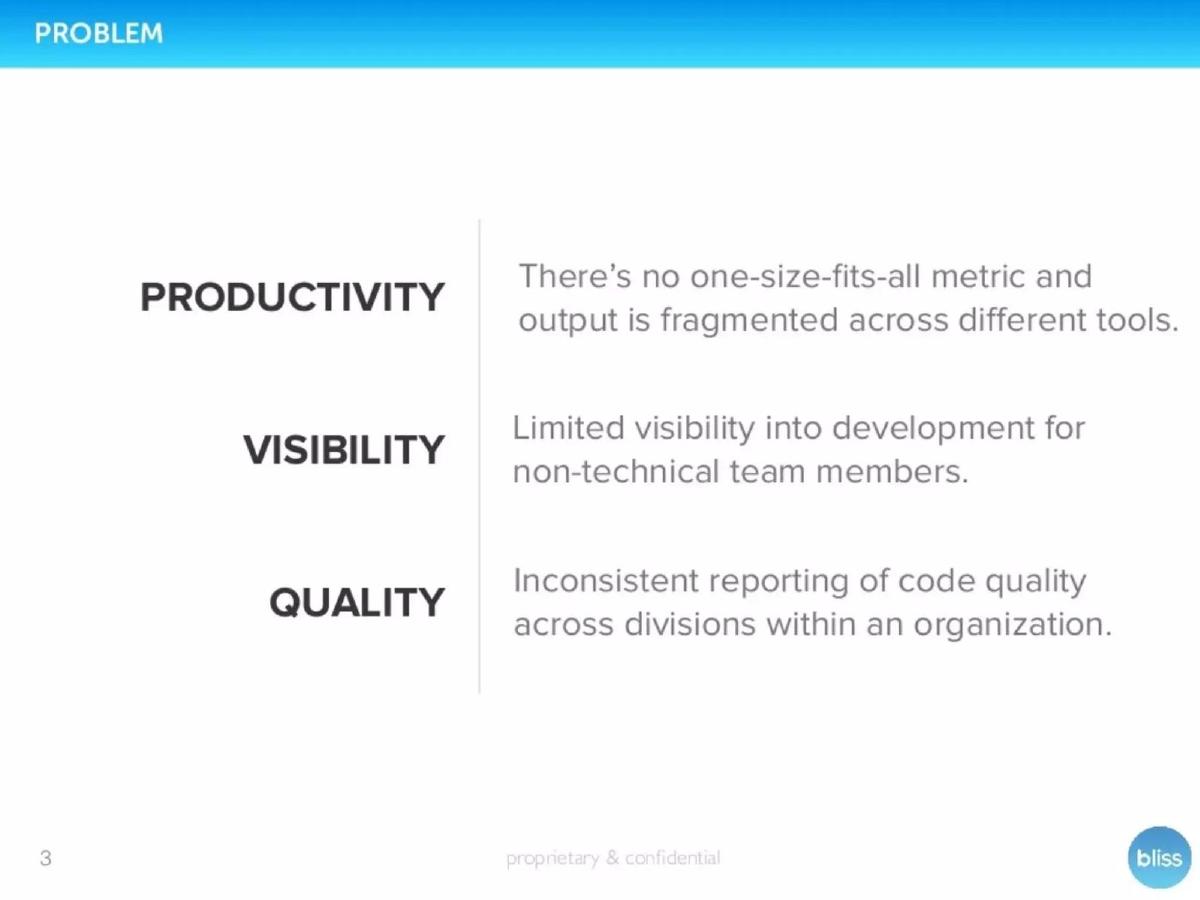
Slide 3: Problem The problem is broken down into three pillars: Productivity, Visibility, and Quality. Bliss.ai argues that productivity metrics are currently fragmented, non-technical team members have limited visibility into development progress, and reporting is inconsistent across large organizations. By framing the problem this way, they move the conversation from 'code linting' to 'organizational efficiency.'
The Solution and Proprietary Technology
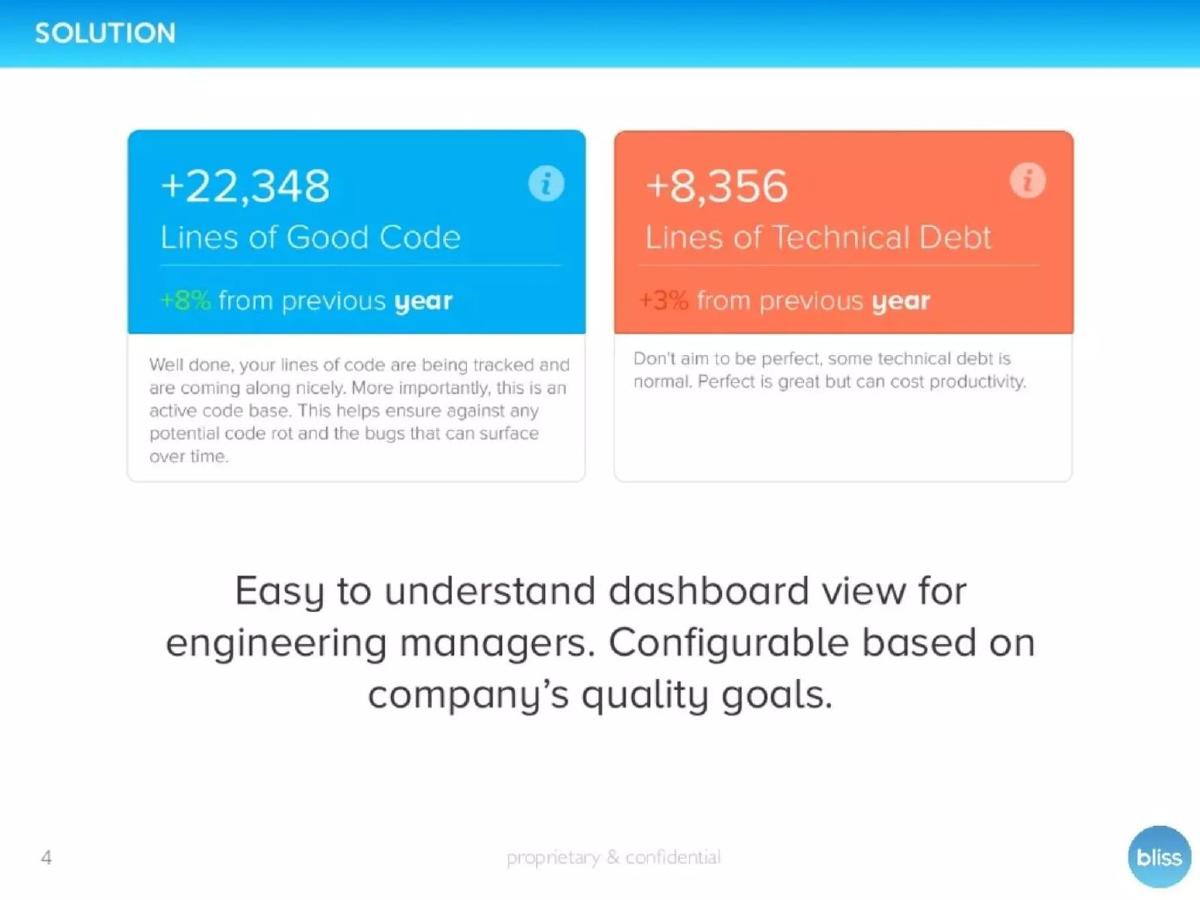
Slide 4: Solution The solution is presented as a dashboard. The slide shows two primary metrics: "Lines of Good Code" and "Lines of Technical Debt." It includes a qualitative note that "some technical debt is normal," which demonstrates an understanding of real-world engineering trade-offs. The dashboard is described as configurable based on a company's specific quality goals.
Slide 5: Proprietary Technology This slide addresses the technical hurdle of static analysis: speed. Bliss.ai claims to have built a scalable system for running parallel code reviews, allowing "hundreds hours of analysis to be run in minutes." This is a crucial point for enterprise sales, where slow build times or analysis cycles can hinder adoption.
Traction and Market Validation
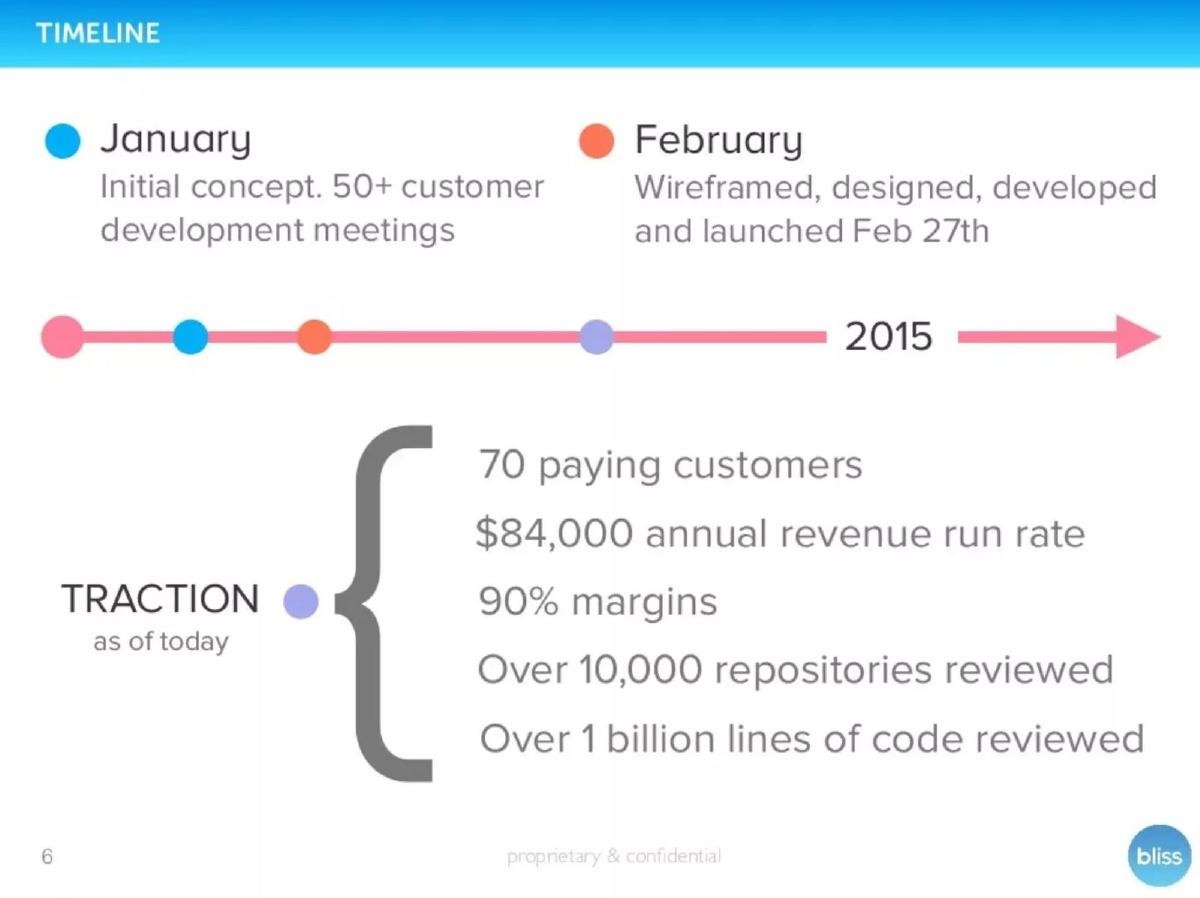
Slide 6: Timeline and Traction This is the strongest slide in the deck. It shows a rapid progression from initial concept in January 2015 to a launch in late February. As of the 'today' marker (presumably mid-2015), they report:
70 paying customers · $84,000 annual revenue run rate · 90% margins · Over 10,000 repositories reviewed · Over 1 billion lines of code reviewed
This level of transparency regarding margins and revenue is rare in seed decks and serves as a powerful validator of the business model's viability.
Slide 7: Go To Market The company explains its initial focus on startups for faster sales cycles. It features testimonials from the CTO of Cloverpop and the CEO of ShareRoot. These quotes emphasize the product's role as a "wing-man" for explaining technical debt to non-technical stakeholders.
Slide 8: Current Focus The deck pivots from startups to enterprise. It highlights the ability to deploy behind a firewall and integrate with GitHub Enterprise and JIRA. Most importantly, it displays logos for Xero, Intuit, and Accellion, proving that the product can scale into the enterprise market.
Business Model and Competition
Slide 9: Revenue Model Bliss.ai presents a clear two-tiered pricing strategy. The Enterprise tier starts at $1,500/month for 50 repositories. The Website (self-service) tier ranges from $29/month for one project to $249/month for ten projects. The slide also previews a "Team Leaderboard" feature, reinforcing the person-centric nature of the tool.
Slide 10: Ecosystem The competitive landscape is mapped on two axes: Product Focus (Developer vs. Manager) and Scope (Line of Code vs. Team). Bliss.ai places itself in the top-right quadrant—the most manager-focused and team-oriented solution. This visual effectively differentiates them from well-known tools like SonarQube, GitHub, and Code Climate, which are positioned as more developer-centric.
The Ask and The Team
Slide 11: Financing The company seeks a $750k seed round via convertible equity. They note that $500k is already committed, leaving a $250k 'party round' opportunity for new investors. The use of proceeds is specific: hiring two engineers, one product person, and two sales development reps. Milestones are clearly defined: 1k paying customers, $1m ARR, and 50 enterprise customers.
Slide 12: Team The team slide focuses on track records. Brian York (CEO) highlights his experience building three businesses to profitability. Ian Connor (CTO) highlights a 4x return for investors in his previous company. The inclusion of existing investors like Social Starts and individuals from Oracle and LinkedIn adds further credibility.
Slide 13: Why Now?! The final substantive slide uses the "software is eating the world" macro-trend. It argues that because developer talent is not growing as fast as the demand for software, tools that increase developer productivity are essential. It also cites a New York Times statistic about the 3.2 million Americans working remote as a driver for the need for better remote visibility tools.
Slide 14: Conclusion The final slide is a placeholder from the deck aggregator (chagency) and does not contain Bliss.ai specific content.
What Works in This Deck
1. Financial Transparency: Reporting a 90% margin and a specific ARR ($84k) so early in the company's life is a bold move that likely built significant trust with investors. It proves the founders are focused on the business metrics, not just the code.
2. Persona Targeting: By explicitly stating the tool is for "engineering managers," they avoid the common pitfall of trying to be everything to everyone. This clarity makes the competitive map on Slide 10 much more believable.
3. Momentum: The timeline on Slide 6 shows a company moving at high velocity. Going from concept to 70 paying customers in under six months is a compelling narrative of execution.
What is Missing
1. TAM/SAM/SOM: The deck lacks a formal market size analysis. While the "Why Now" slide hints at a large market, it doesn't quantify the dollar value of the developer productivity or static analysis markets. Investors usually want to see the 'billion-dollar' potential quantified.
2. Churn and Retention: While they show customer growth, there is no mention of churn. For a SaaS product with a $29 entry point, retention metrics are vital to prove that the tool provides long-term value rather than just a one-time analysis.
3. Detailed Product Walkthrough: The deck relies heavily on high-level dashboard mockups. A more detailed look at how the "person-centric" analysis actually works—and how it avoids becoming a "big brother" tool that developers hate—would have addressed a common objection in this space.
What a Founder Should Copy
The Competitive Map: Slide 10 is a masterclass in positioning. Instead of the standard 'check-box' feature comparison, Bliss.ai uses axes that define their philosophical difference from the market. Founders should identify the two most important dimensions of their market and show why they own the most valuable quadrant.
Milestone-Based Use of Proceeds: Slide 11 doesn't just say "we are hiring." It links those hires directly to specific business outcomes ($1m ARR). This shows investors that the founders have a plan for the capital that goes beyond just increasing the burn rate.
Social Proof Integration: Bliss.ai does a great job of mixing logos (Intuit, Xero) with human faces and quotes. This makes the traction feel real and validated by respected peers in the industry.
Frequently asked questions
- What is the primary value proposition of Bliss.ai?
- Bliss.ai provides code quality metrics specifically tailored for engineering managers. It consolidates data from source control, static analysis, and issue tracking to map code changes to specific developers and features. This allows managers to quantify technical debt and see where individual developers are adding the most value to the codebase.
- How does Bliss.ai differentiate itself from other static analysis tools?
- According to their ecosystem map on slide 10, Bliss.ai differentiates by focusing on the 'Business-side' and 'Team' level metrics. While competitors like RuboCop or Code Climate focus on the individual line of code or the developer's immediate workflow, Bliss.ai positions itself as a dashboard for managers to oversee entire projects and organizational quality goals.
- What were the company's key milestones at the time of the seed round?
- At the time of the pitch, Bliss.ai had reviewed over 1 billion lines of code across 10,000 repositories. They had achieved 70 paying customers since their February 2015 launch. Their immediate goals for the $750k raise included reaching 1,000 paying customers, 50 enterprise customers, and a $1 million annual revenue run rate.
- What does the Bliss.ai team look like?
- The leadership consists of Brian York (CEO), who previously self-funded three businesses to profitability, and Ian Connor (CTO), a former founder whose previous company was acquired by Copyright Clearance Center. The deck also lists several high-profile early investors and advisors from Social Starts, Oracle, and LinkedIn.
- Is there a market size (TAM) analysis in the deck?
- No, the Bliss.ai deck omits a traditional Total Addressable Market (TAM) slide. Instead, it uses a 'Why Now' slide to argue that the disparity between the growth of software and the availability of developer talent creates an urgent need for productivity tools. They also cite the growth of the remote workforce as a tailwind.