The BlaBlaCar pitch deck from 2012 is a high-velocity presentation designed to prove marketplace dominance and organic scalability. Across just 10 slides, the company demonstrates a 135% annual growth rate in seat capacity (Slide 5) and claims massive market shares in key European territories, such as 94% in France and Italy (Slide 7). The deck relies heavily on visual storytelling to explain its value proposition—splitting travel costs (Slide 3)—and uses social proof, including 200,000 Facebook fans and 10,000 'Ambassadors' (Slide 8), to mitigate the inherent trust issues of carpooling. Whil…
Key takeaways
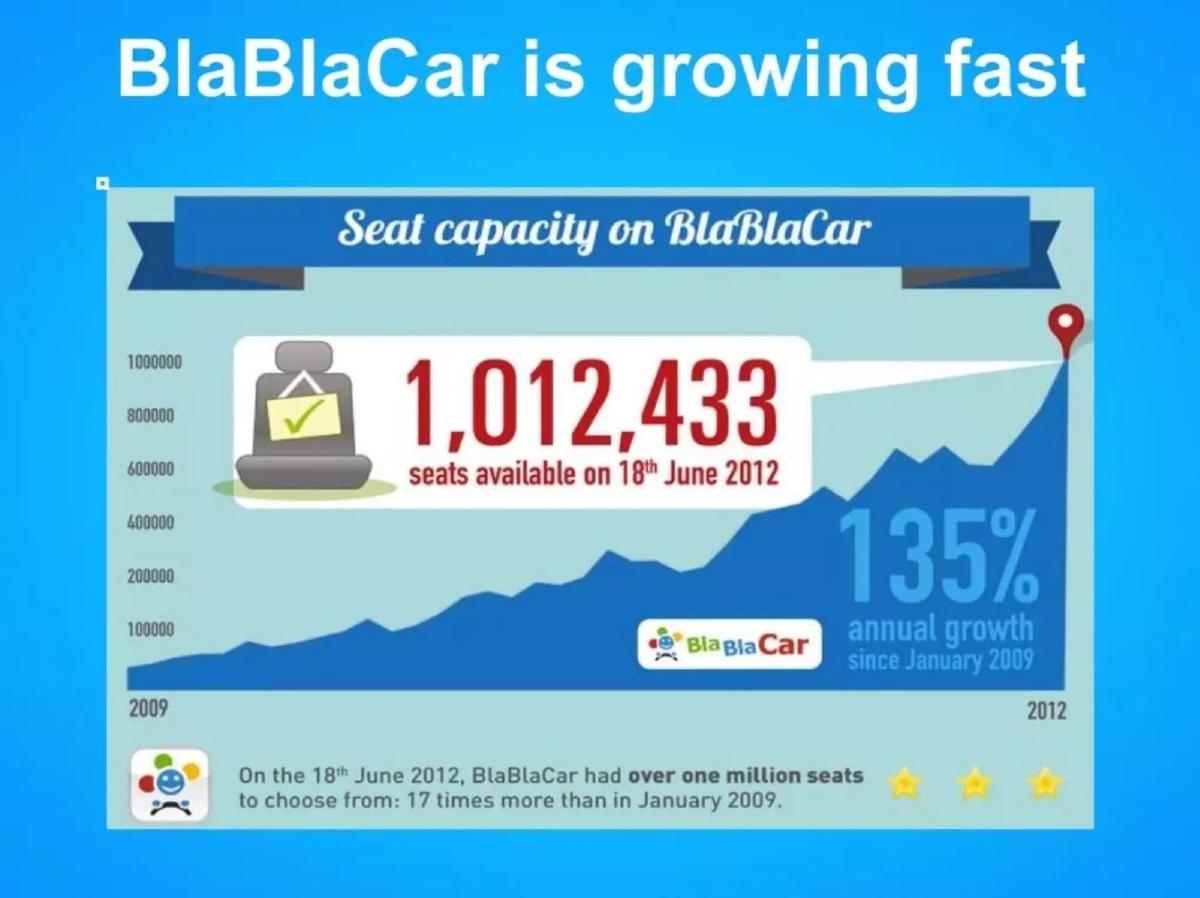
- The platform achieved a 135% annual growth rate in seat capacity between 2009 and 2012 (Slide 5).
- BlaBlaCar reached a milestone of over 1,000,000 available seats on June 18, 2012 (Slide 5).
- The company claims dominant market shares in major European markets: 94% in France, 94% in Italy, and 72% in the UK and Spain (Slide 7).
- Acquisition is highly efficient, with 92% of traffic described as 'natural,' consisting of 72% organic and 20% free referrals (Slide 8).
- The business model is commission-based and achieved 500,000+ people transported monthly by late 2012 (Slide 10).
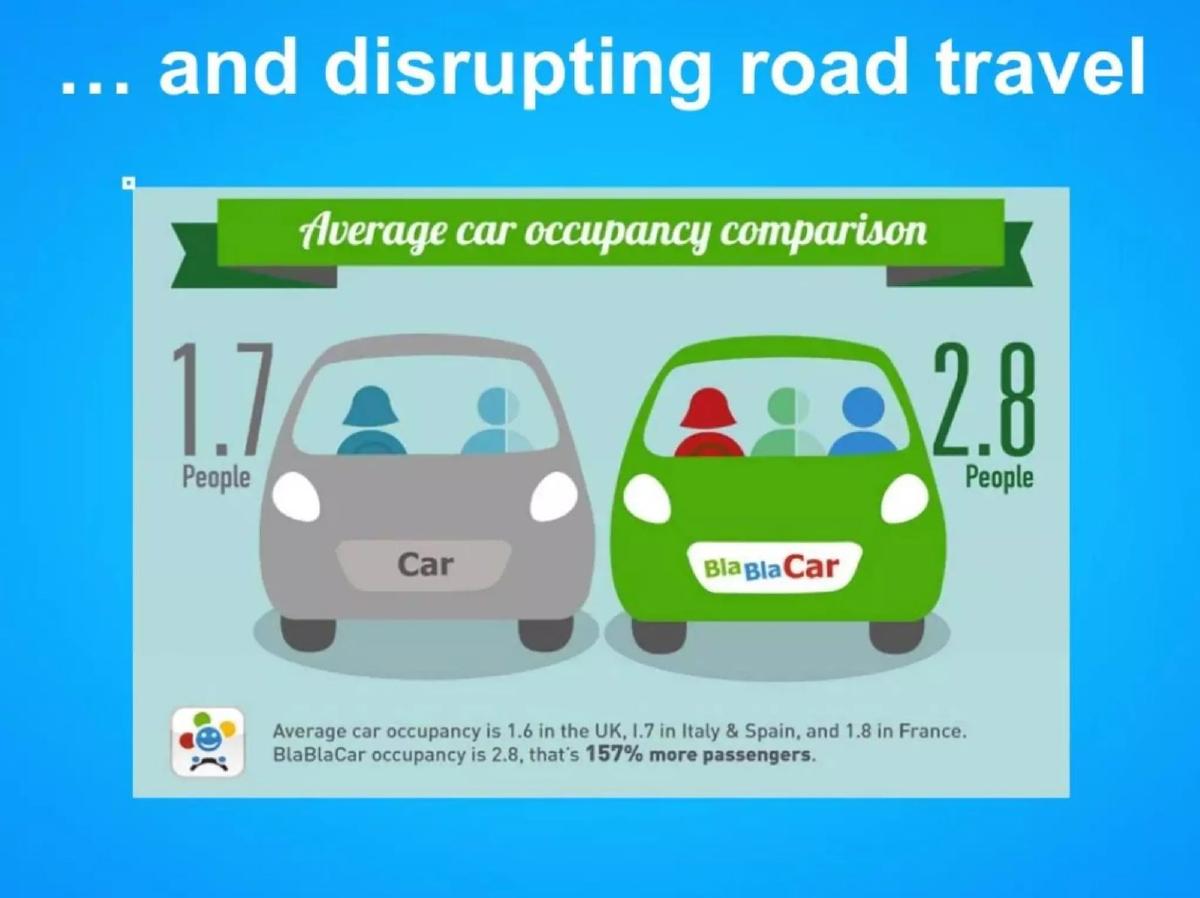
- The platform increases car occupancy from a regional average of 1.7 people to 2.8 people per car (Slide 6).
- The deck emphasizes a 'trusted community' through a network of 10,000 Ambassadors and 200,000 Facebook fans (Slide 8).
- By November 2012, the platform had reached 2,500,000 members and 5.0 million unique visits per month (Slide 10).
The 2012 BlaBlaCar Growth Deck: A Study in Marketplace Dominance
The 2012 BlaBlaCar pitch deck is a concise, 10-slide presentation that captures a pivotal moment in the company's history. At this stage, the company was transitioning from a French startup into a pan-European powerhouse. The deck is less about 'the idea' and entirely about 'the scale.' It uses a clean, blue-and-white aesthetic that mirrors the brand's identity, focusing on the core mechanics of a successful two-sided marketplace: supply, demand, and the trust that connects them.
Slide 1: Title Slide
The deck opens with a simple title slide featuring the BlaBlaCar logo and the word "EUROPAS." It identifies Nicolas Brusson, a co-founder, and includes his Twitter handle. This suggests the deck may have been used for a specific event or award ceremony (The Europas), but it functions as a standard introduction to the brand. The branding is friendly and approachable, setting the tone for a consumer-facing social platform.
Slides 2-4: Value Proposition and Problem/Solution
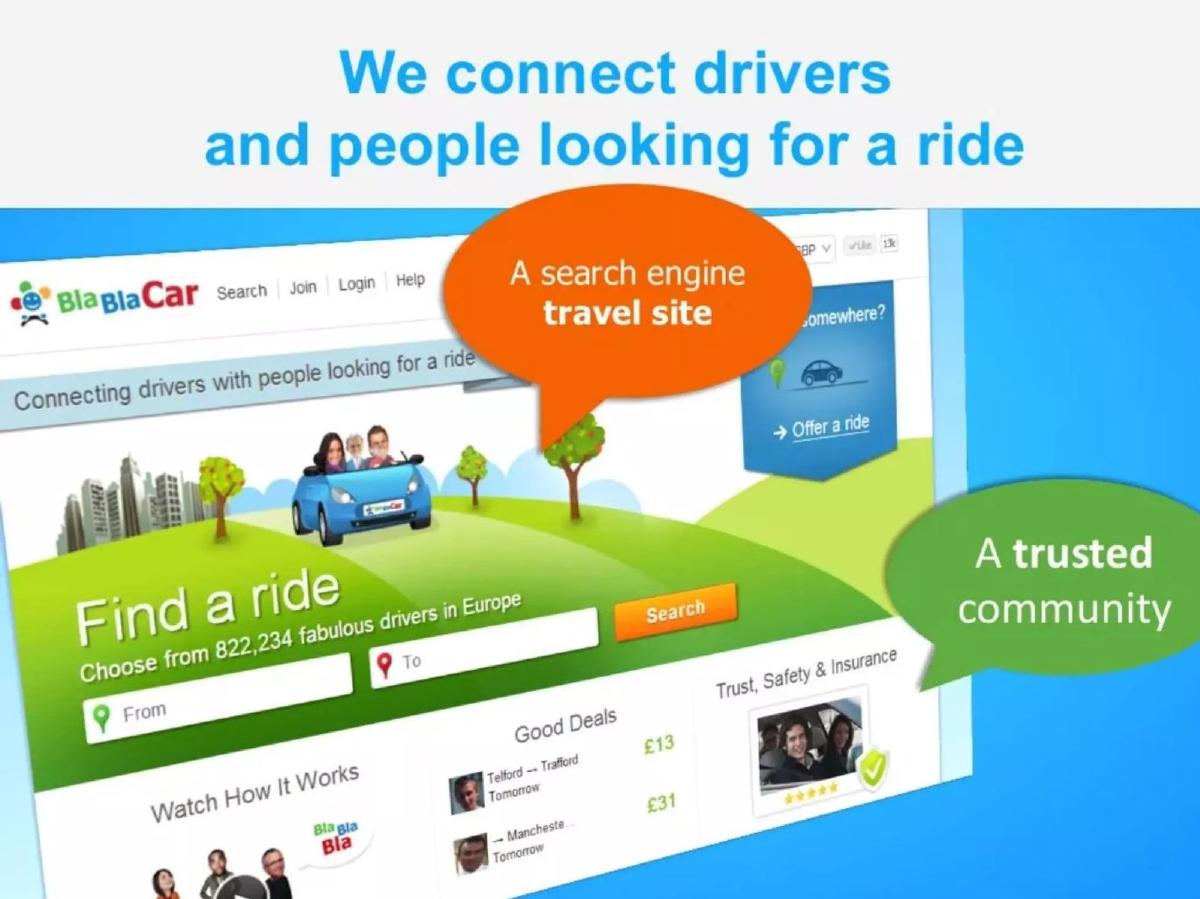
Slide 2 introduces the core mission: "We connect drivers and people looking for a ride." It uses a screenshot of the 2012 website to show the product in action, highlighting two key pillars: "A search engine travel site" and "A trusted community." Notably, it mentions a figure of 822,234 "fabulous drivers in Europe," immediately establishing the scale of the supply side.
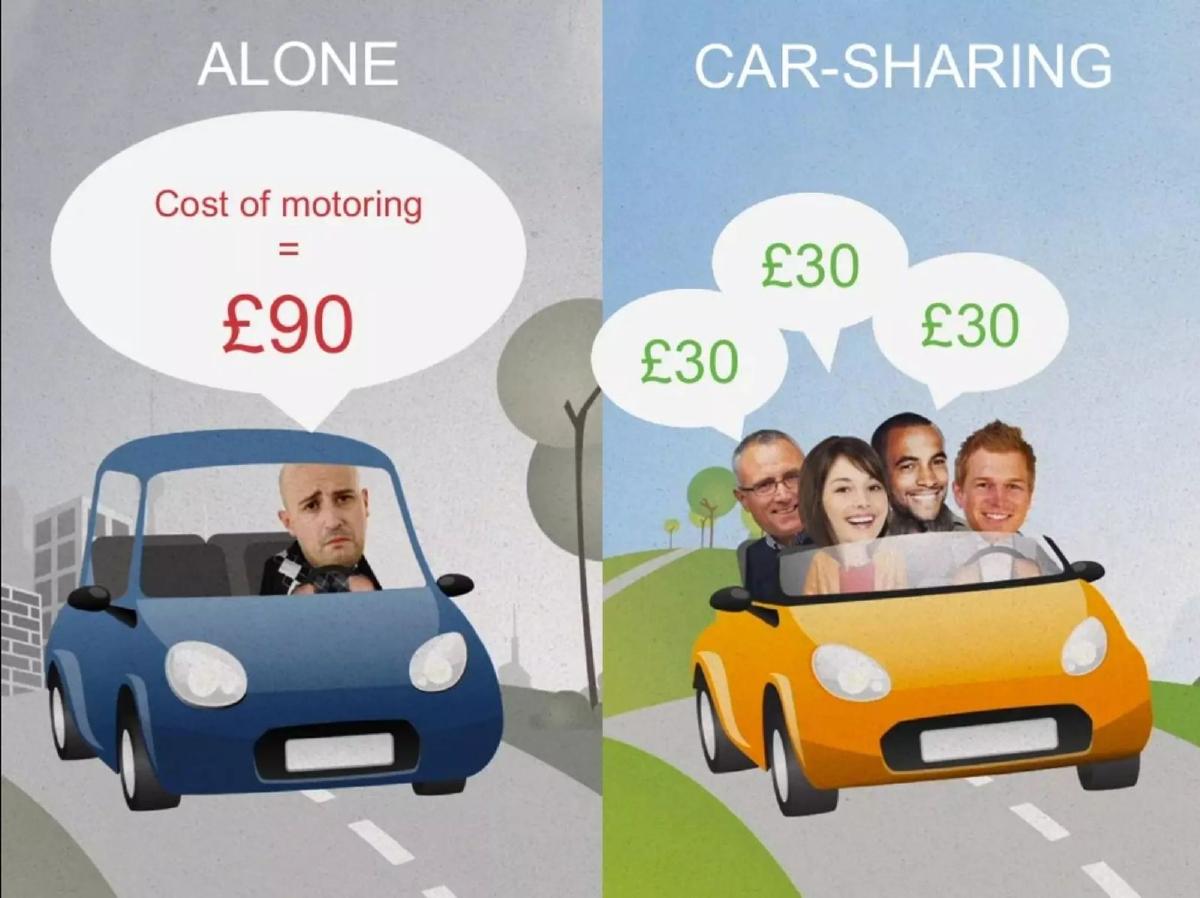
Slide 3 uses a simple, effective visual to explain the economic incentive. It contrasts a driver "ALONE" facing a £90 cost of motoring with a "CAR-SHARING" scenario where four people split the cost into £30 increments. This slide is crucial because it defines the company not as a taxi service, but as a cost-sharing utility. The driver is not making a profit; they are reducing a loss.
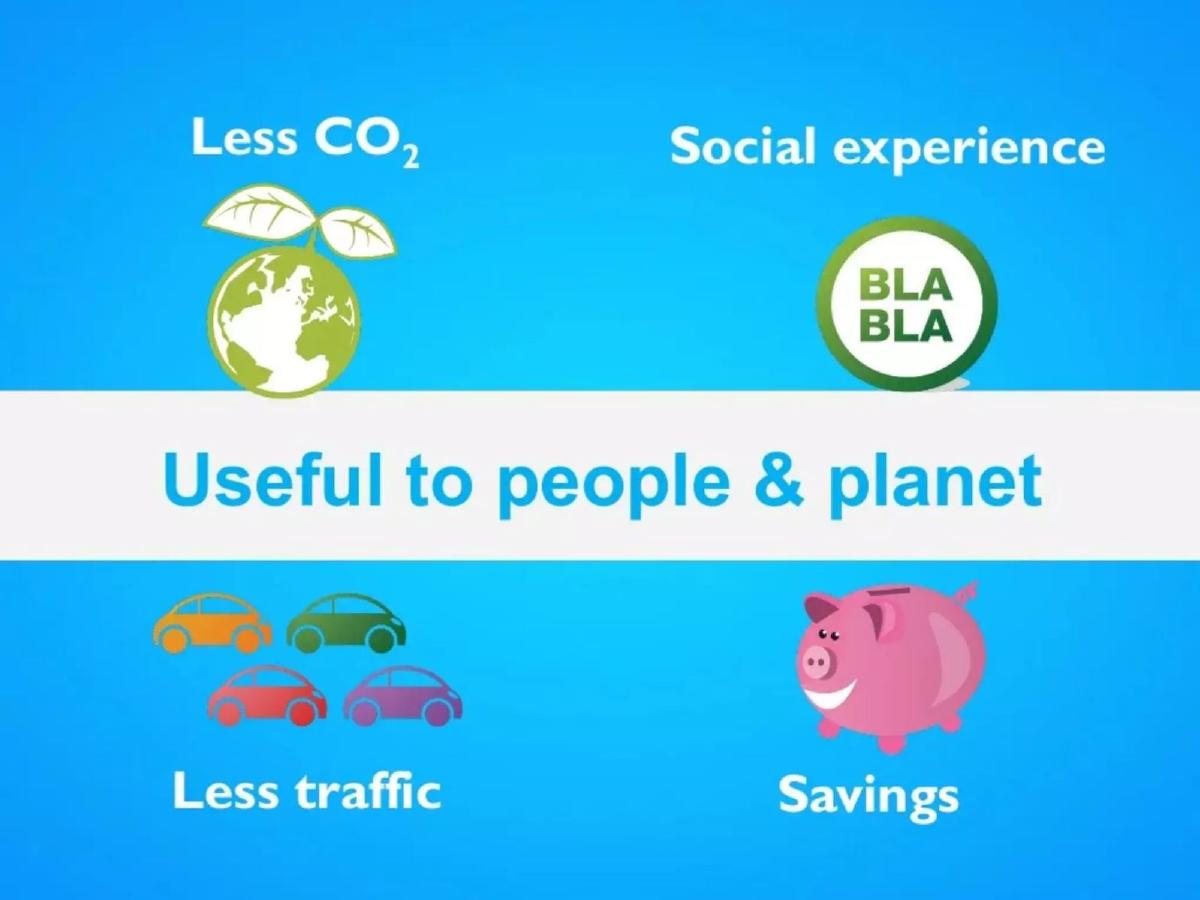
Slide 4 expands the value proposition beyond just savings. It lists "Less CO2," "Social experience," "Less traffic," and "Savings," summarized by the headline "Useful to people & planet." This positions BlaBlaCar as an ESG-friendly (Environmental, Social, and Governance) investment long before that term became a standard VC checklist item.
Slides 5-7: Traction and Market Share
Slide 5 is the "money slide" for marketplace investors. It focuses on "Seat capacity," showing a graph that climbs steeply from 2009 to 2012. The headline figure is 1,012,433 seats available on June 18, 2012. It claims a 135% annual growth rate. In marketplace dynamics, liquidity is everything. By showing that they have over a million seats available, BlaBlaCar proves they have reached the tipping point where a passenger can reasonably expect to find a ride on any major route.
Slide 6 provides a unique efficiency metric: "Average car occupancy comparison." It states that while the average car in the UK, Italy, Spain, and France carries between 1.6 and 1.8 people, a BlaBlaCar carries 2.8. This "157% more passengers" metric is a clever way to demonstrate disruption. They aren't just adding more cars to the road; they are making existing cars more efficient.
Slide 7 demonstrates geographic dominance. Using a map of Europe, it lists market shares: 94% in France, 94% in Italy, 72% in the UK, and 72% in Spain. It also marks Poland and the Benelux region as "New!" This slide tells investors that the model is repeatable across borders and that BlaBlaCar is the default winner in every market it enters.
Slides 8-9: Acquisition and Social Proof
Slide 8 focuses on the efficiency of their growth engine. A pie chart shows that 92% of traffic is "natural" (72% Organic, 20% Free Referral), with only 8% coming from paid sources. This is a dream metric for VCs, as it implies a very low Customer Acquisition Cost (CAC) and a high viral coefficient. It also highlights 200,000 Facebook fans and 10,000 "Ambassadors," quantifying the "trusted community" mentioned earlier.
Slide 9 reinforces this with "strong media coverage." It shows co-founders Frédéric Mazzella and Nicolas Brusson on TF1 and BBC News, respectively. Below the fold, it displays logos from prestigious publications like The New York Times, Financial Times, and Le Monde. This slide serves to prove that BlaBlaCar is a "social phenomenon," making it feel like an inevitable cultural shift rather than just an app.
Slide 10: The Business Model
The final slide, Slide 10 , summarizes the "sustainable business model." It provides a checklist of impressive year-end 2012 stats: 2,500,000 members, 500,000+ people transported monthly, 100%+ year-over-year growth, and 5.0 million unique visits per month. Most importantly, it confirms the "Commission based model" and positions the car as a "mainstream travel option" alongside icons for buses, trains, and planes. The footer notes that they are the only car-sharing platform entirely monetized by online booking, which was their key competitive advantage in professionalizing the sector.
What Works in This Deck
1. Liquidity as the North Star: The focus on "seats available" (Slide 5) is the correct way to pitch a travel marketplace. It shows the depth of the inventory, which is the primary driver of user retention.
2. Organic Growth Proof: Slide 8’s breakdown of traffic (92% natural) is the strongest argument for the company’s long-term viability. It proves that the brand has high word-of-mouth equity and doesn't need to buy its way into every new market.
3. Visual Simplicity: The deck avoids dense blocks of text. The cost-sharing graphic (Slide 3) and the occupancy comparison (Slide 6) explain complex economic and social shifts in seconds.
What Is Missing From This Deck
1. Team Backgrounds: While the founders appear in media clips, there is no slide detailing their specific expertise, previous exits, or why they are the right team to scale this globally. In 2012, they were already well-established, but for a standard pitch, this is a glaring omission.
2. Financial Specifics: The deck mentions a "commission based model" but does not disclose the take rate, average order value (AOV), or gross merchandise value (GMV). Investors would need these to calculate the actual revenue potential.
3. The Ask: There is no slide detailing how much capital is being raised or how it will be spent. This suggests the deck was likely a high-level overview for a known group of investors or a presentation for a public forum rather than a cold-outreach deck.
What a Founder Should Copy
1. The "Winner-Take-All" Map: If you have dominant market share in a specific region, visualize it like Slide 7. It creates a sense of urgency for investors to join the leader before the market closes.
2. Comparative Metrics: Don't just say you are better; show the delta. Slide 6’s comparison of car occupancy (1.7 vs 2.8) is a brilliant way to quantify "disruption" in a way that feels tangible.
3. Social Proof as a Safety Feature: For any startup involving peer-to-peer interaction (sharing homes, cars, or tasks), use a slide like Slide 8 to show that your community is active and self-policing. Quantifying "Ambassadors" is more powerful than just saying "people like us."
Frequently asked questions
- What is the primary metric BlaBlaCar uses to show growth?
- BlaBlaCar focuses on 'Seat Capacity' as its primary liquidity metric. On Slide 5, they highlight reaching 1,012,433 seats available on June 18, 2012. This is a critical marketplace metric because it demonstrates supply-side health. They further support this by showing a 135% annual growth rate since 2009, proving that their supply of drivers is scaling rapidly alongside passenger demand.
- How does BlaBlaCar address the 'trust' issue in carpooling?
- Trust is addressed through social proof and community metrics. Slide 2 explicitly labels the platform as a 'trusted community.' Slide 8 quantifies this trust by citing 200,000 Facebook fans and 10,000 'Ambassadors'—highly active users who validate the service. By showing that 92% of traffic is organic or referral-based, they imply that the community itself is the primary driver of safety and reliability.
- What does the deck reveal about their business model?
- The business model is described on Slide 10 as a 'Commission based model.' It specifies that BlaBlaCar is the only car-sharing platform 'entirely monetized by online booking.' This was a pivotal shift from free community boards to a transactional marketplace, allowing them to capture a percentage of the travel costs shared between drivers and passengers.
- How does the company position itself against competitors?
- Rather than naming specific startups, BlaBlaCar uses Slide 7 to show regional dominance through market share percentages. By claiming 94% market share in France and Italy, they position the market as a 'winner-take-all' scenario where they have already won. They also position carpooling as a 'mainstream travel option' alongside buses, trains, and planes (Slide 10).
- What are the most significant omissions in this pitch deck?
- The deck is notably missing a dedicated Team slide, a detailed Financials/Projections slide, and a specific 'The Ask' slide. While Nicolas Brusson and Frédéric Mazzella appear in media screenshots (Slide 9), their professional backgrounds aren't detailed. The deck functions more as a 'traction report' to justify a high-valuation growth round rather than a seed-stage introductory presentation.