Travel Startup Business Model Slide Examples: 7 Real Pitch
How travel startups explain how they make money in a pitch deck: commissions, ticket prices, margins and ad models.
Travel Business Model Slide: Show the Fee, the Price It Comes From, and Who Pays
Travel startups usually earn money in one of a few ways: a commission on each booking, a ticket price they keep most of, a margin on trips they package, or advertising and data sold to travel brands. Investors know these models well, so the business model slide is less about naming the model and more about showing the numbers behind it: what percentage you take, of what average price, and how many bookings that adds up to. This guide compares seven real travel business model slides, from Airbnb's early commission maths to slides that name a model without a single figure.
TL;DR
State the fee, the average price it applies to, and who pays it. Airbnb's early slide does this in one line: "We take a 10% commission on each transaction", next to an average fee of $25 ($80 a night for 3 nights) and a revenue projection. Oregon Sand Dune Tours gives its ticket price ($45 per seat) and the cost taken from each ticket ($1.30 to the Forest Service). RoadRe gives a 10% booking fee and an average daily price. Nimbus shows a 23% gross margin. BlaBlaCar, Knowhere and YouMove.me name a model but give little or nothing to calculate from.
Travel business model slides from real pitch decks
Each example shows the exact stored slide above its analysis and links to the full teardown. Slides with figures you can check come first; slides that name a model without numbers follow. Text is as shown on the slides; comments are ours.
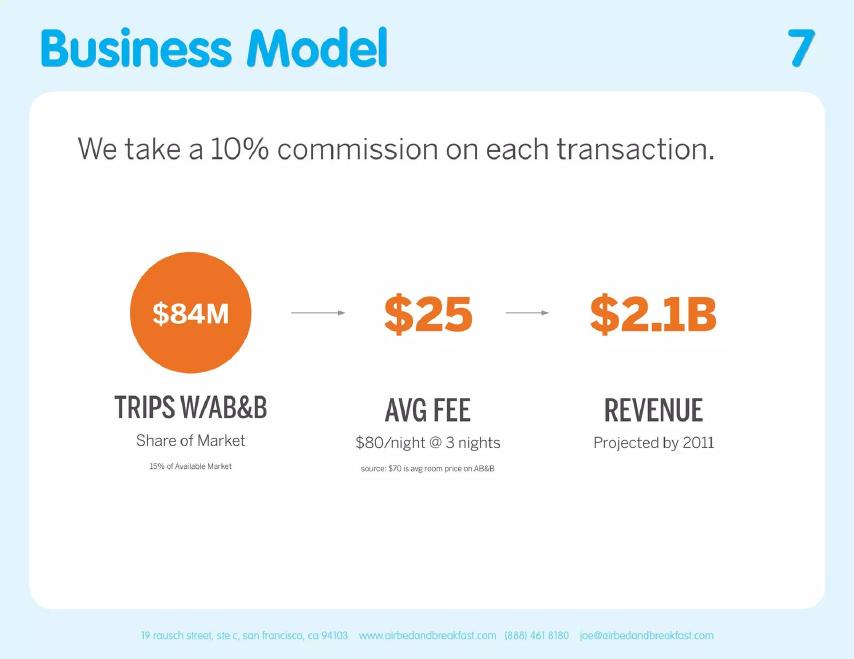
Airbnb (AirBed&Breakfast) business model slide — slide 7
Early deck from when the company was AirBed&Breakfast. Slide titled "Business Model".
Airbnb deck, slide 7. Exact stored slide matched to this analysis.
Our analysis: Trips times fee equals revenue: 84 million times $25 is $2.1 billion, so the maths is easy to check.
Evidence and limitation: Company projection; the slide gives no time frame for the $84M trips beyond the 2011 revenue date.
What a founder can adapt: Lay out your fee, average booking and booking count so investors can multiply them.
Supporting analysis
What the deck claims: "We take a 10% commission on each transaction." Three figures: "$84M" "Trips w/AB&B" ("Share of Market", "15% of Available Market"), "$25" "Avg Fee" ("$80/night @ 3 nights"), and "$2.1B" "Revenue" ("Projected by 2011"). Small print: "source: $70 is avg room price on AB&B".
Presentation choice: One sentence states the model and three numbers show what it adds up to.
When it does not fit: The mismatch between $80 a night in the calculation and $70 in the small print.
Oregon Sand Dune Tours business model slide — slide 5
Dune tour operator. Slide titled "Revenue Model".
Oregon Sand Dune Tours deck, slide 5. Exact stored slide matched to this analysis.
Our analysis: Gives the price, one cost taken from it, the price compared with rivals, and the season.
Evidence and limitation: Company figures and projection.
What a founder can adapt: Show what you keep per sale after any fee or permit, and mark your peak season.
Supporting analysis
What the deck claims: "$45 ticket sales per seat. $1.30/ticket sale goes to the Forest Service for the Special use permit." "Compared to the competition": "$10 more", "10 minutes longer tour", "More involved in the dunes restoration project", "scheduled tours (unlike the competition)". Revenue bars for 2020 to 2024 against a scale marked 60K, 100K, 500K, 1M and 1.5M. "May through September are peek months".
Presentation choice: Investors can see the price, a cost per ticket and when revenue arrives.
When it does not fit: An uneven chart scale that makes growth look smoother than the numbers.
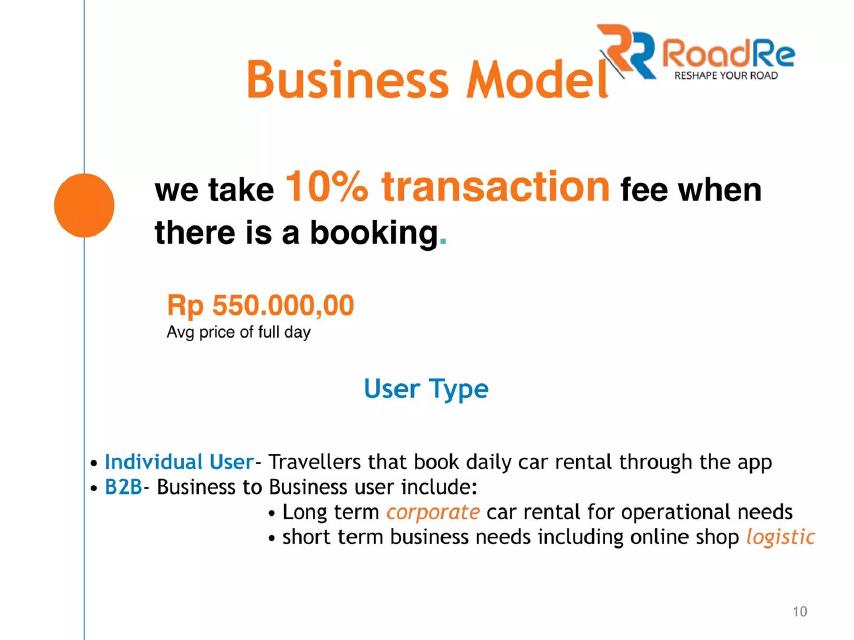
Indonesian car rental booking app. Slide titled "Business Model".
RoadRe deck, slide 10. Exact stored slide matched to this analysis.
Our analysis: Fee and average price are both given, so the fee per booking can be worked out (about Rp 55,000).
Evidence and limitation: Company figures.
What a founder can adapt: Write the fee per booking in money, not just as a percentage.
Supporting analysis
What the deck claims: "we take 10% transaction fee when there is a booking." "Rp 550.000,00" "Avg price of full day". "User Type": "Individual User - Travellers that book daily car rental through the app"; "B2B - Business to Business user include: Long term corporate car rental for operational needs; short term business needs including online shop logistic".
Presentation choice: It names who pays and what a typical booking is worth.
When it does not fit: Leaving out how many bookings you expect from each user type.
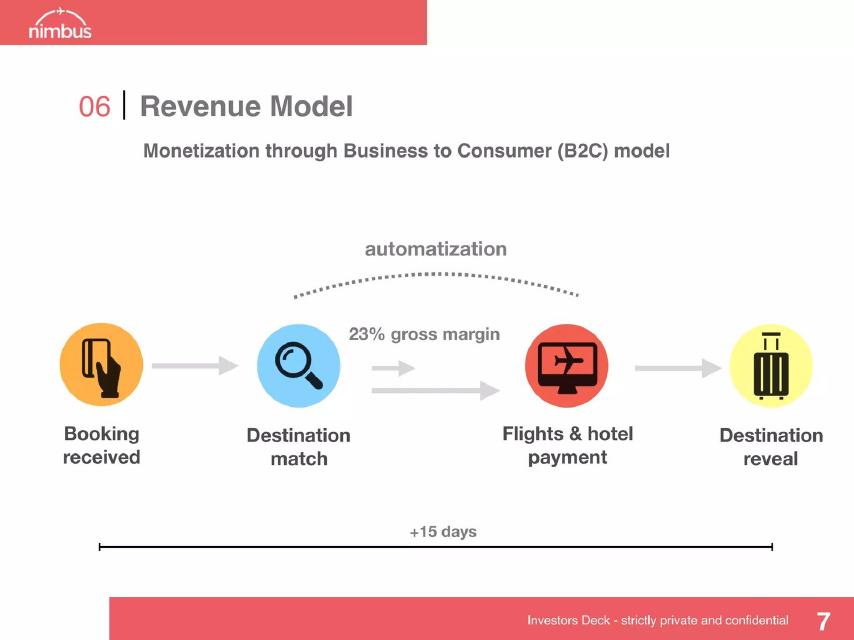
Nimbus deck, slide 8. Exact stored slide matched to this analysis.
Our analysis: Shows the order of payments and the margin left after paying for flights and hotels.
Evidence and limitation: Company figure.
What a founder can adapt: If customers pay you before you pay suppliers, say so plainly.
Supporting analysis
What the deck claims: "Monetization through Business to Consumer (B2C) model". A flow: "Booking received", "Destination match", "Flights & hotel payment", "Destination reveal", over "+15 days", with "automatization" above and "23% gross margin".
Presentation choice: The 15-day gap between booking and travel hints that customers pay before suppliers, which helps cash flow.
When it does not fit: Giving a margin without the average trip price it comes from.
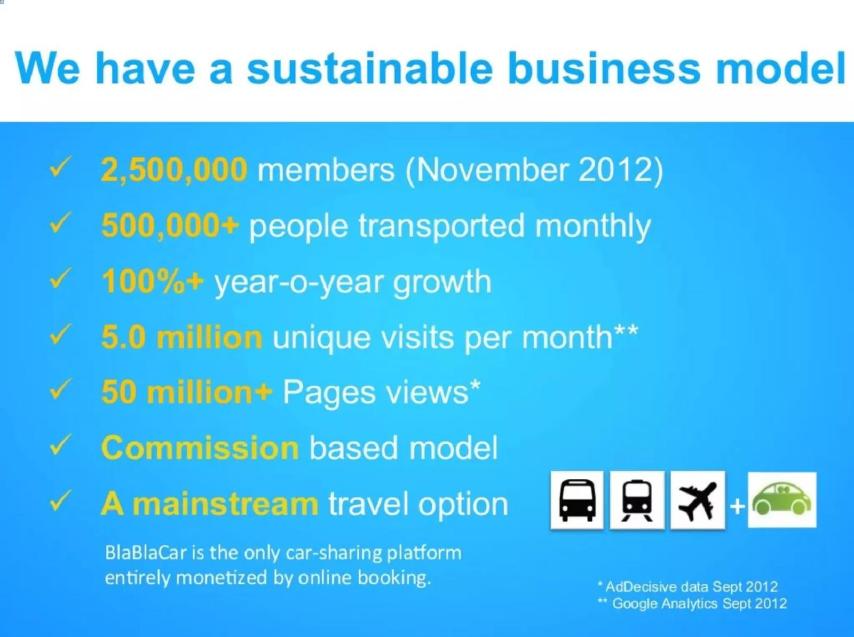
Car-sharing platform. Slide titled "We have a sustainable business model".
BlaBlaCar deck, slide 10. Exact stored slide matched to this analysis.
Our analysis: Strong usage numbers, but the commission rate and revenue are missing.
Evidence and limitation: Company figures with cited sources (AdDecisive, Google Analytics, Sept 2012).
What a founder can adapt: Next to usage numbers, give the commission and what it earns per trip.
Supporting analysis
What the deck claims: "2,500,000 members (November 2012)"; "500,000+ people transported monthly"; "100%+ year-o-year growth"; "5.0 million unique visits per month"; "50 million+ Pages views"; "Commission based model"; "A mainstream travel option". "BlaBlaCar is the only car-sharing platform entirely monetized by online booking."
Presentation choice: Shown for contrast. Investors know BlaBlaCar has users but cannot work out what it earns from them.
When it does not fit: Titling a slide "business model" while filling it with traffic figures.
Travel video and content startup. Slide titled "Business Model".
Knowhere deck, slide 8. Exact stored slide matched to this analysis.
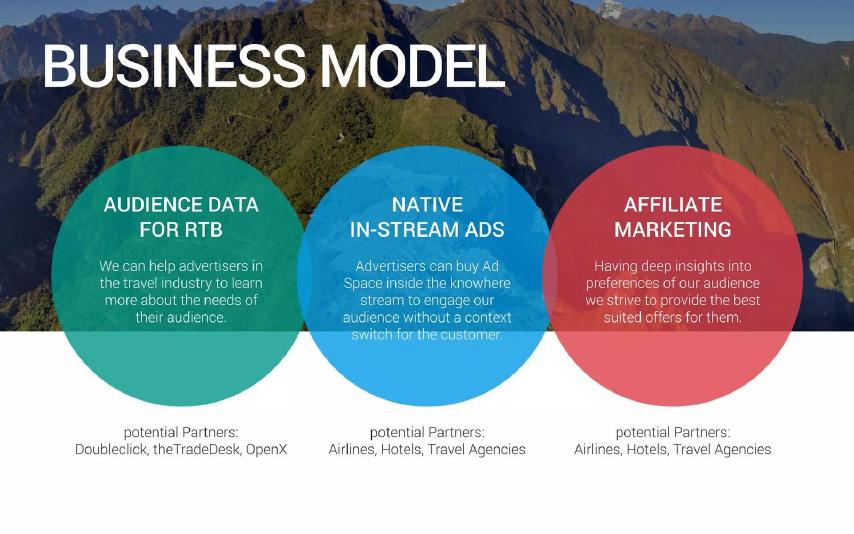
Our analysis: Three possible revenue sources, no prices and no audience figures.
Evidence and limitation: Plans only; partners are labelled potential.
What a founder can adapt: Pick the main revenue source and give its expected price, such as a cost per thousand views.
Supporting analysis
What the deck claims: Three circles: "Audience Data for RTB" ("We can help advertisers in the travel industry to learn more about the needs of their audience"), "Native In-Stream Ads" and "Affiliate Marketing". "Potential partners": "Doubleclick, theTradeDesk, OpenX" and "Airlines, Hotels, Travel Agencies".
Presentation choice: Shown for contrast. Investors cannot tell which source matters most or what any would earn.
When it does not fit: Listing potential partners as if they were customers.
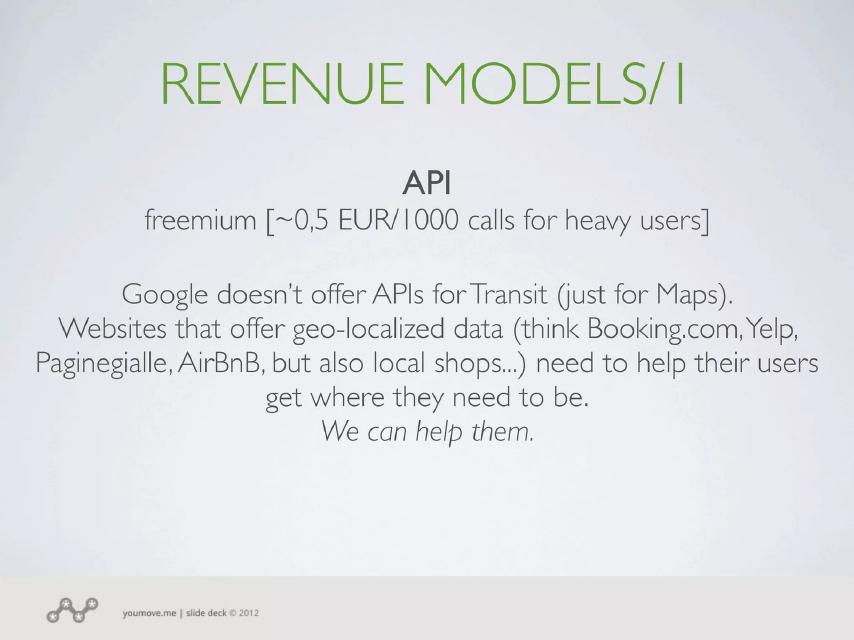
YouMove.me deck, slide 10. Exact stored slide matched to this analysis.
Our analysis: Gives a price, but not how many paying users or calls it needs.
Evidence and limitation: Company plan; named sites are examples, not customers.
What a founder can adapt: With a low unit price, show the volume needed and who will supply it.
Supporting analysis
What the deck claims: "API": "freemium [~0,5 EUR/1000 calls for heavy users]". "Google doesn't offer APIs for Transit (just for Maps). Websites that offer geo-localized data (think Booking.com, Yelp, Paginegialle, AirBnB, but also local shops...) need to help their users get where they need to be. We can help them."
Presentation choice: Shown as a warning. A price this low only works at huge volume, and the slide does not show that volume.
When it does not fit: Naming large companies as likely buyers without evidence of interest.
Whether each slide gives a fee or price, the value it applies to, and the costs or volume behind it.
Example
Fee or price
Value it applies to
Costs or volume
Airbnb
10% commission
$25 average fee
$84M trips (projection)
Oregon Sand Dune Tours
$45 per seat
Per seat
$1.30 permit cost; peak season
RoadRe
10% booking fee
Rp 550,000 per day
Not shown
Nimbus
23% gross margin
Not shown
Not shown
BlaBlaCar
Commission (rate not given)
Not shown
500,000+ people a month
Knowhere
Not given
Not shown
Not shown
YouMove.me
About 0.5 EUR per 1,000 calls
Heavy users only
Not shown
Key Takeaways
Give the fee as a percentage and as money per booking.
Show the average price the fee applies to.
Subtract costs you pass on, such as permits or supplier payments.
Make sure figures agree with each other and with their sources.
Name who pays: traveller, host, supplier or advertiser.
Build your travel business model slide
Work out the money per booking before you design the slide.
Fee. What percentage or margin do you keep on each booking?
Average value. What is a typical booking worth, and where does that figure come from?
Pass-on costs. Which part of the price goes to suppliers, permits or payment fees?
Volume and season. How many bookings, and in which months?
Copyable framework: We earn [fee] on each [booking], worth [average value] on average, so [money per booking] each. After [costs], we keep [net]. [Volume] bookings a year, mostly in [season].
Illustrative example 1 — written by us
Before: Business model: commission on bookings.
After: We take 12% of each booking. Average booking: $400, so $48 each. After payment fees, we keep $40. 20,000 bookings planned next year, 60% in summer.
What improved: Our illustrative rewrite; all figures are invented for the example. It gives the fee, the value, the costs and the timing.
What this guide adds
The general business model guide covers how any startup explains its revenue. The travel guides for market, problem, solution and competition slides cover other parts of a travel deck. This guide covers how travel startups specifically show how they earn money, where commissions, seasonality and supplier costs shape the numbers.
How we read each slide
We read each stored slide image and quote the text on it. We have not checked any company's actual revenue or fees, and we make no claim that any slide caused a fundraising outcome. Where a figure on the slide conflicts with another on the same slide, we point it out.
The common travel revenue models
Commission: the startup takes a share of each booking, as Airbnb and RoadRe say they do (10% each). The key numbers are the percentage, the average booking value and the number of bookings.
Ticket or seat price: the startup sells the trip or tour itself and keeps the price minus its costs, as Oregon Sand Dune Tours does. The key numbers are price per seat, cost per seat and seats sold, along with the season.
Package margin: the startup buys flights and hotels and sells the combined trip, as Nimbus does. The key number is the margin left after paying suppliers.
Advertising and data: the startup earns from travel brands that want to reach its audience, as Knowhere proposes. The key numbers are audience size and the price advertisers pay.
What investors check on a travel business model slide
Does the maths work? Investors multiply the figures on the slide. Airbnb's trips times its average fee equals its revenue figure, which makes the slide easy to check. A slide where the numbers cannot be multiplied, or do not agree, invites doubt.
What does the startup actually keep? A 10% commission on a $250 booking is $25 before payment fees, refunds and customer support. A $45 ticket is not $45 of revenue if part of it goes to a permit or a supplier. Oregon Sand Dune Tours shows one such cost; most slides show none.
How seasonal is it? Travel revenue often bunches into a few months. Oregon Sand Dune Tours notes that May through September are its peak months, which tells investors to expect uneven cash flow.
Who pays, and can they be reached? A commission paid by travellers depends on winning bookings; advertising depends on audience size. The slide should make clear which one the company is relying on.
Common mistakes on travel business model slides
The most common is naming the model without numbers. BlaBlaCar's slide says "Commission based model" but gives no rate, and Knowhere lists three ways to earn money with only potential partners.
The second is figures that do not agree. Airbnb's slide gives $80 a night as the basis of its fee, but its own small print says $70 is the average room price.
The third is a chart that exaggerates growth. Oregon Sand Dune Tours' revenue bars use uneven steps on the scale (60K, 100K, 500K, 1M, 1.5M), so the gaps between bars do not match the gaps in money.
The fourth is a model that depends on a buyer who has not been shown. YouMove.me's API is priced for heavy users, but the slide does not say who they are or how many exist.
Choosing which numbers to show
Most travel business model slides need only three numbers: the fee or margin, the average booking value, and the number of bookings expected. Together they give revenue, and investors can check the multiplication in their heads. Add a fourth, such as cost per booking, if a large share of the price goes to someone else.
Pick the average carefully. An average booking value drawn from your own early customers is stronger than one taken from an industry report, and an average that matches the small print avoids the mismatch on Airbnb's slide. If prices vary a lot by season or destination, say which average you used.
If the model is not proven yet, say so and show the assumption plainly. A labelled assumption, such as an expected commission rate, is more credible than a projection that hides where its numbers come from.
Adapting the slide to your type of travel business
Booking platforms and marketplaces should lead with the take rate and the average booking value, then the number of bookings. If hosts or suppliers pay part of the fee and travellers pay the rest, show both parts, because investors will ask which side carries the cost and whether a rival could undercut it.
Tour and activity operators should lead with price per seat, seats per trip and trips per season. Capacity matters here: a tour that seats twelve people and runs four times a day has a hard ceiling, and showing it makes the revenue projection believable rather than weaker.
Package and surprise-trip companies should show the average trip price, what they pay suppliers and the margin left. If customers pay weeks before the trip, as Nimbus's timeline suggests, explain how that money is held and what happens with refunds, since travel cancellations are common.
Content, media and app companies that plan to earn from advertising or data should show audience size today, the price advertisers typically pay, and the first paying partner if there is one. Without an audience figure, an advertising model is a hope rather than a plan.
Whatever the type, keep the slide to one main model. Secondary revenue ideas can go in a footnote or the appendix, where they will not distract from the number investors most need to check.
Common mistakes
Model named, no numbers. "Commission based" without a rate tells investors little.
Figures that disagree. Use the same average price in the maths and the small print.
Misleading chart scale. Space chart steps evenly so growth looks as big as it is.
Costs left out. Show what goes to suppliers or permits before claiming revenue.
Potential partners as customers. Label plans as plans.
Season ignored. Mark peak months if revenue is uneven.
Diagnostic checklist
Fee stated as a percentage and in money per booking.
Average booking value given, with its source.
Pass-on costs subtracted.
Who pays is clear.
Volume and season shown.
Figures agree across the slide.
Frequently asked questions
How do travel startups make money?
Mostly through commissions on bookings (Airbnb and RoadRe at 10%), selling tickets or tours (Oregon Sand Dune Tours at $45 a seat), margins on packaged trips (Nimbus, 23%), or advertising to travel brands (Knowhere's plan).
What should a travel business model slide include?
The fee or margin, the average booking value, costs passed on to suppliers, and the expected number of bookings, ideally with peak season marked.
Is it enough to say we take a commission?
No. BlaBlaCar's slide says "Commission based model" with no rate, so investors cannot work out revenue. Give the rate and the average booking value.
What mistakes do investors notice on travel business model slides?
Figures that conflict, such as $80 and $70 average prices on the same slide; charts with uneven scales; and potential partners presented without evidence of interest.
How we chose these examples
Corpus: published pitch deck teardowns on StartupFundraising.com. Founder-uploaded private decks are excluded.
Selection (2026-10-01): we searched extracted slide text across the full corpus for business model or revenue model slides that mention travel, hotels, bookings, trips or tours. 50 decks matched. We shortlisted 8 unused slides, viewed all 8 and kept 7.
Not used: Go To Emma p7 (retail software, not travel). Two other Airbnb deck copies in the library were not used to avoid repeating the same slide.
Review: stored slide images were read on 2026-10-01 against company, deck and slide number (editorial model review). No person has yet completed an editorial review of this page. We did not verify any company's revenue, fees or projections.