VidMob’s Series D deck is a lean, 12-slide presentation that focuses heavily on category leadership and social proof. Raising $110M in 2022, the company avoided the typical 'problem-solution' slog of early-stage decks, instead opting for a narrative of inevitability. They claim that creative is responsible for 70% of digital media effectiveness (Slide 4) and position themselves as the 'OS for Creative Operations' (Slide 12). The deck is notable for its lack of traditional financial slides—omitting a specific 'Ask,' detailed burn rates, or unit economics—relying instead on a stated 104% CAGR f…
Key takeaways
- Creative performance is cited as impacting up to 70% of digital media effectiveness, creating a high-stakes problem for marketers (Slide 2).
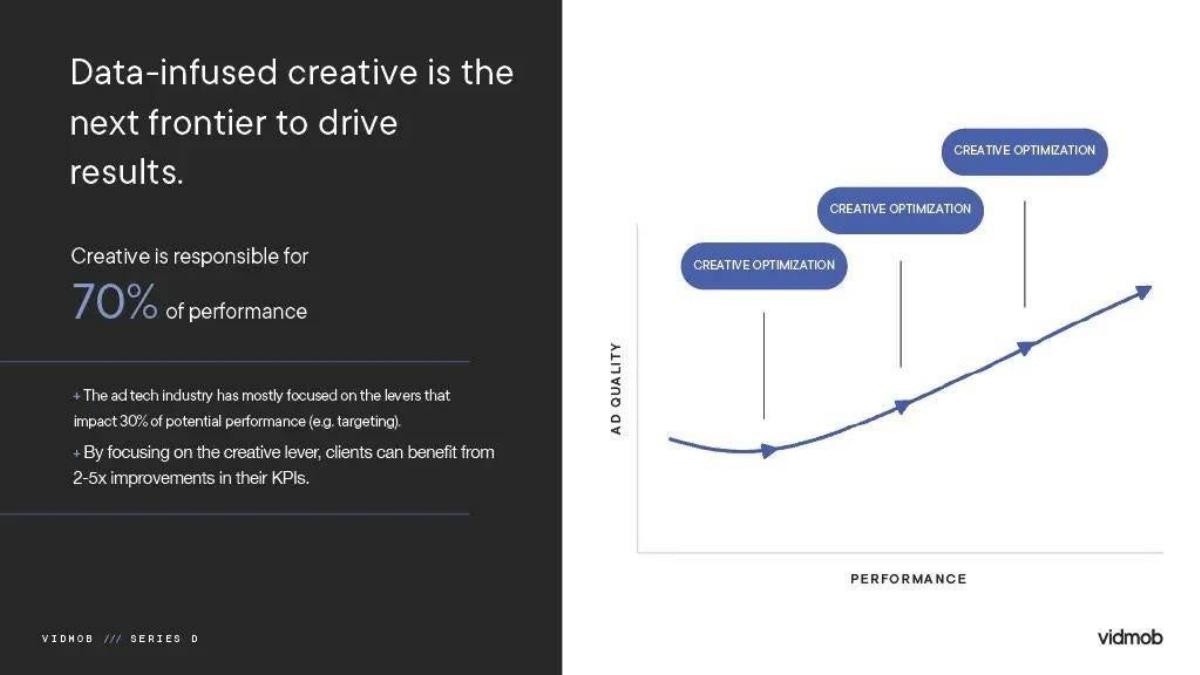
- The platform claims to deliver 2-5x improvements in client KPIs by focusing on the 'creative lever' rather than just targeting (Slide 4).
- VidMob has analyzed over 14.4 trillion impressions across 6 million creative assets, establishing a significant data moat (Slide 7).
- The company is the only one in the world badged as a creative marketing partner for every major modern digital ad platform (Slide 8).
- A 104% CAGR from 2017 to 2022 demonstrates consistent, high-velocity growth over a five-year period (Slide 12).
- The deck utilizes a 'Why Now?' slide to link their growth to macro trends like privacy regulations, cookie deprecation, and the creator economy (Slide 3).
- Specific case study results for the NFL include a +107% Click Through Rate and +262% Engagement Rate (Slide 11).
- The deck omits a specific funding 'Ask' or breakdown of use of funds, which is common in late-stage Series D rounds.
The Series D Narrative: From Tool to Operating System
VidMob’s 2022 Series D deck is a masterclass in late-stage storytelling. At this level, investors aren't looking for proof of concept; they are looking for proof of dominance. The deck, which supported a $110M raise, is remarkably concise at just 12 slides. It avoids the clutter of early-stage decks and instead focuses on a singular, powerful narrative: that creative is the only remaining lever for ad performance in a privacy-first world, and VidMob is the only platform that has mastered it.
Slide 1: The Credibility Cover
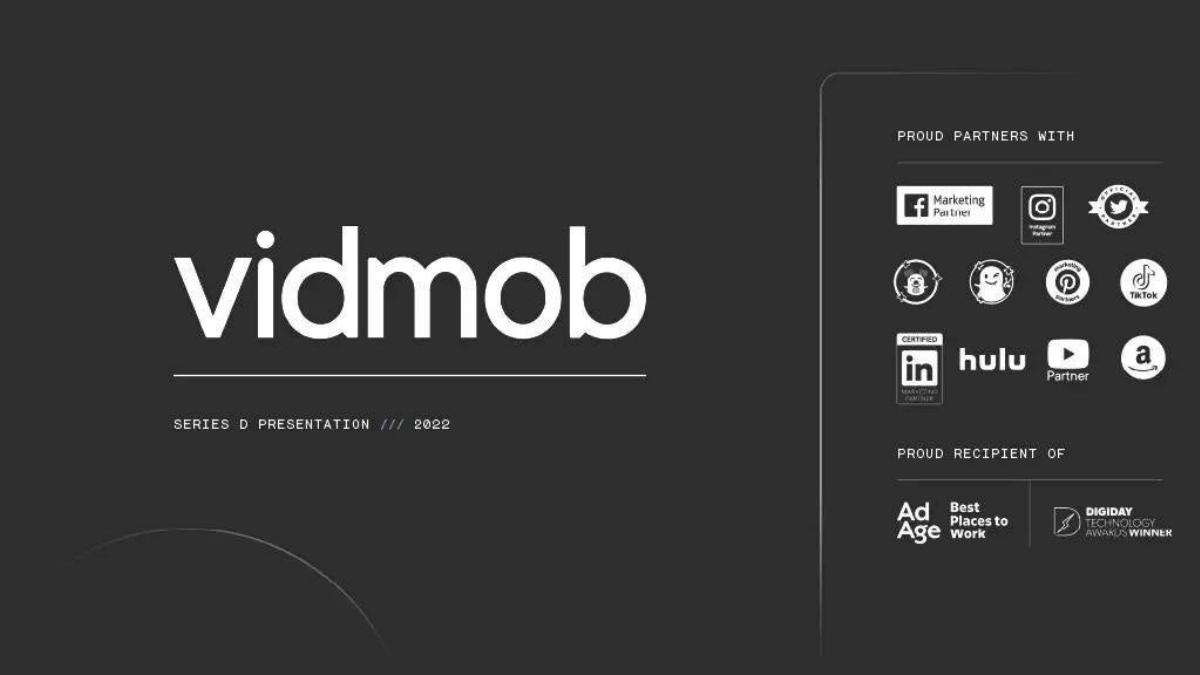
The title slide for VidMob does more than just state the company name. The right-hand side is dedicated to 'Proud Partners' and 'Proud Recipient' badges. By listing official partnerships with Facebook, Instagram, Twitter, Snapchat, Pinterest, TikTok, LinkedIn, Hulu, YouTube, and Amazon, VidMob immediately establishes itself as a central player in the ad-tech ecosystem. The inclusion of 'Ad Age Best Places to Work' and 'Digiday Technology Awards Winner' adds a layer of organizational health and industry recognition before a single word of the pitch is read.
Slide 2: The 70% Problem
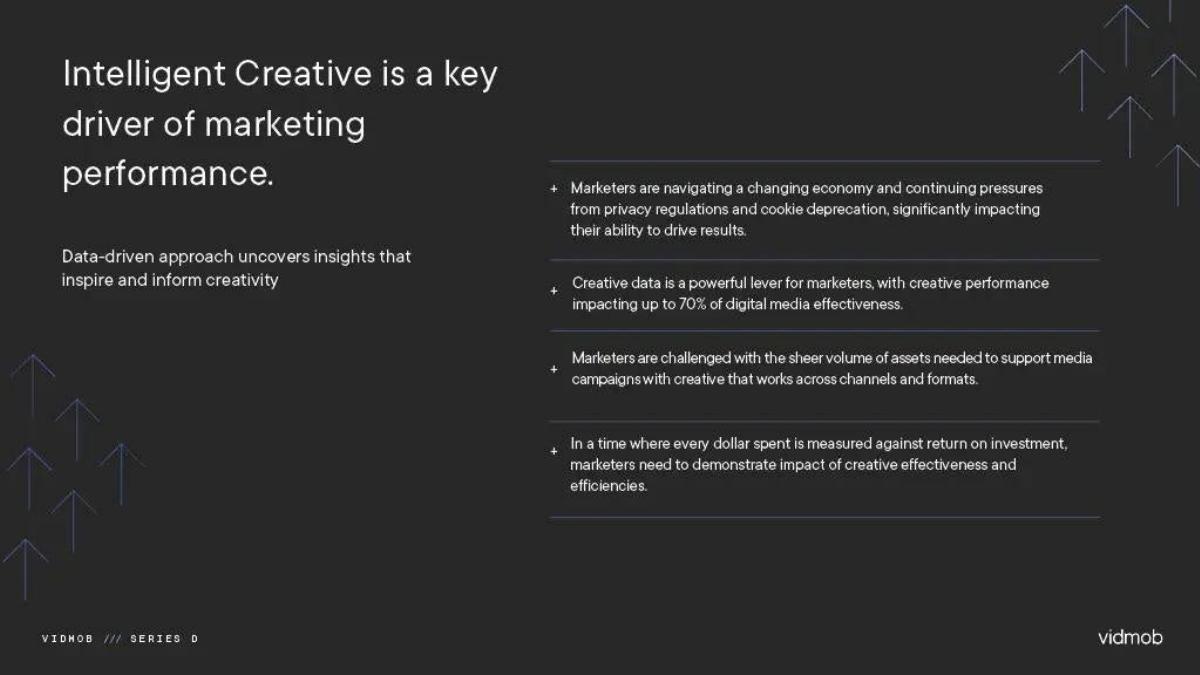
Slide 2 sets the stage by quantifying the problem. It states that 'creative performance impacting up to 70% of digital media effectiveness.' This is a critical figure that recurs throughout the deck. By framing the problem around privacy regulations and cookie deprecation, VidMob makes their solution feel like a necessary evolution rather than a luxury. They highlight the 'sheer volume of assets needed' as a secondary pain point, setting up their marketplace and automation features.
Slide 3: Why Now? The Convergence of Trends
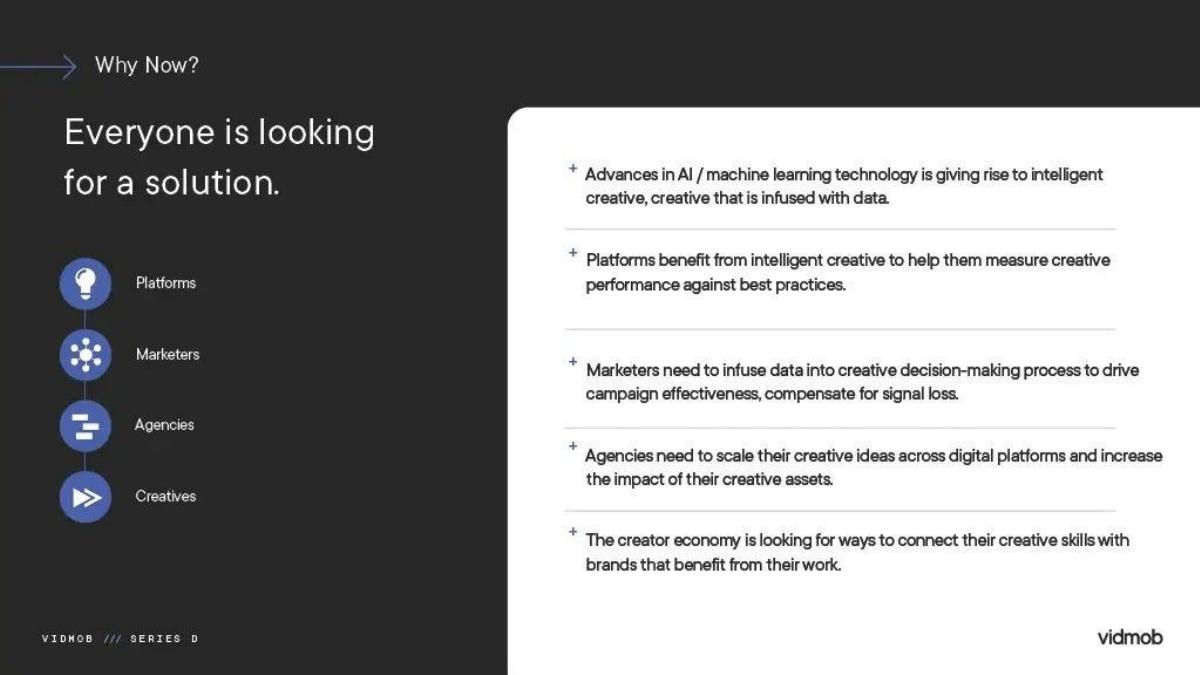
This slide addresses the 'Why Now?' question by mapping out the needs of four distinct groups: Platforms, Marketers, Agencies, and Creatives. It links the rise of AI/machine learning to the 'creator economy,' suggesting that VidMob is the bridge between these two worlds. This helps investors see the TAM (Total Addressable Market) not just as a static number, but as a growing tide of demand across the entire advertising value chain.
Slide 4: The Performance Gap
Slide 4 is perhaps the most important for the 'Solution' narrative. It contrasts the 'ad tech industry,' which has focused on the 30% of performance related to targeting, with VidMob’s focus on the 70% related to creative. The slide claims that 'clients can benefit from 2-5x improvements in their KPIs' by focusing on the creative lever. The visual graph shows 'Creative Optimization' as a series of steps that continually lift 'Ad Quality' and 'Performance,' illustrating a compounding benefit for users.
Slide 5: The Industry Standard
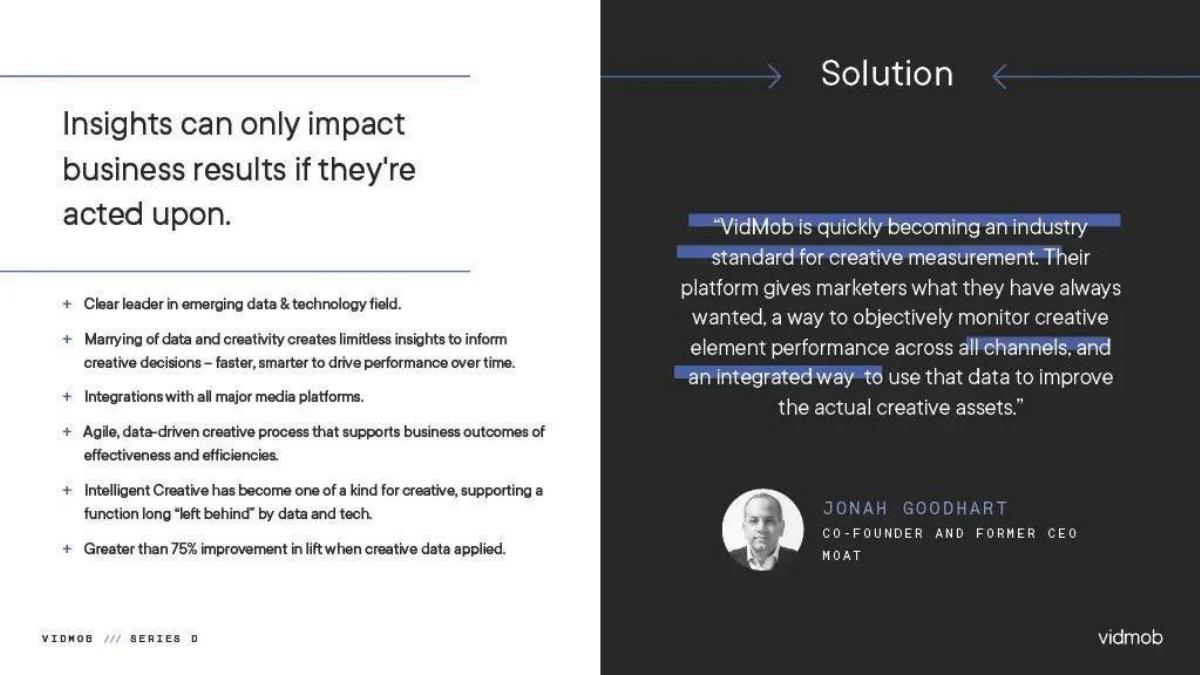
Slide 5 uses a quote from Jonah Goodhart, Co-Founder and former CEO of Moat, to validate VidMob as an 'industry standard for creative measurement.' Using a quote from a respected figure in the measurement space is a strategic move to preemptively answer questions about the validity of VidMob's data. The slide also claims a 'greater than 75% improvement in lift when creative data applied.'
Slide 6: The Product Architecture
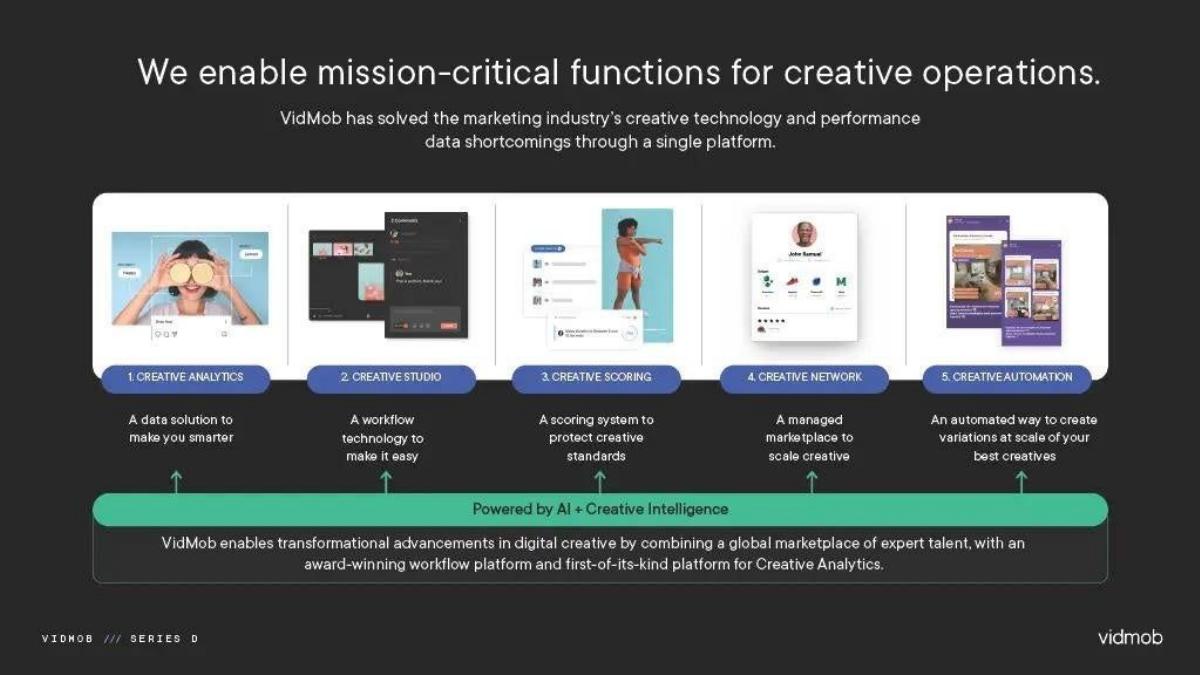
This slide breaks down the 'single platform' into five mission-critical functions: Creative Analytics, Creative Studio, Creative Scoring, Creative Network, and Creative Automation. This is the first time the deck explains how the product works. It positions the company as a hybrid of a SaaS platform and a managed marketplace, all 'Powered by AI + Creative Intelligence.'
Slide 7: The Data Moat
Slide 7 is a 'flex' slide. It states: 'We have analyzed over 14.4 trillion impressions across 6 million creative assets.' In the world of AI and machine learning, the winner is often the one with the most data. By showcasing this scale, VidMob tells investors that their algorithms have a head start that competitors will find difficult to replicate.
Slide 8: The Ecosystem Hub
Building on the cover slide, Slide 8 claims VidMob is the 'only company in the world badged as a creative marketing partner of every major modern digital ad platform.' The visual shows VidMob at the center of a wheel of logos, including Google, Meta, Amazon, and TikTok. This reinforces the 'OS' (Operating System) narrative—if you want to advertise everywhere, you have to go through VidMob.
Slide 9: The Client Roster
Slide 9 is a simple logo wall featuring '300+ companies around the world.' The logos are heavy hitters: Netflix, Adidas, Google, Pfizer, and L’Oréal. For a Series D investor, this slide represents de-risked revenue and a proven ability to sell into enterprise-level organizations.
Slide 10: The Voice of the Customer
Slide 10 provides qualitative social proof through three testimonials. Troy Hayes (Ulta) mentions a '2x lift in ROAS,' Nilson Kalili (ZX Ventures) mentions 'increasing our engagement by over 30%,' and Jeff Miller (Snapchat) calls them the 'closest and most-strategic ad production partner.' These quotes cover the three bases: ROI, engagement, and strategic partnership.
Slide 11: The NFL Case Study
Slide 11 provides a deep dive into a single high-profile client. The results are impressive: '+107% Click Through Rate, +262% Engagement Rate, +424% Video Completion Rate, and +40% Improved Cost Per View.' By showing the 'Challenge,' 'Solution,' 'Optimization,' and 'Results,' VidMob provides a repeatable blueprint for how they generate value.
Slide 12: The 'OS' and The Team
The final slide summarizes the company as the 'OS for Creative Operations.' It provides key company stats: 350+ employees, 10 offices, and a '2017-22E CAGR of 104%.' The leadership section is brief, showing only the three co-founders. Notably, this slide serves as the 'Team' slide, which is usually found much earlier in Seed or Series A decks. At Series D, the company's metrics and client list are the real 'team' investors are betting on.
What Works in This Deck
1. The 70/30 Narrative: By creating a simple, memorable statistic (creative is 70% of performance), VidMob gives investors a hook to hang the entire investment thesis on. It makes the problem feel massive and the solution feel like a mathematical necessity.
2. Extreme Social Proof: Between the platform badges (Slide 8), the 300+ logos (Slide 9), and the specific NFL metrics (Slide 11), the deck leaves no room for doubt regarding market fit. The company isn't just 'in the market'; it is the market leader.
3. Data Dominance: The mention of 14.4 trillion impressions (Slide 7) is a powerful way to signal a competitive moat. In a Series D, investors want to know why a new entrant can't just copy the software. VidMob’s answer is their massive, proprietary dataset.
What is Missing from This Deck
1. The Ask: There is no slide indicating how much money is being raised or how it will be spent. While common in late-stage decks where terms are often discussed in a separate data room, its absence is notable for founders looking to use this as a template.
2. Unit Economics: The deck mentions a 104% CAGR, but it says nothing about LTV (Lifetime Value), CAC (Customer Acquisition Cost), or churn rates. For a SaaS business, these are usually critical metrics.
3. Competitive Landscape: The deck completely ignores competitors. It positions VidMob as the 'only' company with certain badges, but it doesn't address how it wins against other creative automation or analytics tools. This reinforces the 'category creator' status but leaves a gap in market analysis.
Founder Tips: What to Copy
1. Lead with Partnerships: If you have official certifications or 'badged' status with major platforms (like AWS, Salesforce, or Google), put them on the cover. It provides instant institutional credibility.
2. Quantify the Problem: Don't just say 'ads are getting less effective.' Say 'creative impacts 70% of effectiveness.' A specific number, even if it’s an industry-standard estimate, makes the problem tangible.
3. Use a 'Why Now?' Slide: Especially in a changing regulatory environment (like privacy laws), explain why your solution is more relevant today than it was two years ago. This creates a sense of urgency for the investor.
4. Focus on Outcomes, Not Features: Slide 11 (NFL) is a perfect example of this. It doesn't talk about the buttons in the software; it talks about the +424% video completion rate. Investors buy outcomes, not tools.
Conclusion
VidMob’s Series D deck is a lean, aggressive presentation of market dominance. It successfully moves the conversation away from 'what we do' to 'why we are the industry standard.' By focusing on massive data scale and a 104% CAGR, they make the $110M investment feel like a bet on a sure thing—the inevitable 'Operating System' for the next era of digital advertising.
Frequently asked questions
- What is the primary problem VidMob solves according to the deck?
- VidMob addresses the 'signal loss' caused by privacy regulations and cookie deprecation. They argue that while the industry has focused on targeting (30% of performance), the creative itself is responsible for 70% of performance. Marketers are currently struggling to produce the volume of assets needed across channels while maintaining effectiveness, which VidMob solves through data-driven creative insights.
- How does VidMob quantify its market validation?
- Validation is shown through three lenses: scale, partnership, and performance. They have analyzed 14.4 trillion impressions (Slide 7), hold official badges from every major platform including Meta, Google, and TikTok (Slide 8), and work with over 300 companies including Netflix, Amazon, and Johnson & Johnson (Slide 9).
- What are the five core components of the VidMob platform?
- As detailed on Slide 6, the platform consists of: 1. Creative Analytics (data solution), 2. Creative Studio (workflow technology), 3. Creative Scoring (standards protection), 4. Creative Network (managed marketplace), and 5. Creative Automation (scaling variations). These are all powered by AI and Creative Intelligence.
- Why is the lack of a financial 'Ask' slide significant?
- In a Series D round, the 'Ask' is often pre-negotiated or part of a larger strategic narrative. By omitting a specific dollar amount or use-of-funds breakdown in the main deck, VidMob focuses the conversation on their role as the 'OS for Creative Operations' and their 104% CAGR, signaling that they are a market leader rather than a startup looking for a lifeline.
- How does VidMob use social proof to build credibility?
- The deck uses high-profile testimonials from executives at Ulta, ZX Ventures, and Snapchat (Slide 10). It also features a deep-dive case study on the NFL (Slide 11), showing specific percentage increases in CTR and engagement. This moves the value proposition from theoretical to proven across diverse, massive industries.