Viewmarket’s 7-slide deck from 2013 is an exercise in brevity, focusing heavily on the scale of the team and current revenue traction rather than technical product specifications. The company positions itself as a platform for local digital advertising, claiming to address a $20 billion market shift. With a reported $5M+ current run rate and 250% year-over-year growth as of January 2015, the deck relies on financial momentum to carry the narrative. However, the presentation lacks a formal 'Ask' slide, specific use of funds, or a detailed competitive analysis. It operates more as a high-level…
Key takeaways
- The deck identifies a $20 billion dollar shift in local digital advertising on slide 2.
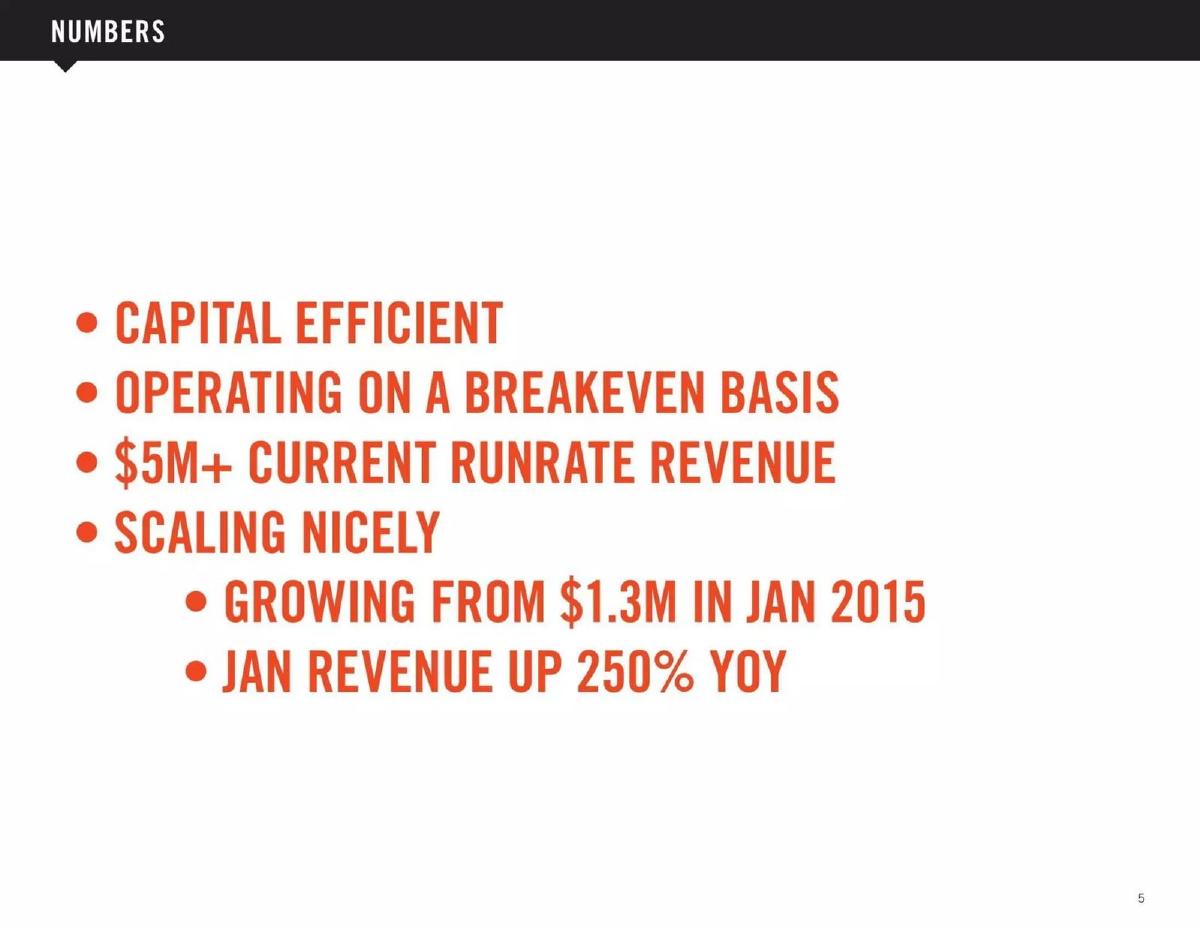
- Viewmarket claims a current revenue run rate of $5M+ on slide 5.
- The company reports being operating on a breakeven basis as of the time of the deck on slide 5.
- Revenue growth is cited as 250% year-over-year for January, according to slide 5.
- The team slide (slide 4) showcases a large organization including 8 full-time editors and over 300 freelance contributors.
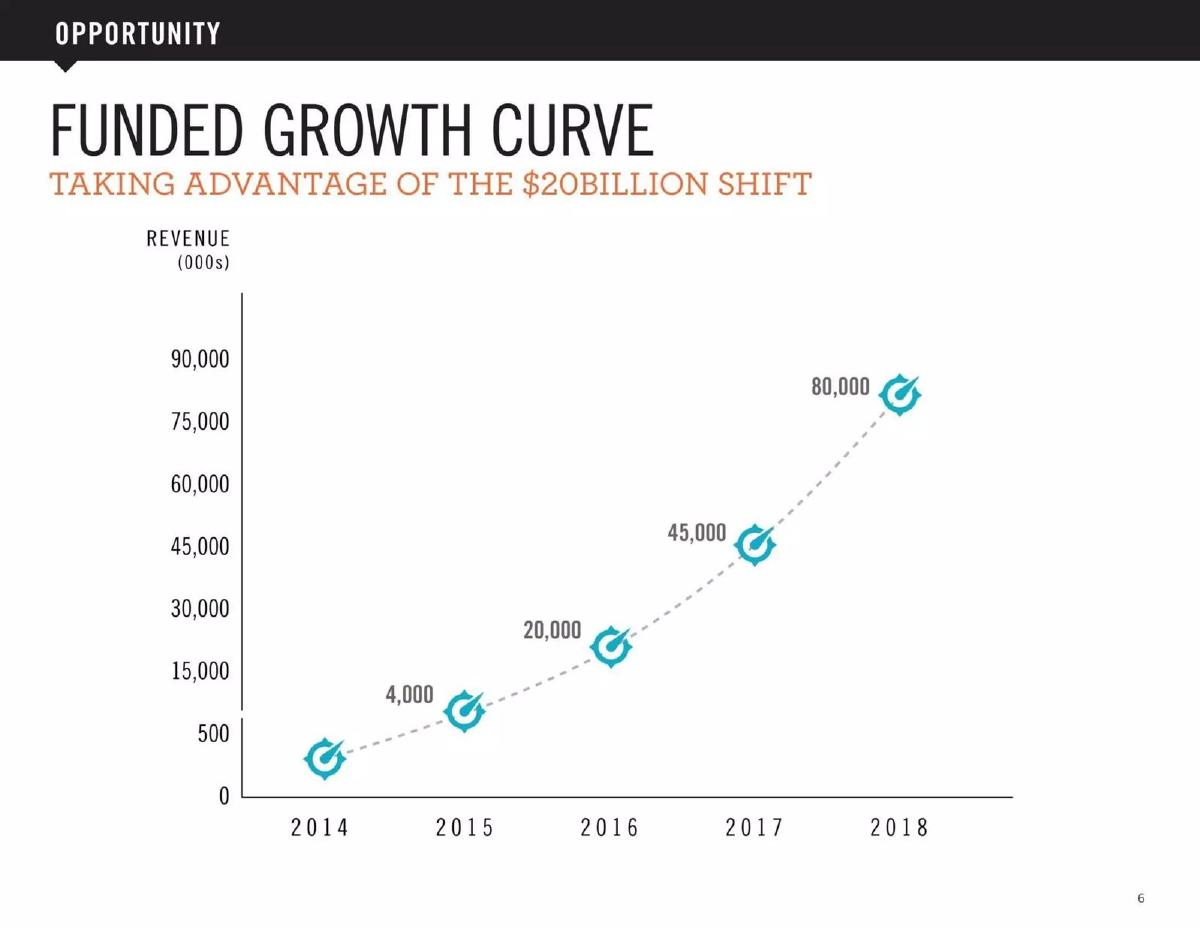
- The 'Funded Growth Curve' on slide 6 projects revenue reaching $80,000,000 by 2018.
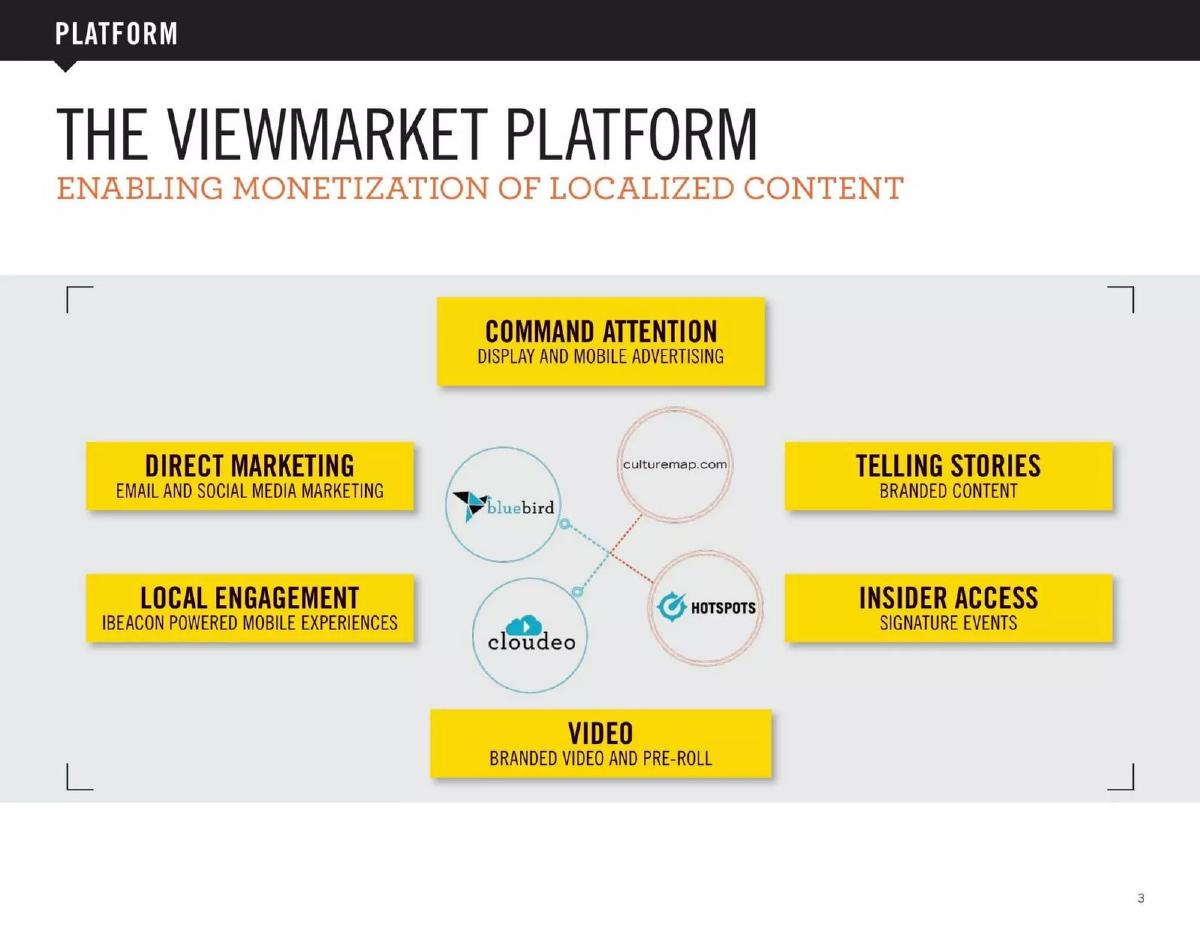
- The platform includes multiple sub-brands or components like culturemap.com, bluebird, and cloudeo, shown on slide 3.
- The deck completely omits a specific funding request or 'Ask' amount.
Overview of the Viewmarket 7-Slide Deck
The Viewmarket pitch deck, dating back to 2013 with updates reflecting 2015 data, is a remarkably short document. At only seven slides, it bypasses many of the traditional storytelling tropes of modern SaaS decks, such as the 'User Persona' or the 'Day in the Life' slides. Instead, it focuses on the scale of the operation and the immediate financial traction. The deck serves as a high-level summary of a media and advertising platform that has already achieved significant scale, claiming a $5M+ run rate and a breakeven operational status.
Slide 1: Title Slide
The deck opens with a minimalist title slide. It features a large, stylized 'M' logo above the word 'VIEWMARKET'. Below the main branding is a strip of five black-and-white images: a flower, a pair of high heels on a runway, an architectural interior, a bass guitar, and the rear light of a luxury car. These images suggest a focus on lifestyle, fashion, and high-end consumer categories, which aligns with the 'localized content' mission mentioned later in the deck.
Slide 2: The Opportunity
Slide 2 is titled 'OPPORTUNITY' and features the headline '$20 BILLION DOLLAR SHIFT' followed by 'LOCAL DIGITAL ADVERTISING'. The visual element is a large photograph of a severely cracked and buckled asphalt road. This is a classic 'problem' visual, suggesting that the current infrastructure of local advertising is broken or undergoing a seismic shift. However, the slide lacks specific data points or text explaining why this shift is happening or what specific pain points advertisers are facing. It relies entirely on the $20 billion figure to establish market size and the image to establish urgency.
Slide 3: The Platform
Slide 3, titled 'PLATFORM', introduces 'THE VIEWMARKET PLATFORM' with the subtitle 'ENABLING MONETIZATION OF LOCALIZED CONTENT'. This slide uses a hub-and-spoke diagram to show how different services and brands interact. At the center are four logos: bluebird, culturemap.com, cloudeo, and hotspots. Surrounding these are six yellow boxes detailing the platform's capabilities:
Command Attention: Display and mobile advertising. · Direct Marketing: Email and social media marketing. · Local Engagement: iBeacon powered mobile experiences. · Telling Stories: Branded content. · Insider Access: Signature events. · Video: Branded video and pre-roll.
This slide clarifies that Viewmarket is not just a single website but a multi-channel advertising and content ecosystem. The mention of 'iBeacon' dates the deck to a period when proximity-based mobile marketing was a major trend in retail tech.
Slide 4: The Team
Slide 4 is the 'TEAM' slide, and it is the most densely packed slide in the deck. It lists the two co-founders, Robert Bennett and Alexander Muse, noting they are 'serial entrepreneurs with multiple successful' outcomes (the text cuts off slightly). The left side of the slide breaks down the organizational structure:
Software Development: UI/UX designers, frontend/backend developers, and product management. · Sales Team: Six full-time professionals, including reps for specific cities and restaurants. · Editorial Staff: Eight full-time centralized editors, three city editors, and more than 300 freelance contributors. · Video: Two producers, two editors, and three hosts (100% contract). · Marketing: Three full-time professionals.
The right side of the slide features headshots for 20 team members. This slide is intended to show that Viewmarket is a mature organization with a significant 'boots on the ground' presence, particularly in editorial and sales, which is necessary for a localized content strategy.
Slide 5: The Numbers
Slide 5, titled 'NUMBERS', provides the primary evidence of traction. It uses five bullet points to convey the company's financial health:
CAPITAL EFFICIENT · OPERATING ON A BREAKEVEN BASIS · $5M+ CURRENT RUNRATE REVENUE · SCALING NICELY · GROWING FROM $1.3M IN JAN 2015 · JAN REVENUE UP 250% YOY
The inclusion of 'Jan 2015' suggests this deck was updated well after its initial 2013 creation. The claim of being breakeven while maintaining 250% year-over-year growth is a strong signal to investors that the business model is validated and that new capital would be used for acceleration rather than basic survival.
Slide 6: The Growth Curve
Slide 6 returns to the 'OPPORTUNITY' header but focuses on the 'FUNDED GROWTH CURVE'. It features a bar/line chart showing revenue in thousands (000s) from 2014 to 2018. The data points are:
2014: Revenue appears to be near zero or negligible on the chart scale. · 2015: 4,000 ($4M). · 2016: 20,000 ($20M). · 2017: 45,000 ($45M). · 2018: 80,000 ($80M).
The chart is labeled 'Taking advantage of the $20 billion shift.' This is a standard 'hockey stick' projection, but it is notable that the company expects to jump from $4M to $20M in a single year, a 5x increase. There is no explanation provided on the slide for how this massive jump will be achieved, other than the implication that it is 'funded' growth.
Slide 7: Contact
The final slide is a 'CONTACT' slide. It provides the phone numbers, physical addresses (411 W. Monroe Street, Austin, Texas), and email addresses for Robert Bennett (CEO) and Alexander Muse (Co-Founder). It also includes a Twitter handle for Muse (@amuse). The use of '@culturemap.com' email addresses confirms that CultureMap is a primary entity within the Viewmarket portfolio.
What Works in This Deck
The most compelling aspect of the Viewmarket deck is its focus on traction and efficiency . In an era where many startups burn through cash to find product-market fit, Viewmarket’s claim on slide 5 that they are 'Operating on a breakeven basis' with a '$5M+ current runrate' is a powerful differentiator. It tells investors that the founders know how to build a real business, not just a product.
The Team slide (Slide 4) is also a strength. By listing the specific counts of editors, sales reps, and freelancers, the company demonstrates the scale of its operations. For a media-heavy business, having a network of 300+ contributors is a significant moat that is difficult for a new competitor to replicate quickly. It shows that the 'localized' part of their value proposition is backed by actual human capital in those localities.
Finally, the Platform slide (Slide 3) does a good job of showing the various revenue streams. By breaking down monetization into six distinct categories (Direct Marketing, Video, Events, etc.), they show that they aren't reliant on a single, volatile ad format. This diversification suggests a more stable and resilient business model.
What Is Missing From This Deck
The most glaring omission is the 'Ask' . There is no slide indicating how much money the company is looking to raise, what the valuation expectations are, or what the specific milestones for the next 18 months will be. While slide 6 shows a 'Funded Growth Curve,' it doesn't say how much funding is required to hit those numbers. This makes the deck feel more like a general company overview than a specific fundraising tool.
There is also a complete lack of Competitive Analysis . The local digital advertising space is notoriously crowded, with players ranging from Yelp and Groupon to local news conglomerates and Facebook’s local ad tools. Viewmarket does not explain why their platform is superior to these incumbents or how they plan to defend their market share as they scale from $4M to $80M.
Furthermore, the Problem/Solution narrative is very thin. Slide 2 identifies a '$20 Billion Dollar Shift,' but it doesn't explain the mechanics of that shift. Why are advertisers moving? What is wrong with the current solutions? Without this context, the 'Solution' (the platform on slide 3) feels like a list of features rather than a targeted answer to a specific market pain point.
Lastly, there are no Unit Economics . While the total revenue and growth are impressive, investors in 2013-2015 would likely want to see the Cost Per Acquisition (CPA) for new advertisers and the Lifetime Value (LTV) of those clients, especially given the large sales team mentioned on slide 4. High revenue is less impressive if the cost to acquire that revenue is unsustainable.
What a Founder Should Copy
Founders should emulate the clarity of traction shown on slide 5. Using bold, easy-to-read bullet points to highlight 'Breakeven' and 'Runrate' is much more effective than burying those numbers in a complex spreadsheet or a long paragraph. If you have revenue, lead with it.
The organizational breakdown on the team slide is also worth copying. Instead of just showing four co-founders, showing the 'Software Development,' 'Sales Team,' and 'Editorial Staff' counts gives a sense of the company's actual capacity. It proves that there is a functional machine behind the pitch.
Finally, the visual consistency of the deck is strong. The use of a consistent header bar with a small arrow pointing to the current section (Opportunity, Platform, Team, etc.) helps the viewer keep track of the narrative flow. It is a simple design choice that makes the deck feel professional and organized, despite its brevity.
Conclusion
The Viewmarket deck is a 'traction-first' presentation. It relies on the strength of its existing business—specifically its $5M+ revenue and breakeven status—to generate interest. While it lacks the depth of a full Series A deck (missing competition, unit economics, and a clear ask), it serves as an excellent example of how to present a mature, revenue-generating startup. It moves quickly past the 'vision' and focuses on the 'reality' of a scaling business, which is often exactly what later-stage investors want to see.
Frequently asked questions
- What is the core problem Viewmarket is solving?
- The deck is somewhat vague on the specific technical problem, but slide 2 uses an image of a broken road to symbolize a '$20 Billion Dollar Shift' in local digital advertising. It implies that traditional local advertising is broken or transitioning, and Viewmarket’s platform (slide 3) provides the infrastructure for 'monetization of localized content' through branded video, display ads, and mobile experiences.
- How much money is Viewmarket looking to raise?
- The deck does not state a specific funding goal. There is no 'Ask' slide or 'Use of Funds' breakdown. Slide 6 shows a 'Funded Growth Curve,' which suggests that the projected revenue of $80M by 2018 is contingent on receiving capital, but the actual dollar amount required to reach those milestones is omitted from this version of the presentation.
- What does the Viewmarket platform actually do?
- According to slide 3, the platform enables monetization through several channels: display and mobile advertising, email and social media marketing, iBeacon-powered mobile experiences, branded content, signature events, and branded video/pre-roll. It appears to be a conglomerate of digital media services and technologies, including entities like culturemap.com and cloudeo.
- What is the current financial status of the company?
- As of slide 5, Viewmarket describes itself as 'Capital Efficient' and 'Operating on a breakeven basis.' It claims a current revenue run rate of over $5 million. The slide also notes that January revenue was $1.3 million in 2015, representing a 250% increase compared to the previous year.
- Who is leading the company?
- The company was co-founded by Robert Bennett (CEO) and Alexander Muse. Slide 4 describes them as serial entrepreneurs with multiple successful ventures. The team is notably large for an early-stage deck, featuring a full sales team, an editorial staff with over 300 freelancers, and a dedicated software development group.