The Fall 2016 UCT investor presentation serves as a detailed progress report for a mature player in the semiconductor supply chain. With Q3 2016 revenue of $146M and a quarter-over-quarter growth rate of 12.6%, the company positions itself as a critical partner for OEMs, handling everything from design to production. The deck highlights a clear path toward operational efficiency, targeting a long-term gross margin of 15% to 18%. While the presentation excels at showing technical breadth—ranging from gas delivery systems to 3D printing—it relies heavily on industry-specific tailwinds like node…
Key takeaways
- UCT reported Q3 2016 revenue of $146M, representing a 12.6% increase over the previous quarter (Slide 4).
- The company positions itself as a leader in design, engineering, and manufacturing for the semiconductor capital equipment industry (Slide 4).
- UCT estimates its market share in the semi-equipment manufacturing landscape at 5%, with 44% of the market still held by OEM in-sourcing (Slide 10).
- Technical capabilities span manufactured components, chemical delivery sub-systems, and complete assemblies (Slide 13).
- Long-term financial targets include a gross margin of 15% - 18% and an operating margin of 8% - 10% (Slide 16).
- The business model is driven by revenue growth, low operating expenses, and strategic acquisitions (Slide 16).
- A detailed reconciliation shows non-GAAP net income reaching $0.17 per diluted share for the quarter ending Sept 23, 2016 (Slide 22).
- The deck identifies node transitions in logic (10nm) and DRAM (<=20nm) as key industry drivers for growth (Slide 4).
UCT Fall 2016 Investor Presentation: A Strategic Breakdown
The UCT (Ultra Clean Holdings) investor presentation from Fall 2016 provides a window into the specialized world of semiconductor manufacturing services. Unlike early-stage startup decks that focus on vision and unproven markets, this presentation is a data-heavy report for a company operating at scale. With quarterly revenues exceeding $140 million, the narrative focuses on incremental growth, operational efficiency, and capturing market share from OEM in-sourcing.
Slide 1: Title and Visual Identity
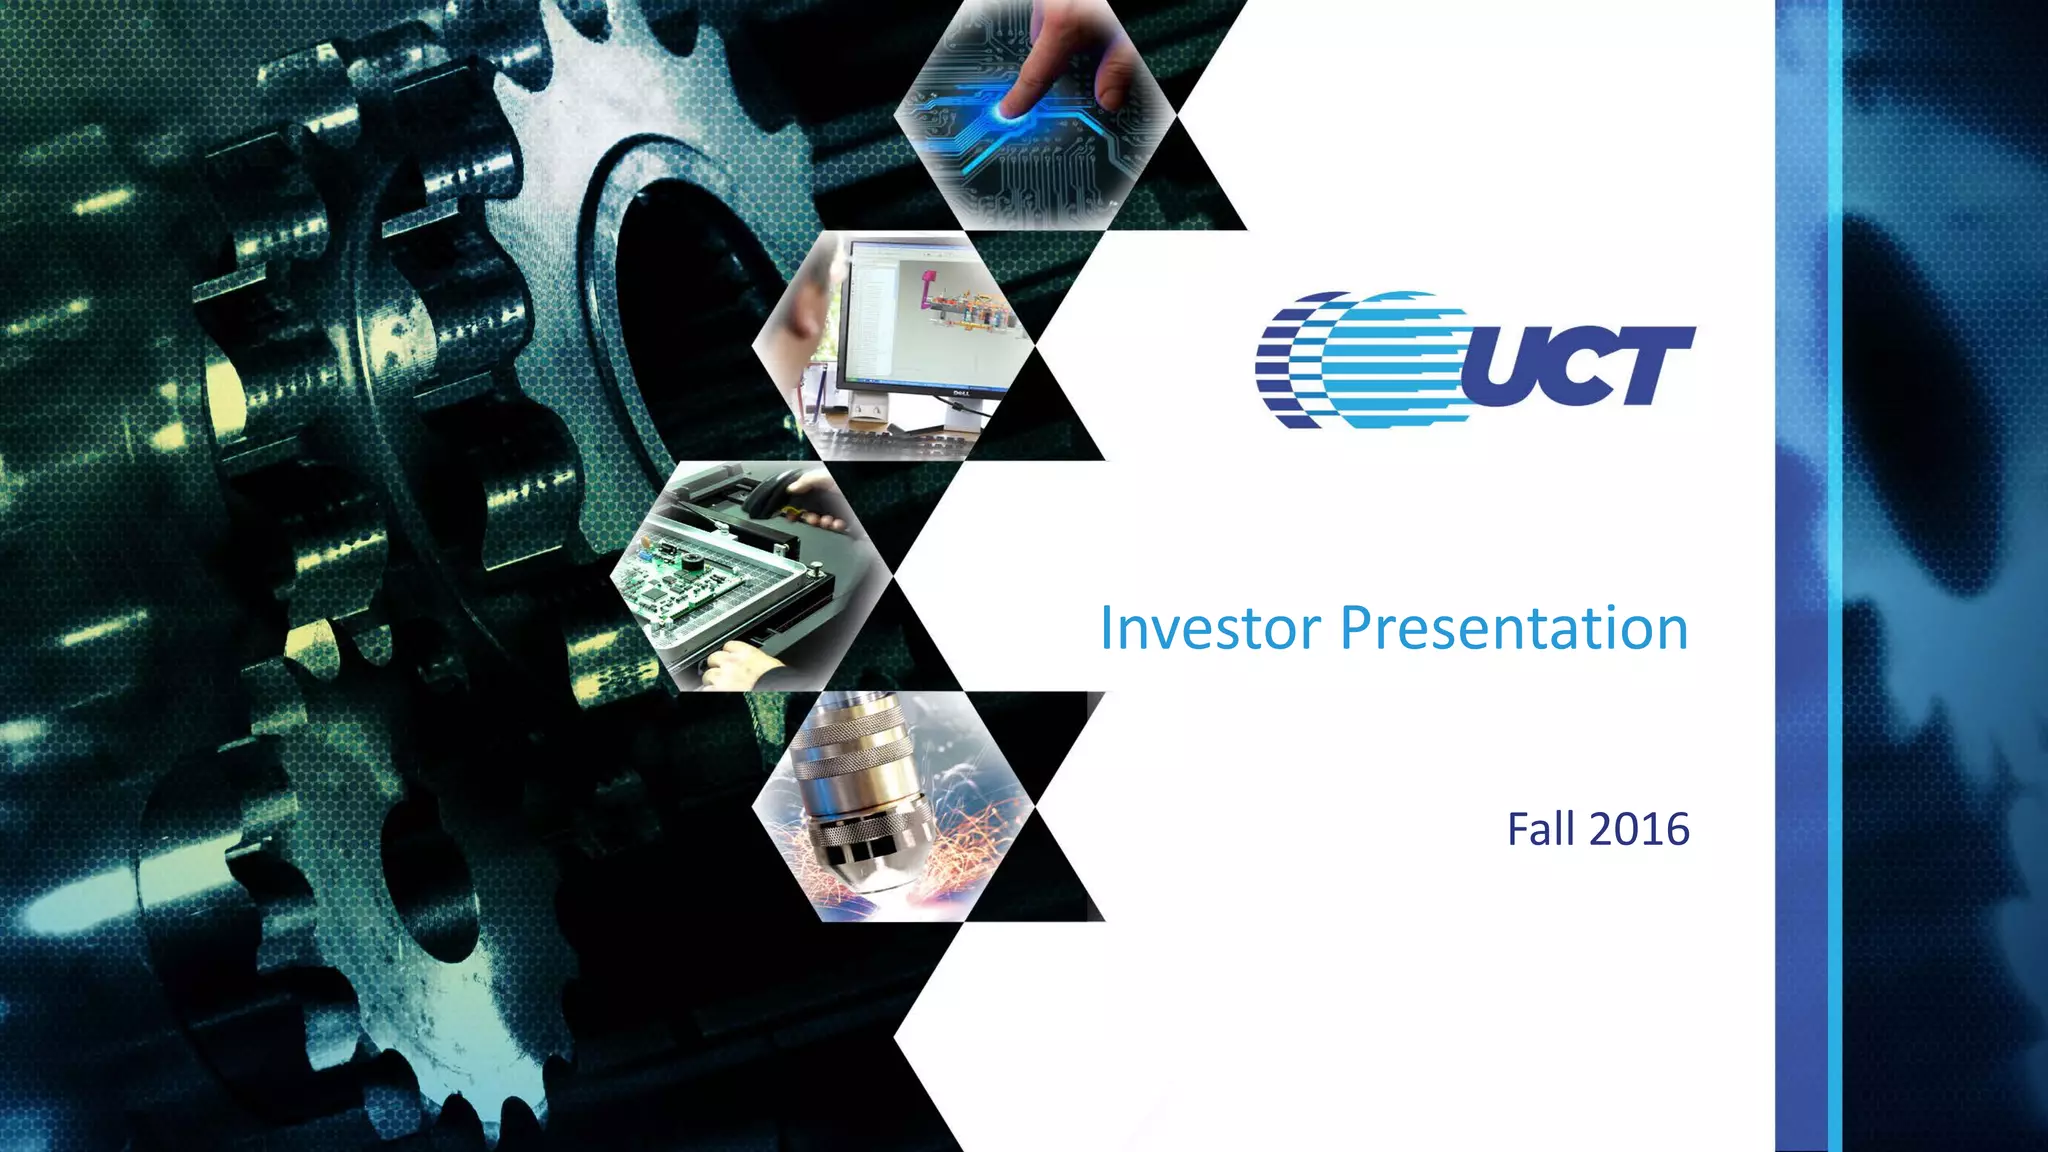
The cover slide establishes a professional, industrial tone. It features the UCT logo and the title 'Investor Presentation Fall 2016.' The imagery uses a hexagonal grid containing photos of circuit boards, CAD design software, precision machining, and robotic welding. This immediately signals that UCT is a high-tech hardware and engineering firm. The presence of gears and mechanical components suggests a focus on the physical infrastructure of technology.
Slide 4: UCT Highlights and Q3 Performance
This slide serves as the executive summary. It defines UCT as a 'Global leader in design, engineering and manufacturing of critical modules, subsystems and turnkey solutions primarily for the semiconductor capital equipment industry.' The key metrics listed are impressive for the period: Q3’16 revenue of $146M, which was a 12.6% increase quarter-over-quarter. It also notes a non-GAAP diluted EPS of $0.17. The slide points to industry tailwinds, specifically node transitions in logic (10nm) and DRAM ( UCT uses this slide to illustrate their end-to-end service model. The workflow moves from Prototyping/Development to Manufacturing Engineering, Supply Chain Management, Manufacturing, and finally Integration & Test. The text highlights a 'Network of global, strategic partners' and the ability to 'Reduce customer overhead through UCT expertise in qualifying and managing complex supplier base.' The value proposition here is twofold: aggregated buying power and improved delivery times for their customers. This positioning is critical for a contract manufacturer looking to prove they are more than just a 'build-to-print' shop.
Slide 10: Semi Equipment Manufacturing Landscape
This is a crucial market share slide. It uses a 3D pie chart to visualize the manufacturing landscape. UCT claims a 5% market share. The most significant takeaway is that 44% of the market is still 'OEM Integration In-Sourcing.' This represents UCT’s primary growth opportunity: convincing OEMs to outsource more of their internal manufacturing. The slide also identifies OEM Component Suppliers (34%), Major Contract Manufacturers (11%), and Other Contract Manufacturers (6%) as the remaining players. By showing that nearly half the market is still in-sourced, UCT argues there is a massive 'low-hanging fruit' opportunity for professional outsourcing firms.
Slide 13: Growing Suite of Critical Process Capabilities
This slide provides a granular look at what UCT actually makes. It categorizes capabilities into three buckets: Manufactured Components (Frames, Machining Metals, Sheet Metal Forming, Machining Plastics, Heaters, 3D Printing, Prototype Machining), Chemical Delivery Sub-Systems (Gas and Liquid), and Complete Assemblies (Assembly Integration & Test). The 'GAS' delivery box is highlighted, suggesting it is a core or high-growth competency. The inclusion of 3D printing indicates that UCT was investing in additive manufacturing as early as 2016 to stay ahead of traditional machining limitations.
Slide 16: UCT Business Model and Targets
This slide shifts the focus to financial strategy. It lists three key differentiators: higher value capabilities, improved operational efficiencies, and low capital requirements. The 'Long-term Target' chart is the centerpiece, showing a goal of 15% - 18% Gross Margin and 8% - 10% Operating Margin. Under 'Operating Profit Drivers,' the company lists revenue growth, low operating expenses, and strategic acquisitions. This is a classic 'operating leverage' story, where the company argues that as it grows, its margins will expand because its fixed costs won't rise as fast as its revenue.
Slide 21: Closing
The presentation concludes with a 'Thank You' slide that mirrors the cover art. It lacks a specific 'Ask' or call to action, which is standard for a public company investor presentation where the goal is to inform the market rather than solicit a specific round of private funding. It maintains the industrial branding established at the beginning.
Slide 22: Financial Reconciliation
The final slide is a technical appendix: 'Reconciliation: GAAP Earnings Per Diluted Share to Non-GAAP Earnings Per Diluted Share.' It provides a three-quarter comparison (Sept 2015, June 2016, Sept 2016). It shows how the company arrives at its $0.17 non-GAAP figure by adding back amortization of intangible assets ($0.04), executive transition costs ($0.03), and adjusting for tax effects. This level of detail is intended to build trust with institutional investors and analysts who need to understand the 'clean' earnings power of the business excluding one-time or non-cash charges.
What UCT Does Well
The deck is exceptionally clear about its market positioning. By identifying the 44% of the market that is still in-sourced by OEMs, UCT creates a compelling narrative for growth that doesn't rely solely on stealing market share from direct competitors. The technical breakdown on slide 13 is also highly effective; it moves the company away from being a generic manufacturer and into a specialized engineering partner with specific competencies in gas and liquid delivery.
What Is Missing
As this is a public-facing investor deck for a mature company, it lacks the 'Team' slide typically found in startup pitches. While it mentions 'executive transition costs' in the financials, it does not introduce the leadership team or their specific backgrounds. Additionally, there is no detailed competitive matrix. While slide 10 shows the percentages of the market, it does not name the 'Major Contract Manufacturers' or explain why UCT wins against them specifically. Finally, the deck does not provide a long-term roadmap for new product categories beyond the current suite of capabilities.
Founder Takeaways
Founders in the hardware or manufacturing space should study how UCT categorizes its services. By grouping capabilities into 'Components,' 'Sub-systems,' and 'Complete Assemblies,' they show a clear path up the value chain. Another key takeaway is the use of the GAAP to non-GAAP reconciliation. For companies with complex accounting (like those doing acquisitions or heavy R&D), being transparent about how you calculate 'real' profit is essential for investor confidence. Lastly, UCT’s focus on 'low capital requirements' as a differentiator is a powerful message for any manufacturing business, as it addresses the common investor fear of high-CAPEX models.
Frequently asked questions
- What is UCT's primary market focus?
- UCT focuses on the semiconductor capital equipment industry. As stated on slide 4, they provide critical modules, subsystems, and turnkey solutions. Their growth is tied to semiconductor wafer equipment spending and industry transitions to smaller nodes, specifically 10nm for logic and 20nm or less for DRAM.
- How does UCT differentiate its business model?
- According to slide 16, UCT's model relies on three key differentiators: higher value capabilities, improved operational efficiencies, and low capital requirements. They aim to drive profit through revenue growth, maintaining low operating expenses, and pursuing strategic acquisitions to expand their technical footprint.
- What is the competitive landscape for UCT?
- Slide 10 provides a breakdown of the semi-equipment manufacturing landscape. UCT holds a 5% share. The largest portion of the market (44%) is OEM Integration In-Sourcing, followed by OEM Component Suppliers at 34%. Major contract manufacturers represent 11%, while other contract manufacturers hold 6%.
- What specific manufacturing capabilities does UCT highlight?
- Slide 13 outlines a 'Growing Suite of Critical Process Capabilities.' This includes manufactured components like frames, machined metals/plastics, and sheet metal forming. It also covers chemical delivery (gas and liquid) and complete assemblies involving integration and testing. Notably, they also list 3D printing and heaters as capabilities.
- What were UCT's financial highlights for Q3 2016?
- As shown on slide 4 and slide 22, UCT achieved $146M in revenue for Q3 2016. Their GAAP diluted EPS was $0.08, while their non-GAAP diluted EPS was $0.17. The non-GAAP figure excludes costs such as intangible asset amortization, executive transition costs, and specific tax valuation allowances.