OpenSpace's deck is structured as a three-act 'Company Update,' moving from the origins of the problem to current traction and future vision. Founded in 2017, the company addresses the stagnation of construction productivity compared to manufacturing, which has nearly doubled since 1994 (Slide 6). By utilizing 360-degree video capture attached to hard hats, OpenSpace creates a digital record of job sites. The deck leans heavily on the technical pedigree of its founders, featuring alumni from MIT, Stanford, and companies like Twitter and 3DR. While the provided slides lack specific financial f…
Key takeaways
- The deck frames the product as a 'Read-Only Time Machine' for construction sites (Slide 3).
- Macroeconomic data from McKinsey & Company is used to show that infrastructure investment will double in 15 years (Slide 5).
- A stark contrast is drawn between manufacturing productivity growth and flat construction productivity since 1994 (Slide 6).
- The core mission is defined as breaking the 'tight coupling' between workers, time, and location (Slide 8).
- The company identifies three primary KPIs for its growth: Headcount, Sq Ft Captured, and Revenue (Slide 9).
- The V1 prototype is shown as a simple 360 camera mounted on a standard white hard hat (Slide 10).
- The team slide highlights significant academic credentials, including multiple PhDs and MS degrees from MIT and Stanford (Slide 12).
- Future strategy is divided into two pillars: improving data quality and converting that data into actionable insights (Slide 14).
Introduction: The Narrative of the Company Update
OpenSpace, founded in 2017 and headquartered in San Francisco, operates in the construction technology (ConTech) sector. With over $200 million raised to date, this deck represents a 'Company Update' rather than a traditional seed-stage pitch. The structure is narrative-heavy, utilizing a three-part framework: 'Where did we start?', 'Where are we now?', and 'Where are we going?' This approach is common for later-stage companies that need to reinforce their original thesis while demonstrating the evolution of their product and market fit.
Section 1: The Macro Problem and the Thesis
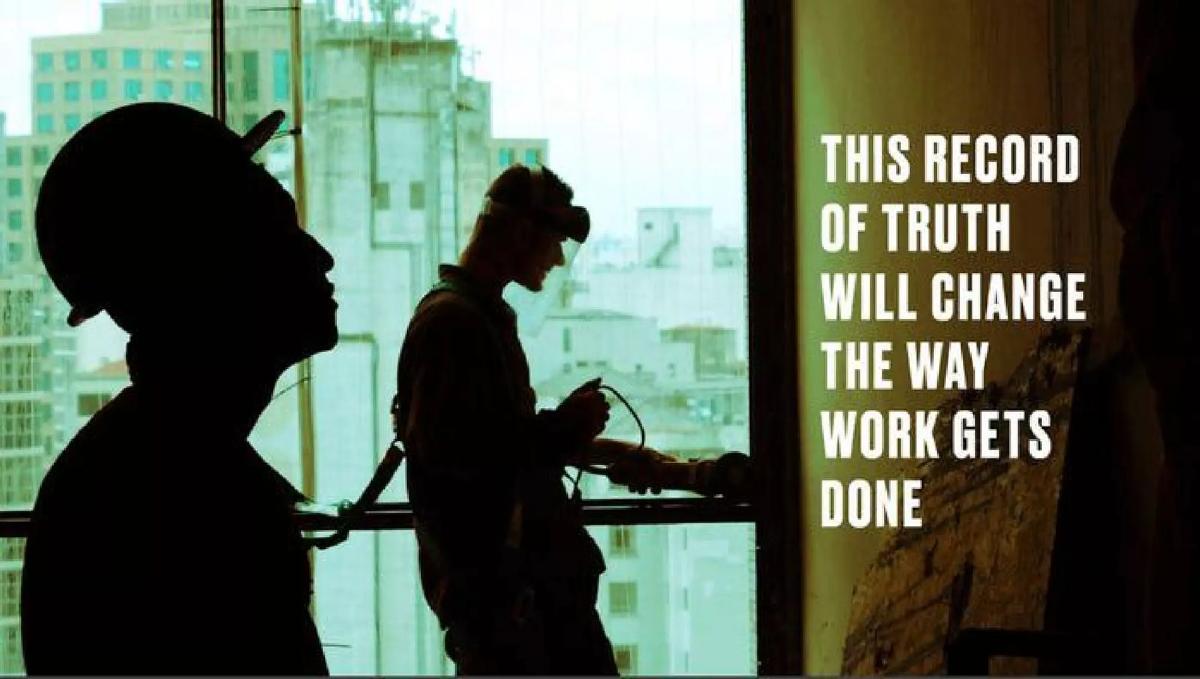
Slide 1 serves as the title card, featuring the OpenSpace logo and a high-resolution image of hard hats on a job site. The text is simple: 'Company Update.' This sets an professional, internal-facing tone.
Slide 2 introduces the first act: '1 Where Did We Start?' This section is designed to ground the investor in the 'Why' of the company's existence.
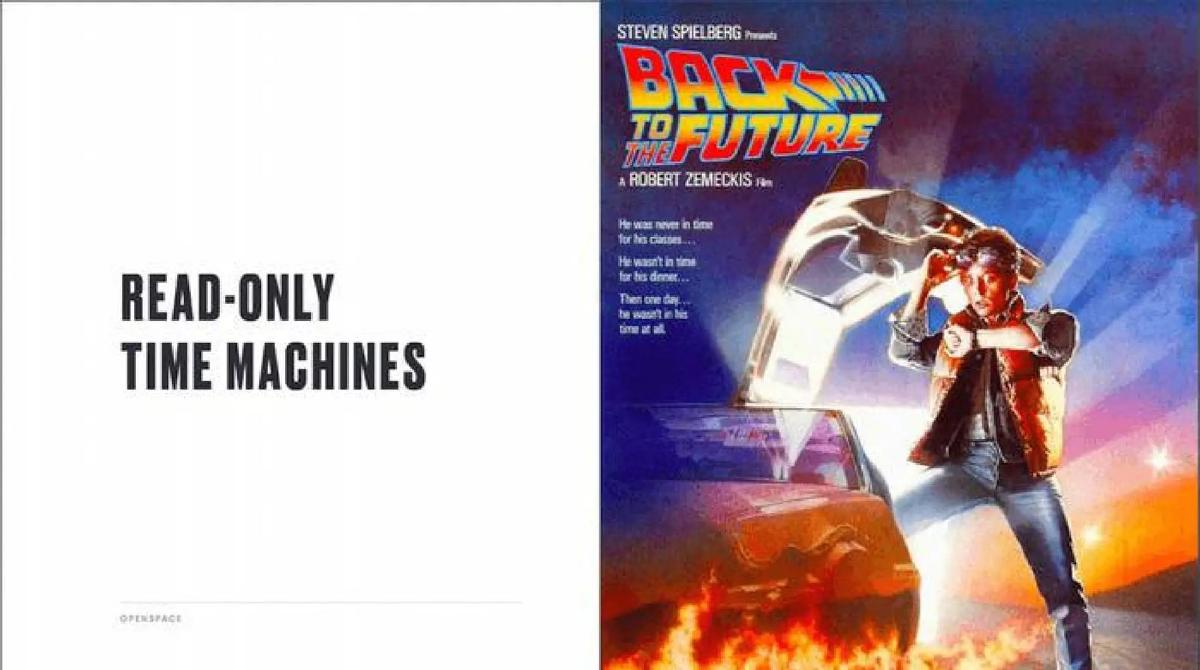
Slide 3 uses a pop-culture reference, showing the poster for 'Back to the Future' alongside the phrase 'Read-Only Time Machines.' This is a metaphorical way to describe their product—a tool that allows stakeholders to look back at any point in a construction project's history to see exactly what was behind a wall or under a floor before it was closed up.
Slide 4 transitions to the specific industry: 'Real Estate Development and Construction,' accompanied by an aerial photo of a dense, active construction site. This defines the playground.
Slide 5 brings in external validation via a McKinsey & Company chart. The slide states, 'We have an acute need to build our way out of some global scale problems.' The chart shows that global infrastructure investment by industry (Real Estate, Transportation, Energy/Utilities) is projected to double in the next 15 years, reaching $13 trillion by 2030. This establishes a massive, growing Total Addressable Market (TAM).
Slide 6 highlights the 'Productivity Gap.' Another McKinsey chart shows that manufacturing productivity has nearly doubled since 1994, while construction productivity has remained flat. The text 'We don't have the people or tools to get the job done' frames the labor shortage and technological stagnation as a crisis that OpenSpace is positioned to solve.
Section 2: The Solution and Initial Traction
Slide 7 is a simple transition: 'OpenSpace exists to help solve this problem.' It bridges the gap between the macro economic issues and the company's specific mission.
Slide 8 defines the core value proposition: 'We will break the tight coupling between workers, time, and location.' In construction, progress is traditionally tracked by having a person physically present at a specific time to record data. OpenSpace proposes to decouple these, likely through automated, passive capture that allows anyone to view the site from anywhere at any time.
Slide 9 outlines the company's internal scoreboard. It lists three key numbers: 1. Headcount, 2. Sq Ft Captured, 3. Revenue. By listing headcount first, the company emphasizes its organizational growth, while 'Sq Ft Captured' serves as the primary metric for product adoption and data moat building.
Slide 10 shows the 'V1 Prototype Product—In Stealth Mode.' The image is a low-fidelity photo of a 360 camera strapped to a white hard hat. This slide is likely intended to show how much the company has accomplished starting from a simple hardware hack, emphasizing a 'lean' start to a complex problem.
Section 3: The Team and Current Status
Slide 12 is the 'OpenSpace Team' slide, and it is arguably the strongest slide in the deck for a later-stage investor. It features eight key members, emphasizing deep technical and operational experience. CEO Jeevan Kalanithi is noted for his time at 3DR and Sifteo (sold to 3DR), with degrees from MIT and Stanford. Chief Scientist Mike Fleischman and CTO Philip DeCamp both hold PhDs from MIT. The slide also lists experience from Twitter, Google, NASA JPL, and Bluefin Labs. The sheer density of advanced degrees (PhDs and MSs) from top-tier institutions (MIT, Stanford, Caltech, Brown, UC Berkeley) signals to investors that this is a 'hard tech' company capable of solving complex computer vision problems.
Section 4: The Future Vision
Slide 14 , titled 'The New Hotness,' provides a glimpse into the product roadmap. It lists two priorities: '1 Making the data better' and '2 Turning the data into insights.' This suggests a transition from a passive recording tool to an active intelligence platform. 'Making the data better' likely refers to higher resolution, better mapping, or faster processing, while 'Turning the data into insights' implies AI-driven analysis—perhaps identifying safety hazards, tracking material quantities, or predicting schedule delays automatically.
What Works in This Deck
Strong Narrative Arc: The deck doesn't just list features; it tells a story of a global crisis (productivity stagnation) and a team uniquely qualified to solve it. The three-act structure makes the presentation easy to follow and remember.
Credibility Through Pedigree: For a company raising significant capital in a complex field like AI and computer vision, the team slide is vital. OpenSpace excels here by highlighting not just where people worked, but their specific academic contributions (PhDs) and successful exits (Sifteo, Bluefin Labs).
Macro-Micro Alignment: The deck successfully connects massive global trends (the $13 trillion infrastructure need) to a very specific hardware/software solution. It makes the 'Time Machine' concept feel like a necessity rather than a luxury.
What Is Missing
Financial Specifics: While Slide 9 mentions 'Revenue' as a key number, no actual revenue figures, growth percentages, or burn rates are provided in the visible slides. For a 'Later' stage deck, investors would typically expect to see a detailed breakdown of ARR (Annual Recurring Revenue), CAC (Customer Acquisition Cost), and LTV (Lifetime Value).
Competitive Landscape: There is no mention of competitors. The ConTech space has several players in the 360-capture and BIM (Building Information Modeling) integration space. Omitting this suggests either a very high level of confidence or that this deck was intended for an audience already familiar with the market dynamics.
The 'Ask': The provided slides do not include a 'The Ask' slide detailing how much capital is being raised or how it will be allocated. This is common in 'Update' decks, but essential for a fundraising teardown.
Unit Economics: There is no mention of the business model. Is it per-project, per-square-foot, or a seat-based SaaS model? The deck focuses on the 'what' and 'who' but leaves out the 'how' of the money-making engine.
What a Founder Should Copy
The 'Three Key Numbers' Approach: Slide 9 is a masterclass in focus. By telling investors exactly which three metrics the company cares about, the founders control the conversation. It prevents the audience from getting bogged down in vanity metrics and focuses them on the core drivers of the business.
Use of Third-Party Data: Using McKinsey charts (Slides 5 and 6) adds an immediate layer of authority to the problem statement. It proves that the founders aren't just imagining a problem; the world's leading consultants have quantified it.
Visual Metaphors: The 'Read-Only Time Machine' (Slide 3) is a brilliant piece of branding. It takes a complex technical product (360 video mapping with temporal synchronization) and turns it into a concept a five-year-old can understand. Founders should always look for these 'sticky' metaphors to describe their tech.
Conclusion
The OpenSpace deck is a polished, high-level overview that relies on a 'founder-market fit' narrative. It positions the company as the inevitable solution to a global productivity crisis in construction. While it lacks the granular financial data required for a final investment decision, it serves as an excellent 'hook' to demonstrate scale, technical superiority, and a clear vision for the future of the built environment.
Frequently asked questions
- What is the primary problem OpenSpace is trying to solve?
- OpenSpace addresses the 'acute need' for global infrastructure and the simultaneous stagnation of construction productivity. Slide 6 shows that while manufacturing productivity has nearly doubled since the mid-90s, construction has remained flat. The company argues that the industry lacks the tools and people to meet rising demand, necessitating automated documentation and mapping solutions.
- How does the OpenSpace technology actually work based on the deck?
- The deck illustrates a V1 prototype on Slide 10, which consists of a 360-degree camera mounted on a hard hat. According to the catalogue description, this hardware captures images every half-second and automatically ties them to project plans, creating what Slide 3 calls a 'read-only time machine' of the job site.
- What are the key metrics the company uses to measure success?
- Slide 9 explicitly lists 'three key numbers' that OpenSpace tracks: Headcount, Square Feet Captured, and Revenue. While the specific values for these metrics are not disclosed in the provided slides, the selection of 'Square Feet Captured' indicates that the volume of physical space digitized is their primary unit of scale.
- What is the background of the founding team?
- The team is highly technical and academically distinguished. As shown on Slide 12, the co-founders include Jeevan Kalanithi (CEO, MIT/Stanford), Mike Fleischman (Chief Scientist, MIT PhD), and Philip DeCamp (CTO, MIT PhD). The team includes former founders and executives from companies like Twitter, 3DR, and Bluefin Labs.
- What is the 'New Hotness' mentioned in the future vision?
- On Slide 14, the company defines its future direction in two steps: 'Making the data better' and 'Turning the data into insights.' This suggests a shift from mere documentation (capturing what happened) to predictive or analytical tools (explaining what the data means for project timelines or budgets).