OpenDoor’s 2014 Series A deck successfully raised $10M by reframing residential real estate as an illiquidity problem rather than a brokerage problem. The presentation is notable for its extreme transparency regarding risks—specifically AVM (Automated Valuation Model) errors and capital requirements. Instead of hiding the high costs of buying and selling homes, the founders leaned into a 15% 'initial discount' model to ensure a 4.7% margin. The deck uses asset analogues like CarMax and Gazelle to normalize the idea of selling at a discount for speed. It is a highly analytical pitch that prior…
Key takeaways
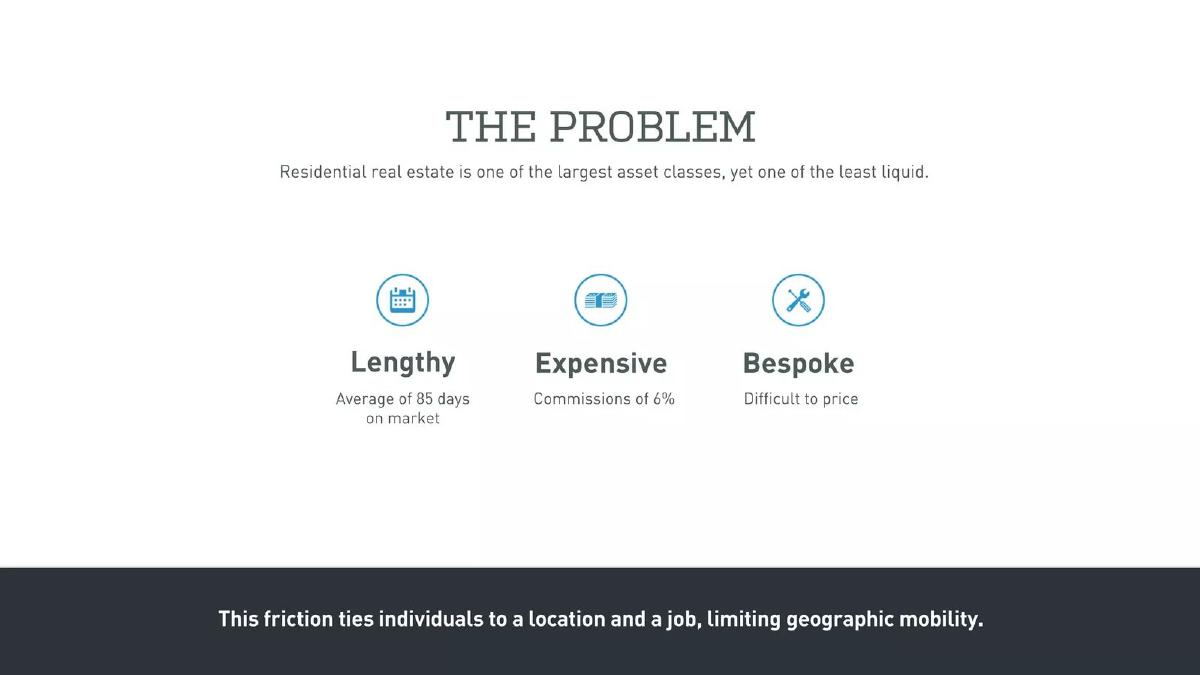
- The problem is framed as a lack of liquidity in a massive asset class, noting an average of 85 days on market (Slide 3).
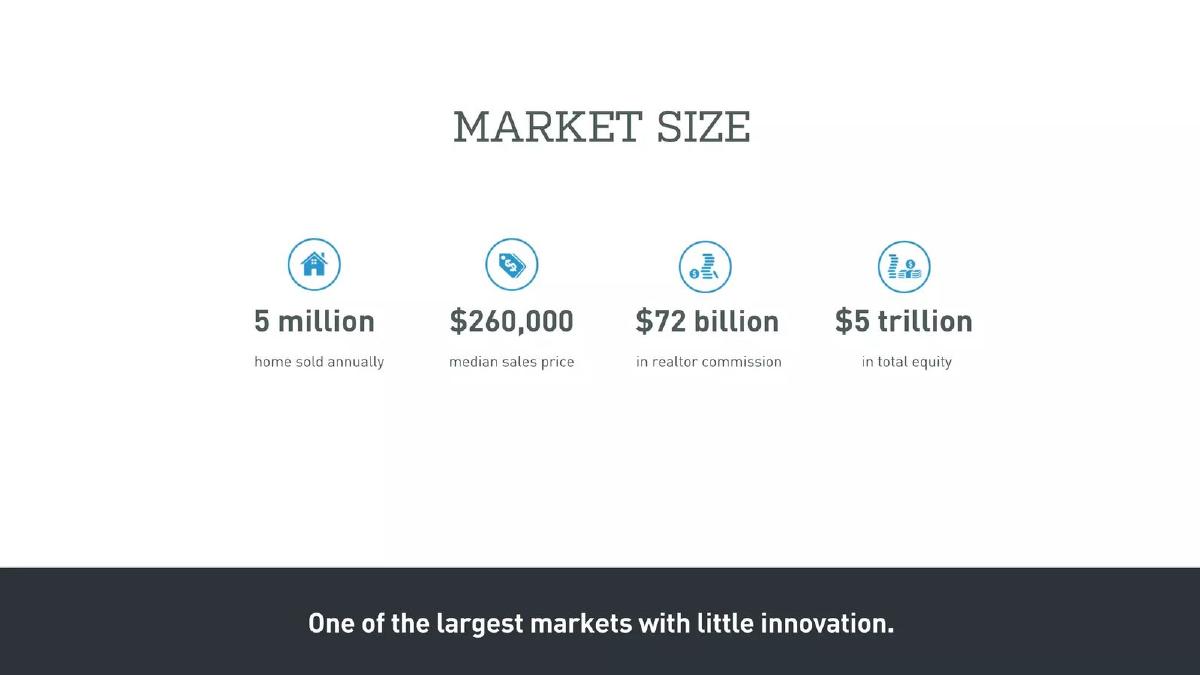
- The market size is defined by 5 million annual home sales and $72 billion in realtor commissions (Slide 5).
- OpenDoor uses 'Asset Analogues' like CarMax (7.9% discount) and Gazelle (20% discount) to justify their own 15% liquidity discount (Slide 8).
- The deck provides a granular breakdown of unit economics, showing how a 15% revenue top-line results in a 4.7% margin after costs like financing and commissions (Slide 11).
- Three core risks are explicitly named: AVM Error, Outliers, and Capital (Slide 14).
- The company claims a target AVM median error of less than 4% compared to the 8-10% error of current models (Slide 15).
- The financing strategy is tiered, moving from 8-10% interest rates for validation to 5-6% for scale (Slide 17).
- The Series A ask is specifically $9 million to acquire 50-150 homes in a single geography (Slide 18).
Introduction: The Liquidity Play
OpenDoor’s 2014 Series A deck is a foundational document in the Proptech space. At a time when real estate technology was largely focused on search (Zillow, Trulia), OpenDoor proposed a radical shift: becoming the market maker. The deck is 20 slides long and uses a clean, data-heavy aesthetic to convince VCs that the company can manage the massive capital risks associated with buying residential real estate at scale.
Slide 1: Title Slide
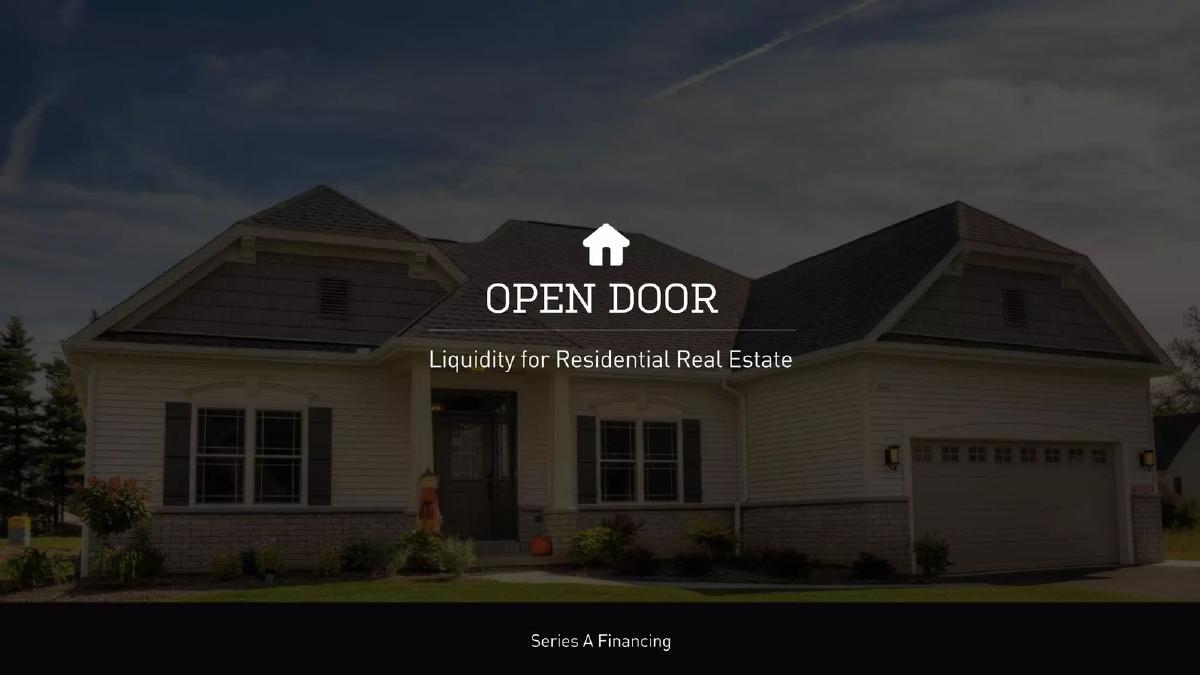
The deck opens with a simple image of a suburban home and the tagline "Liquidity for Residential Real Estate." This immediately frames the company not as a real estate agency, but as a financial services or liquidity provider. It explicitly states "Series A Financing" at the bottom.
Slide 2: The Team
The team slide is exceptionally strong for a Series A. It features Eric Wu (founder of Movity, sold to Trulia) and Keith Rabois (a member of the 'PayPal Mafia' and executive at Square and LinkedIn). The presence of Ian Wong (Square) and Ryan Johnson (Bain Capital) signals a mix of data science and private equity expertise, which is critical for a business that relies on accurate pricing and capital management.
Slide 3 & 4: The Problem and the "Today" Timeline
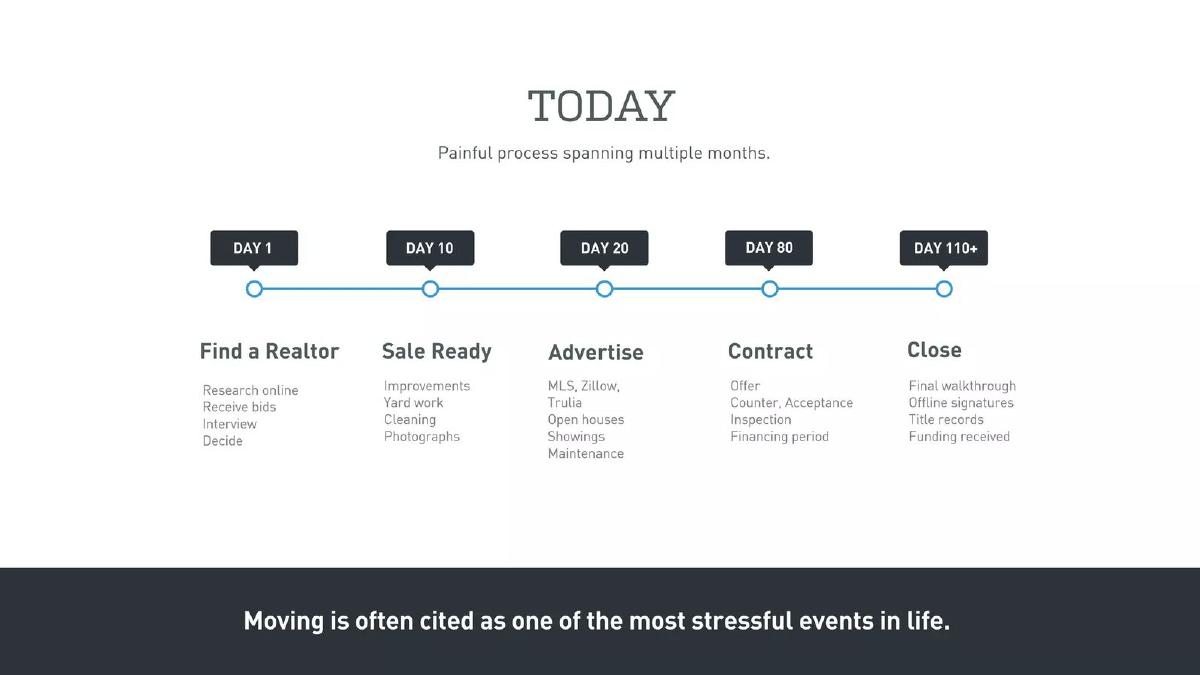
Slide 3 identifies three pain points: Lengthy (85 days on market), Expensive (6% commissions), and Bespoke (difficult to price). Slide 4 visualizes the "Today" process, showing a timeline that stretches to 110+ days. It highlights the emotional toll, stating that "Moving is often cited as one of the most stressful events in life." This sets the stage for a solution that prioritizes speed and certainty.
Slide 5: Market Size
The market size slide provides four key figures: 5 million homes sold annually, a $260,000 median sales price, $72 billion in realtor commissions, and $5 trillion in total equity. By highlighting the $72 billion in commissions, OpenDoor points to a massive pool of existing transaction costs that they can potentially capture or disrupt.
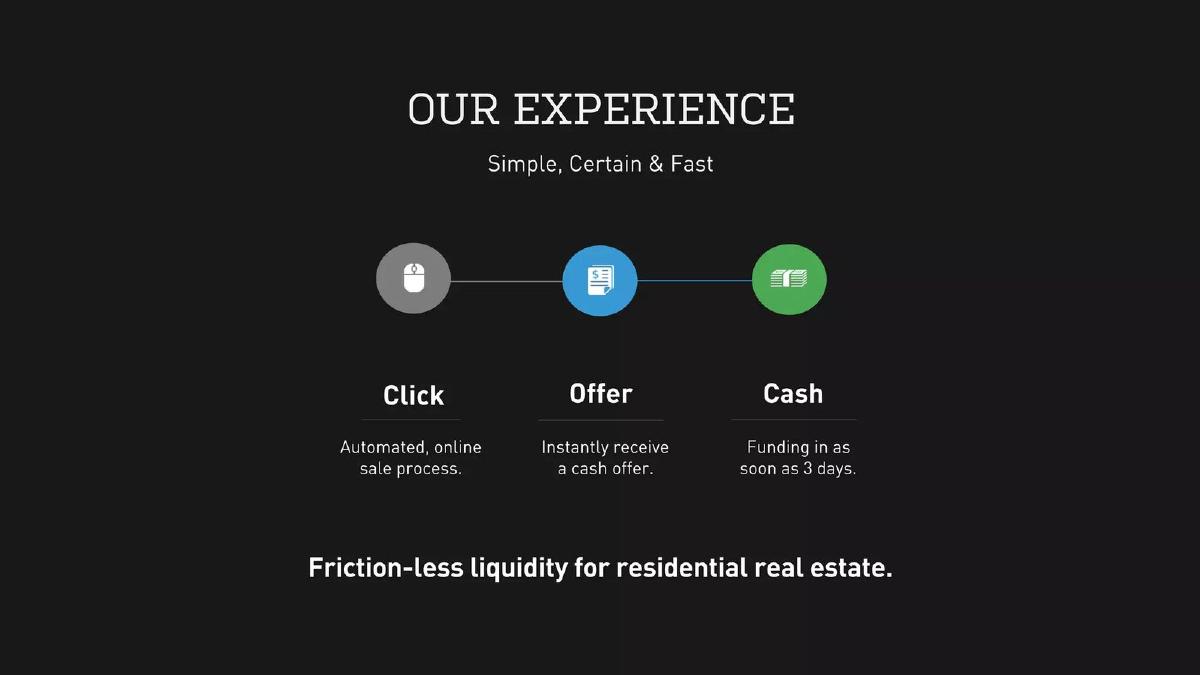
Slide 6: The Solution - "Our Experience"
The solution is distilled into three words: "Click, Offer, Cash." It promises an automated online process and funding in as soon as 3 days. This is a direct counter to the 110-day timeline shown on Slide 4. The phrase "Friction-less liquidity" is the core value proposition.
Slide 7, 8 & 9: Validating Seller Demand
Slide 7 asks the rhetorical question, "Do sellers want this?" Slide 8 provides the answer through "Asset Analogues." It shows that consumers already accept discounts for liquidity in other markets: Cars (CarMax, 7.9%+), Equipment (Richie Brothers, 15%+), and Electronics (Gazelle, 20%+). Slide 9 then drops the anchor for OpenDoor: "Our initial discount is 15%." This is a bold move—telling investors early on that they will charge a high fee to ensure the model works.
Slide 10: The True Liquidity Discount
This is one of the most important slides in the deck. OpenDoor acknowledges that 15% sounds high, but they subtract the "Traditional Costs" of 9% (6% commission + 3% other) to show that the "True Liquidity Discount" is only 6%. They are essentially asking the seller: "Is it worth 6% of your home value to skip the 85-day wait and the uncertainty?"
Slide 11 & 12: Unit Economics and Upside
Slide 11 is a waterfall chart showing how the 15% revenue is eaten away by costs: Buy Closing (1.7%), Operating (2%), Financing (2.2%), Buyer Broker Commission (3%), In-House Sale Cost (1.0%), and Sale Closing (0.4%). This leaves a 4.7% margin. Slide 12 shows how they can increase this to 8.25% through better incentive alignment and title services, proving the business has a path to significant profitability.
Slide 13 & 14: Risk Management
OpenDoor takes a proactive approach to risks. Slide 14 identifies three: AVM Error (valuation mistakes), Outliers (overvalued homes), and Capital (high requirements). By naming these, they demonstrate a level of maturity and realism that is often missing in startup pitches.
Slide 15 & 16: Solving for AVM and Outliers
Slide 15 compares "Current AVMs" (8-10% error) to "Our AVM" ( Because the business requires massive amounts of debt to buy homes, Slide 17 explains the capital stack. They start with "Validate" (8-10% interest from local banks/HNWIs), move to "Growth" (7-8% from PE/Hedge Funds), and end at "Scale" (5-6% from large banks). This shows a clear understanding of how their cost of capital must decrease as the model is de-risked.
Slide 18: The Ask
The deck asks for $9 million (though the catalogue facts indicate they raised $10M). The objectives are clear: build the AVM, acquire 500 potential sellers for data, and actually buy/sell 50-150 homes in a single city. This is a "prove it" round focused on a single geographic pilot.
Slide 19 & 20: The Plan and Impact
Slide 19 provides a roadmap from 2014 to 2018, including the launch of a capital marketplace. Slide 20 concludes with the social impact: increasing geographic mobility and home ownership by reducing the friction of selling. It ends on a high note, framing a transactional business as a tool for economic growth.
What Works in This Deck
Extreme Honesty: OpenDoor doesn't hide the fact that they are charging a 15% discount or that their business is risky. This builds trust with sophisticated investors. · Waterfall Economics: The unit economics slide (Slide 11) is a model for any capital-intensive business. It accounts for every penny, from financing costs to the buyer's broker commission. · The "Asset Analogue" Strategy: Comparing home buying to CarMax and Gazelle makes a radical idea feel familiar and proven.
What is Missing
Competitive Landscape: There is no mention of traditional real estate incumbents or potential tech competitors. The deck assumes that if they solve the liquidity problem, they will own the market. · Geographic Specificity: While they mention launching in "one geo," they don't specify which city or why that city is the ideal testing ground. · Marketing Strategy: The deck explains how the business works once a seller arrives, but it doesn't detail how they will find those 500 sellers (Slide 18) without spending a fortune on customer acquisition.
What a Founder Should Copy
The "Today" vs. "Future" Timeline: Use a simple visual (Slide 4 vs. Slide 6) to show exactly how much time and stress your solution removes from the customer's life. · Risk/Mitigation Pairing: If your business has obvious risks (like capital requirements or data accuracy), don't wait for the Q&A. Address them head-on with a slide that shows your plan to mitigate them (Slides 14-16). · Tiered Financial Goals: Show how your costs (like cost of capital) will change as you scale. Investors love to see that you understand the transition from "expensive validation" to "efficient scale" (Slide 17).
Frequently asked questions
- How does OpenDoor justify the 15% discount they take from sellers?
- On slide 10, OpenDoor compares their 15% cost to the 'Traditional Costs' of 9% (6% realtor commission, 2% operating, 1% closing). They argue the 'True Liquidity Discount' the seller pays is only 6% for the benefit of an instant close, which they position as a fair trade for certainty and speed.
- What are the specific milestones OpenDoor set for their Series A?
- According to slide 18, the three key objectives were to build an AVM with <8% instant error, acquire a sampling of 500 sellers to validate the discount curve, and acquire/sell 50-150 homes in one geography to confirm the cost structure.
- How did the team address the risk of overpaying for homes?
- Slide 16 outlines a 'Diligence Process' where an AVM offer is followed by an on-site inspection and custom BPO (Broker Price Opinion). This allows them to 'Mitigate the downside' by rejecting homes with structural issues or poor conditions not disclosed by the seller.
- What was the projected long-term margin for the business?
- Slide 12 shows 'Additional Short-Term Upside' that could move the margin from 4.7% to 8.25%. This was expected to come from improvement multiples (1.25%), incentive alignment (2%), and title services (0.3%).
- Who were the key team members listed in the 2014 deck?
- The team featured high-profile operators including Eric Wu (CEO, Movity.com), Keith Rabois (Khosla Ventures, Square), Ian Wong (Square), Ryan Johnson (Bain Capital), and JD Ross (Addepar), as shown on slide 2.