Pitch Deck Problem Slides: Real Examples and What Works
How to write a pitch deck problem slide investors believe: who has the pain, what it costs, and why today's fixes fail.
Pitch Deck Problem Slides: Real Examples and What Works
Examine nine real company problem-slide examples, compare how each frames customer pain, and turn the strongest patterns into a more specific slide of your own.
TL;DR
A problem slide needs to show who has the problem, what happens today, why the current alternative falls short, and the consequence—with evidence strong enough for the claim. These nine examples show how real decks used unmet needs, broken workflows, quantified friction, buyer testimony, and process bottlenecks; company claims are identified as claims rather than independently verified facts.
Problem slides analyzed from verified source text
Each example below is described from the extracted text of the company's own problem slide and links to our full teardown of that deck. Figures are the companies' own claims as they appeared on the slide; we have not verified them.
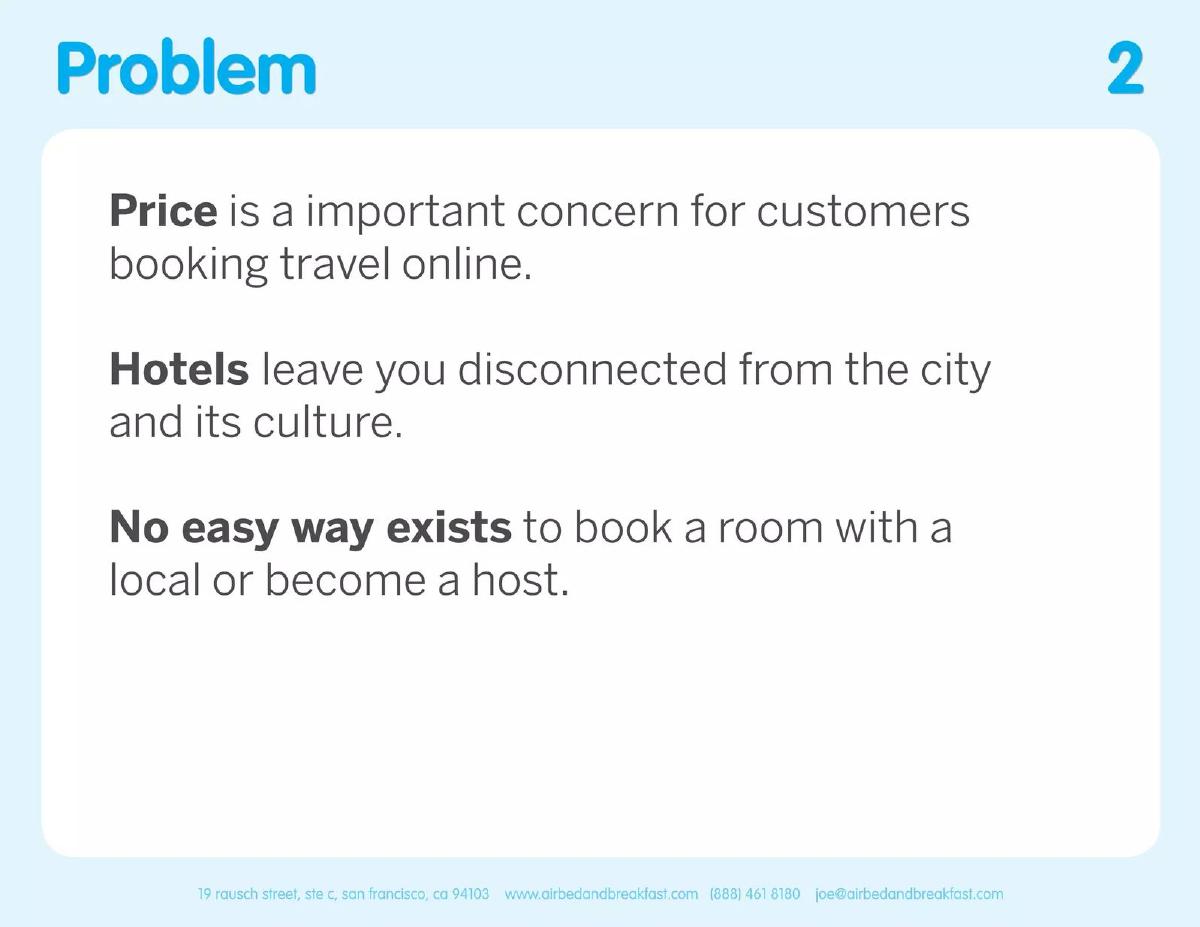
Airbnb problem slide — slide 2
Seed deck, 2008, for the travel marketplace then called AirBed & Breakfast. Slide 2.
Airbnb deck, slide 2. Matched to the stored slide image and extracted text.
Our analysis: Our reading: the three lines form a chain—economic pain, experiential pain, then an unavailable alternative. That prepares both sides of a marketplace without explaining the product yet.
Evidence and limitation: Evidence on the slide: three qualitative claims. Unsupported here: frequency, willingness to switch, typical savings and how many travellers value local connection.
What a founder can adapt: Write your problem as three short sentences about one customer: what it costs them, what they miss, and what option does not exist yet.
Supporting analysis
What the deck claims: Three sentences: price is an important concern for customers booking travel online; hotels leave you disconnected from the city and its culture; no easy way exists to book a room with a local or become a host.
Customer: Deck fact: people booking travel online, plus people who might host. The slide does not narrow them by trip type, geography or spending level.
Current workaround and consequence: Deck fact: travellers use hotels; the stated consequences are price concern and disconnection from local culture. The slide says no easy local-room booking or hosting option exists.
Presentation choice: The presentation is spare and parallel: each sentence can be read independently, but all three describe the same travel decision rather than three markets.
When it does not fit: Unsuitable when the pain is unfamiliar or disputed; three assertions without research or a number may not earn belief.
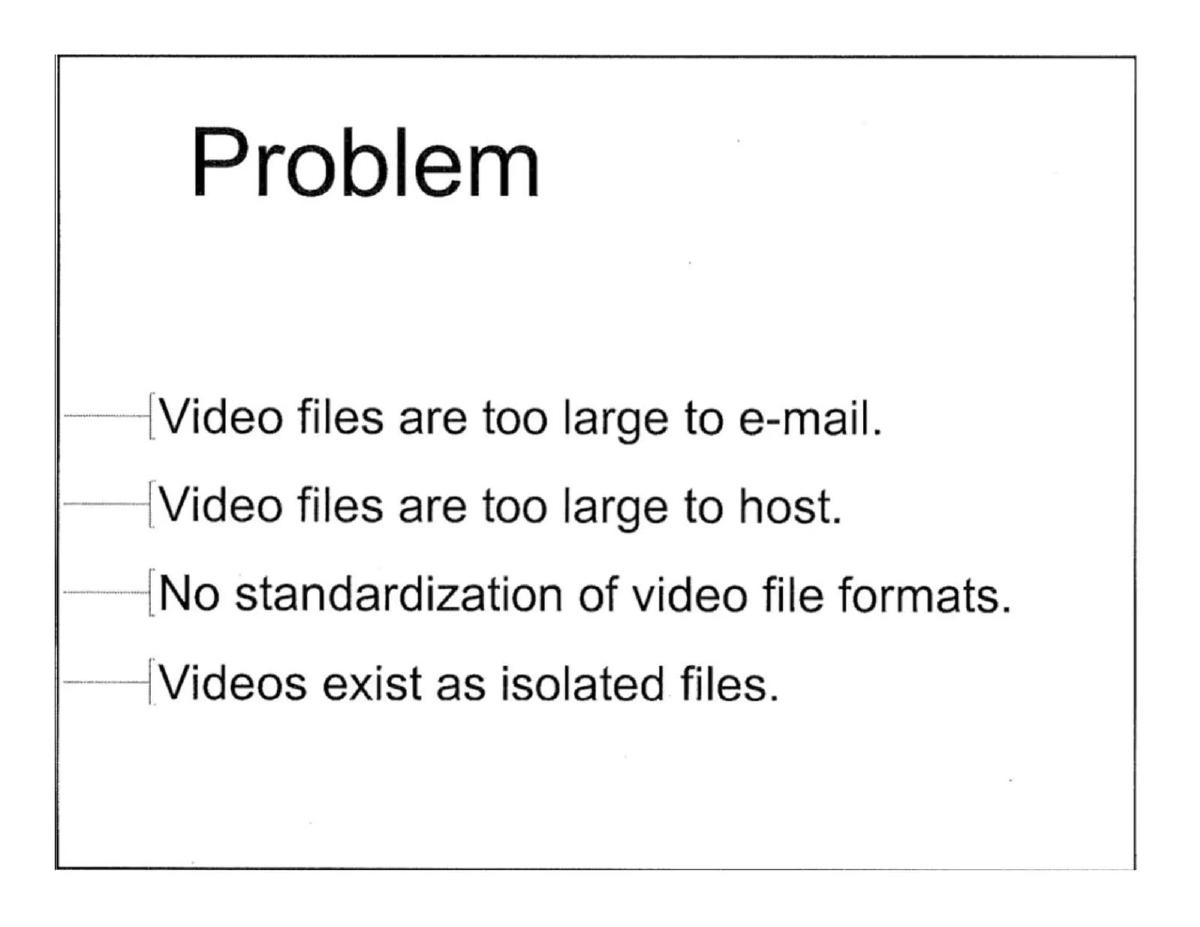
Series A deck, 2005, for a consumer video-sharing site. Slide 3.
YouTube deck, slide 3. Matched to the stored slide image and extracted text.
Our analysis: Our reading: this is a task-breakdown slide. It follows the user's attempted sequence—send, host, play, discover—instead of describing the video market in abstract terms.
Evidence and limitation: Evidence on the slide: a list of product constraints stated as user problems. Unsupported here: how often each failure occurred or which one mattered most.
What a founder can adapt: List the specific moments your user gets stuck, in their words, and let the final one point toward what makes your product different.
Supporting analysis
What the deck claims: Video files are too large to e-mail and too large to host; there is no standard video file format; videos exist as isolated files.
Customer: Deck fact: people trying to share digital video. The slide does not identify a narrower creator or viewer segment.
Current workaround and consequence: Deck fact: users try e-mailing or hosting files. File size and incompatible formats block those paths; isolated files also lack a shared viewing context.
Presentation choice: Its language stays at the level of actions and files. A reader can picture each failure without needing to understand codecs or infrastructure.
When it does not fit: Unsuitable when the audience has not experienced the workflow; then the list needs one observation or measure showing the pain is real.
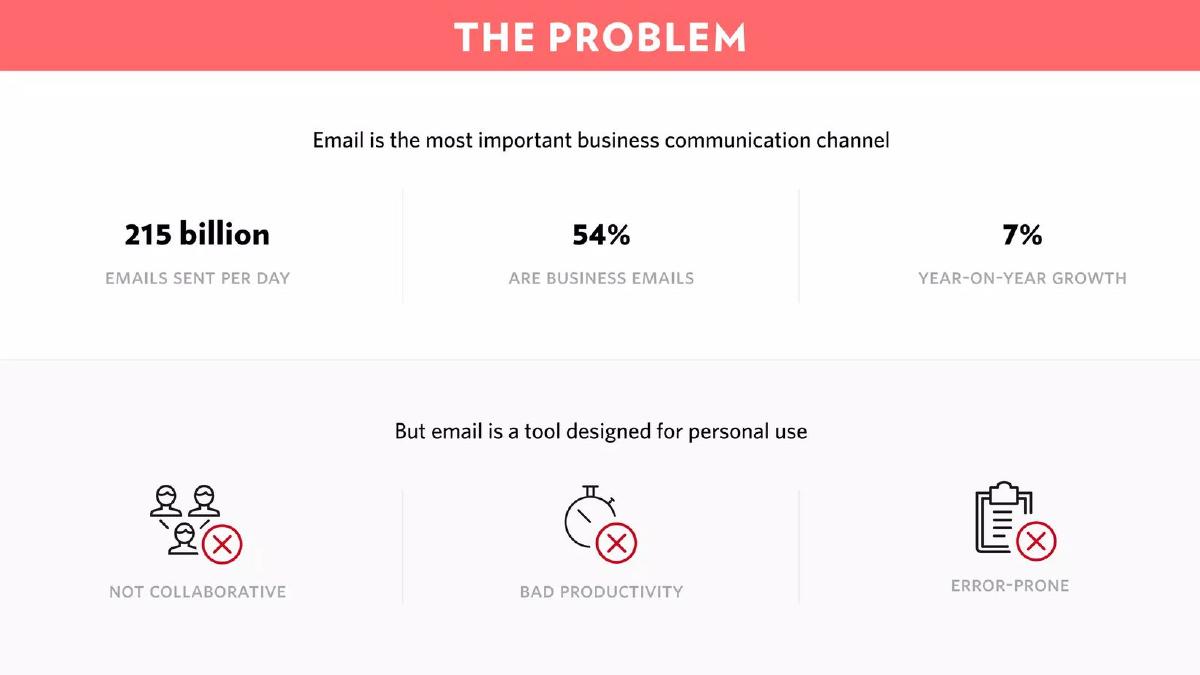
Series A deck, 2016, for a shared-inbox product sold to teams. Slide 2.
Front deck, slide 2. Matched to the stored slide image and extracted text.
Our analysis: Our reading: Front uses a category mismatch—an essential business channel built for individuals—to make a familiar tool look structurally wrong for the job.
Evidence and limitation: Evidence on the slide: daily e-mail volume, business-email share and year-on-year growth, all presented by the company. Unsupported here: the source of those figures and the cost of the collaboration failures.
What a founder can adapt: State the tool your customers already rely on, then the one way it was never designed for their situation.
Supporting analysis
What the deck claims: Email is the most important business communication channel, with figures on daily email volume and the share that is business email, but email is a tool designed for personal use: not collaborative, bad productivity, error-prone.
Customer: Deck fact: teams using e-mail for business communication. It does not name the job title that owns the problem.
Current workaround and consequence: Deck fact: teams keep using personal-use e-mail for collaborative work; the slide labels the consequences as poor collaboration, lost productivity and errors.
Presentation choice: Scale establishes that the behavior is entrenched; the three failure labels then define what the product must repair.
When it does not fit: Unsuitable if the incumbent tool is merely unpopular rather than structurally mismatched. Show the failed team task, not just a large usage number.
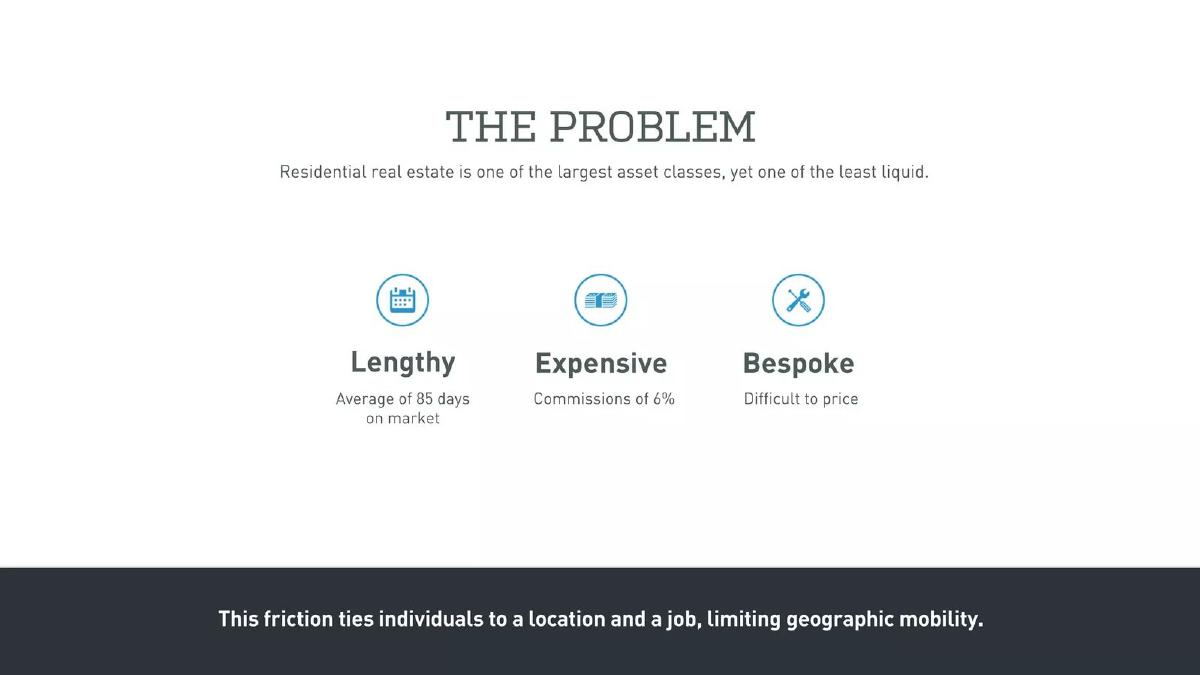
Series A deck, 2014, for a home-selling service. Slide 3.
Opendoor deck, slide 3. Matched to the stored slide image and extracted text.
Our analysis: Our reading: the slide translates illiquidity into three seller-visible frictions, then into a life constraint. That movement from category term to personal consequence is its strongest teaching point.
Evidence and limitation: Evidence on the slide: two quantified company claims and one qualitative pricing claim. Unsupported here: sources, distribution around the average and variation by market.
What a founder can adapt: Name three frictions and attach one number the customer would recognise to each.
Supporting analysis
What the deck claims: Residential real estate is one of the largest asset classes yet one of the least liquid: lengthy (an average of 85 days), expensive (commissions of 6%), bespoke (difficult to price). This friction ties people to a location and a job.
Customer: Deck fact: individuals selling residential property. The slide connects the transaction to their ability to move location or job.
Current workaround and consequence: Deck fact: sellers use the conventional residential-sale process; the claimed consequences are an 85-day average, 6% commissions and difficult pricing.
Presentation choice: The presentation gives each friction one label and, where available, one measure. The final sentence explains why the measures matter to a person.
When it does not fit: Unsuitable if the numbers are modeled or weakly sourced. A precise figure creates a precise diligence question.
Series C deck, 2014, for a product analytics company. Slides 2–3.
Mixpanel deck, slide 2. Matched to the stored slide image and extracted text.Mixpanel deck, slide 3. Matched to the stored slide image and extracted text.
Our analysis: Our reading: the second slide rescues the first from overbreadth by naming the shallow measurements used by the actual buyer. The pair teaches sequencing, but also shows the risk of a slogan without proof.
Evidence and limitation: Evidence on the slides: no supporting number or source; the argument is categorical. The slide does not show how widespread the behavior is or what a wrong decision costs.
What a founder can adapt: If you have two problems, give each its own slide and move from the general belief to the specific buyer.
Supporting analysis
What the deck claims: Problem 1: most of the world makes decisions by guessing or using their gut, and will be either lucky or wrong. Problem 2, on the next slide: companies measure shallow metrics like page views and installs.
Customer: Deck fact: companies making product decisions on mobile and web. The first slide says “most of the world,” but the next slide supplies the relevant company context.
Current workaround and consequence: Deck fact: teams guess, rely on intuition, or track page views and installs. The stated consequence is being lucky or wrong rather than reliably informed.
Presentation choice: One claim occupies each slide, creating emphasis. The transition from intuition to shallow metrics narrows an abstract belief into a product decision problem.
When it does not fit: Unsuitable in a sent deck when two slides delay the proof. Keep the pair only when the second materially sharpens the first.
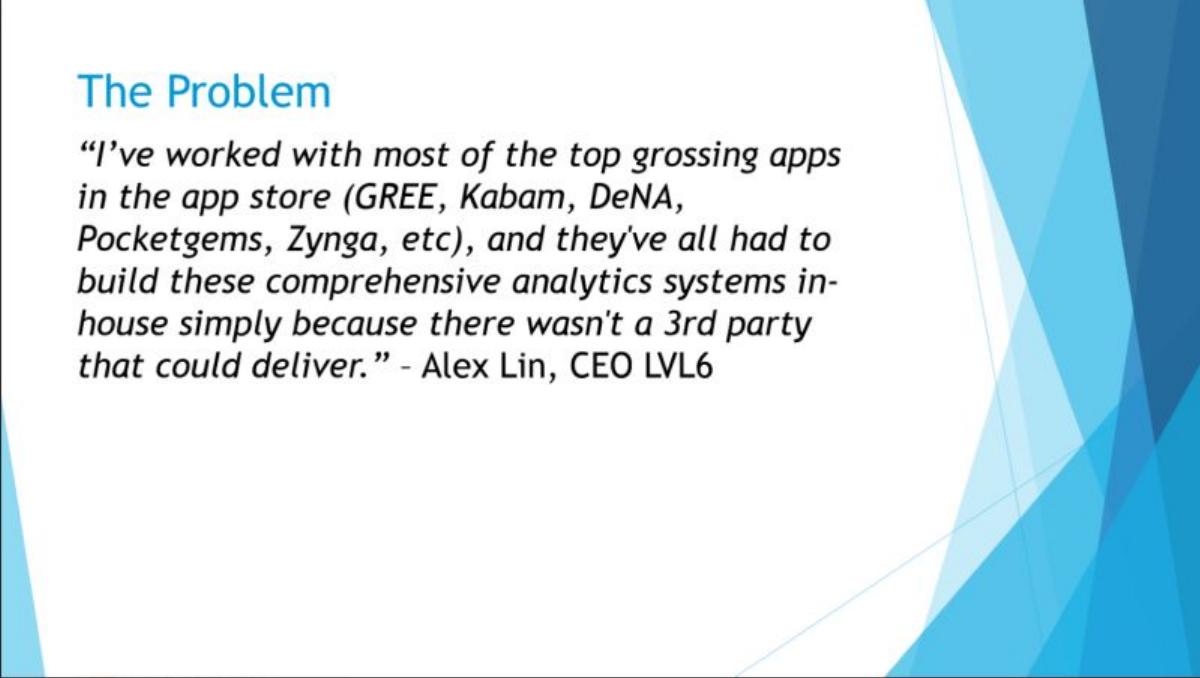
The collection records this as a 2021 Series F deck for a software company. Slide 2. The slide itself quotes an app-studio executive about an earlier operating problem; we do not describe this as an early-stage deck.
Amplitude deck, slide 2. Matched to the stored slide image and extracted text.
Our analysis: Our reading: the quote compresses buyer identity, workaround and market gap into one voice. Its credibility comes from attribution, while its limitation is that one testimony is not market validation.
Evidence and limitation: Evidence on the slide: one attributed customer quotation naming several app companies. Unsupported here: build cost, time, representativeness and whether the quoted experience applied at the deck date.
What a founder can adapt: Use one short quotation from a real buyer, with their role, that names the workaround they pay for today.
Supporting analysis
What the deck claims: A single quotation from the chief executive of a game studio: the top-grossing apps he had worked with all built analytics systems in-house because no third party could deliver.
Customer: Deck fact: teams building top-grossing mobile apps; the quoted speaker is identified as Alex Lin, CEO of LVL6.
Current workaround and consequence: Deck fact: those teams built comprehensive analytics systems in-house because, according to the quote, no third party could deliver. The consequence is implied effort, not quantified cost.
Presentation choice: The presentation lets a practitioner make the claim rather than placing it in the company's narrator voice.
When it does not fit: Unsuitable when permission, attribution or context is unclear, or when a lone quote is being asked to prove prevalence.
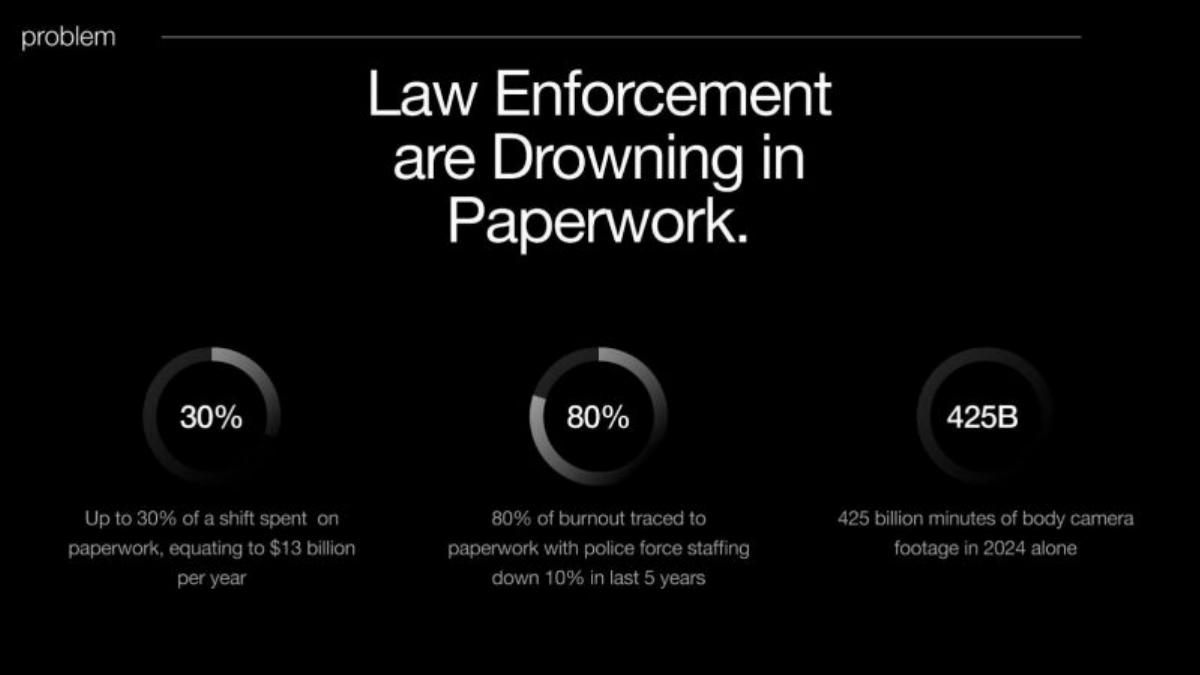
Seed deck, 2025, for software sold to law-enforcement organizations. Slide 3.
Code Four deck, slide 3. Matched to the stored slide image and extracted text.
Our analysis: Our reading: the strongest measure is time per shift because it matches the buyer's operating unit. The burnout and national-volume claims broaden the case but also increase the sourcing burden.
Evidence and limitation: Evidence on the slide: company-stated figures of up to 30% of a shift, 80% of burnout, and 425 billion minutes of body-camera footage. Unsupported here: visible citations and the comparability of these three measures.
What a founder can adapt: Measure the pain in the units your buyer uses to run their operation.
Supporting analysis
What the deck claims: Law enforcement is drowning in paperwork, with figures for the share of a shift spent on paperwork, burnout linked to it, and the volume of body camera footage.
Customer: Deck fact: law-enforcement organizations and officers. The slide does not distinguish the daily user from the procurement decision-maker.
Current workaround and consequence: Deck fact: officers complete paperwork around body-camera footage. The slide claims lost shift time, burnout and pressure amid reduced staffing.
Presentation choice: The headline identifies one institutional customer and one burden; the measures attempt to translate it into capacity, workforce and scale.
When it does not fit: Unsuitable as written if the figures cannot be cited. Keep the operational measure you can defend and move secondary statistics to notes.
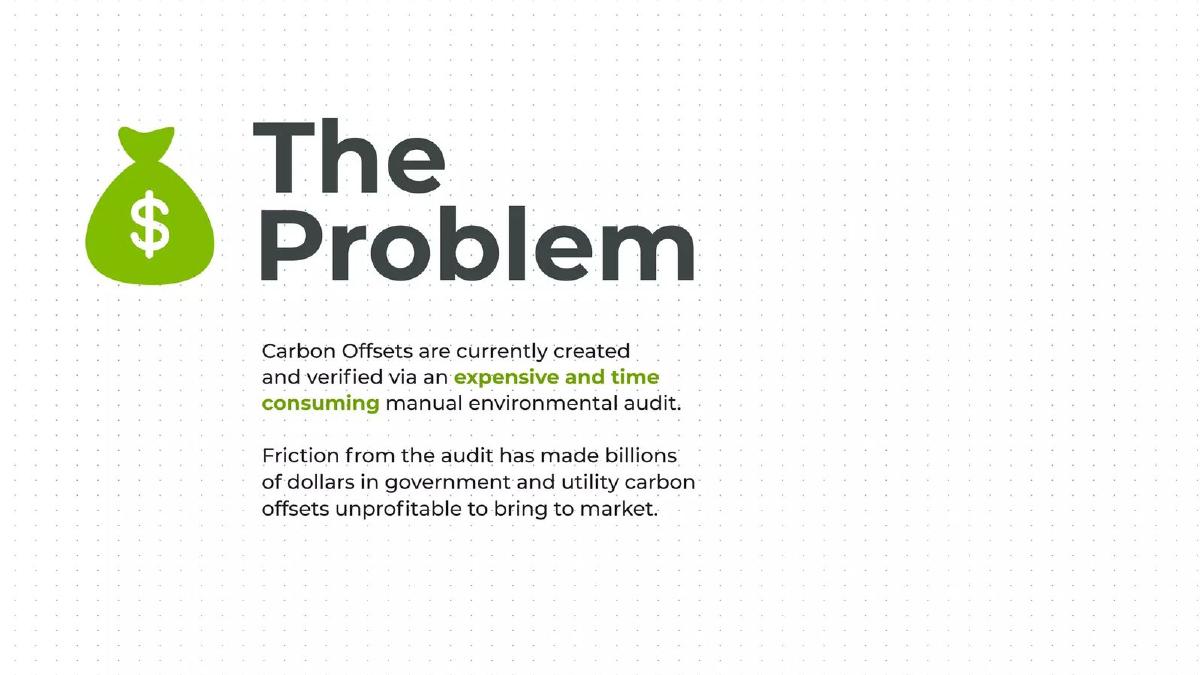
Seed investment deck, 2020, for a carbon-offset verification company. Slide 3. The collection records no fundraising outcome.
CarbonBlock deck, slide 3. Matched to the stored slide image and extracted text.
Our analysis: Our reading: the slide isolates a chokepoint rather than explaining the entire carbon market. That makes the next technical step easier to understand, but the broad monetary claim needs a source.
Evidence and limitation: Evidence on the slide: a process description and a “billions of dollars” claim. Unsupported here: the figure's source, affected jurisdictions and typical audit cost or duration.
What a founder can adapt: In a complicated market, point to the single step where value leaks out.
Supporting analysis
What the deck claims: Carbon offsets are created and verified through an expensive, slow, manual environmental audit, and that friction makes many offsets unprofitable to bring to market.
Customer: Deck fact: organizations creating and verifying government and utility carbon offsets. A specific job title is not named.
Current workaround and consequence: Deck fact: offsets are created and verified through manual environmental audits; the slide claims those audits are expensive and time-consuming and can make offsets unprofitable to bring to market.
Presentation choice: The presentation is a causal chain: manual audit creates friction; friction prevents viable supply from reaching market.
When it does not fit: Unsuitable when the bottleneck is only one of several equally important causes. Do not force a complex system into a single-cause story.
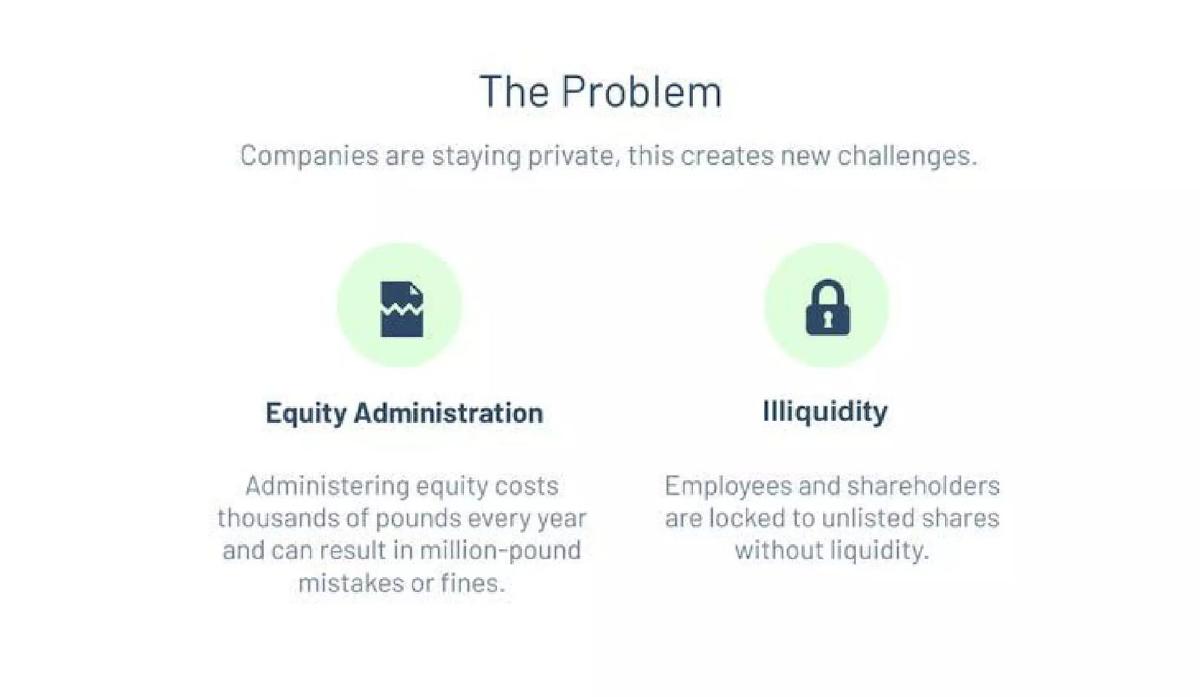
Series A extension deck, 2020, for an equity-management platform. Slide 3.
Capdesk deck, slide 3. Matched to the stored slide image and extracted text.
Our analysis: Our reading: a market shift—companies staying private longer—acts as the cause, while administration and illiquidity are the two downstream problems. It works only because the slide names both affected parties.
Evidence and limitation: Evidence on the slide: company-stated cost ranges and consequences. Unsupported here: source, frequency, affected company size and the share of holders seeking liquidity.
What a founder can adapt: If a shift creates your problem, state it in one line, then name who it hurts and how.
Supporting analysis
What the deck claims: Companies are staying private longer, which creates two problems: equity administration is costly and error-prone, and employees and shareholders are locked into unlisted shares without liquidity.
Customer: Deck fact: private companies administering equity, and employees or shareholders holding unlisted shares. These are two related audiences with different pain.
Current workaround and consequence: Deck fact: companies administer private-company equity while holders remain in unlisted shares; the claimed consequences are thousands of pounds in annual costs, possible million-pound mistakes or fines, and illiquidity.
Presentation choice: The presentation separates the company-side burden from the holder-side burden instead of blending them into “equity is broken.”
When it does not fit: Unsuitable when the two audiences require unrelated products. Show the connection between their problems or choose one wedge.
These are observations about the nine selected examples, not prevalence claims about the full deck corpus. A quantified financial problem, an inefficient workflow and an unmet consumer need need different proof: money or time for the first, a visible broken sequence for the second, and behavior or customer language for the third.
Example
Customer and problem
Framing
Evidence shown
Main limitation
Use when
Airbnb
Online travellers face price and cultural-disconnection concerns
Three linked unmet needs
Qualitative slide claims
No measure or source
The audience recognizes the consumer experience
YouTube
People cannot easily share digital video
Failed task sequence
Four concrete file/workflow constraints
No frequency or priority
A workflow breaks at several connected steps
Front
Teams use individual e-mail for collaborative work
Incumbent-tool mismatch
Category-scale figures plus failure labels
Buyer role and failure cost absent
A ubiquitous tool was built for a different job
Opendoor
Home sellers face a slow, costly, hard-to-price transaction
Measured financial and time friction
85-day and 6% company claims
Sources and market variation absent
The pain is defensibly measurable
Mixpanel
Product teams guess or use shallow metrics
Two-slide argument
Specific workaround examples
Broad claim without proof
A second claim genuinely narrows the first
Amplitude
App teams build analytics in-house
Attributed buyer testimony
Named executive and companies
One quotation is not prevalence
A permissioned buyer quote captures the workaround
Code Four
Law-enforcement organizations lose capacity to paperwork
Operational burden in buyer units
Shift-time, burnout and volume claims
Several uncited measures compete
The buyer manages the pain as time or capacity
CarbonBlock
Offset creators face a manual audit bottleneck
Single process chokepoint
Process claim plus monetary claim
No source or typical cost
One step causes most of the economic loss
Capdesk
Companies bear admin risk; holders lack liquidity
Trend to two downstream pains
Company-stated costs and consequences
Two audiences may split focus
One change creates tightly linked pains
Key Takeaways
Make the customer and present-day behavior concrete. YouTube walks through failed sharing tasks, while Front names the mismatch between collaborative work and a tool designed for individuals; describe what people actually try before introducing your product.
Use a measure the customer already recognizes, and source it. Opendoor frames pain in days and commission percentage, while Code Four uses time per shift; a precise number strengthens the slide only when you can defend where it came from.
Choose a framing that fits the evidence you have. Airbnb's linked unmet needs work because the travel experience is familiar, Amplitude uses an attributed buyer quotation, and CarbonBlock isolates one costly process chokepoint.
Keep one argument per slide. Mixpanel needs two slides to move from a broad claim about guessing to the buyer's shallow metrics; use that sequence only when the second slide materially sharpens the first.
Write your problem statement from evidence
Fill this out before designing the slide. If a box is unknown, write “unknown” and gather evidence rather than smoothing over the gap.
Who. Which specific person or role experiences the problem? Who pays if that is different?
Today. What do they do now, step by step? Name the real alternative, including manual work or doing nothing.
Shortfall. Where does that alternative fail for this customer?
Consequence. What changes because of the failure—time, money, risk, access, quality or an unmet need?
Evidence. What can you cite: observed workflow, customer quote, internal usage, invoice, study, or measured outcome?
Copyable framework: [Specific customer] currently [current behavior]. Because [shortfall], they experience [consequence]. We support this with [source, measure or attributed observation].
Illustrative example 1 — written by us
Before: Scheduling is broken for clinics.
After: Illustrative example we wrote: outpatient clinic coordinators reconcile referrals across phone calls and separate calendars; duplicate entry delays confirmation and creates avoidable rework. Evidence to add: observed coordinator time per referral and the source/date of that observation.
What improved: The revision names the user, current workflow, failure and measurable evidence still needed. It does not pretend the evidence already exists.
Illustrative example 2 — written by us
Before: Small businesses need better cash-flow tools.
After: Illustrative example we wrote: owners of project-based firms compare bank balances with unpaid invoices by hand before approving payroll; the delay leaves upcoming obligations unclear. Evidence to add: interviews or workflow observations, plus a measured time or error consequence.
What improved: The revision replaces a product category with a decision, a workaround and a consequence. It also keeps an unsupported number off the slide.
What investors are really checking on this slide
Investors do not read the problem slide to learn that a problem exists. They read it to judge whether the founder understands a customer well enough to build something that customer will pay for. A vague problem suggests the founder has not spent enough time with buyers. A precise one suggests the rest of the deck will be built on something real.
Sequoia's guide to writing a business plan asks founders to "describe the pain of your customer" and then to explain "how is this addressed today and what are the shortcomings to current solutions." Those two sentences contain the whole slide. The first is about a specific customer and a specific pain. The second is about the alternatives, which is where most problem slides go quiet.
The slide also sets up everything after it. The solution slide has to answer the problem as stated, the market slide has to count the people who have it, and the traction slide has to show some of them paying to make it go away. If the problem is fuzzy, every later slide inherits that fuzziness. That is why the problem slide deserves more rewriting than its word count suggests. (Sequoia Capital)
The three parts of a strong problem statement
The first part is the person. "Businesses" or "consumers" is not a person. "Urban working professionals who want to own real estate" is closer. "Field officers who spend part of every shift writing reports" is closer still. The narrower the description, the easier it is for an investor to picture the buyer and to believe the company can reach them.
The second part is the cost. Pain becomes believable when it is measured in something the customer already counts: hours, money, missed revenue, days on market, error rates, patients who do not respond to treatment. Opendoor's slide gave an average of 85 days and a 6% commission. Code Four's slide put a share of each police shift against paperwork. A single honest number the customer would recognise does more than a page of adjectives.
The third part is the gap. Why hasn't this been fixed? Either current options are too expensive, too slow, too manual, not built for this customer, or missing altogether. Airbnb's third line — no easy way exists to book a room with a local or become a host — is a gap statement. It tells the investor the space is open before the solution slide arrives.
One problem or several?
Most strong decks lead with one problem. When a deck lists several, they work best when they describe the same customer from different angles rather than separate markets. Airbnb's three lines are all about one traveller: price, isolation from the city, and no easy way to book with a local. Each line maps to a benefit on the next slide.
Mixpanel split its problem across two slides, one idea per slide: most people decide by guessing, and companies that do measure track the wrong numbers. That works because each slide carries one thought. Y Combinator's design advice makes the same point in general terms: "A simple slide, therefore, expresses one idea." If your three problems each need their own evidence, you probably have three slides or one problem you have not yet found.
A useful test is to cover the solution slide and read your problems aloud. If an investor could guess the product from them, the problems are connected. If they point to three different products, cut to the one your company actually solves first and move the others to later slides or the appendix. (Y Combinator)
Evidence: numbers, quotes and stories
There are three kinds of evidence that show up on problem slides, and each has a place. Numbers work when they measure the cost to the customer rather than the size of the market. "85 days to sell a home" is about the customer. "A $5 trillion asset class" is a market figure and belongs on the market slide.
Quotes work when they come from the buyer and describe the pain in their words. Amplitude's problem slide is a single quotation from the chief executive of a game studio, saying the top-grossing apps he had worked with all had to build analytics systems in-house because no outside vendor could deliver. That quote does three things at once: it names a credible buyer, states the gap, and suggests customers are already spending money on the problem.
Stories work best in a live pitch and less well in a sent deck. A short scenario about one named user can make a slide memorable, but it needs a single line of fact next to it so the reader does not have to take the story on trust. If you use a persona, give them one concrete task and one concrete cost.
Whichever you use, cite your numbers. A footnote with a source and a year lets an investor check the figure and signals care. Unsourced statistics that look too round invite the question you least want in the meeting: where does that come from?
Problem slide versus why-now and market slides
Founders often blur three slides that do different jobs. The problem slide says what hurts and for whom. The why-now slide explains what changed recently that makes a solution possible or urgent now; Sequoia frames it as "why hasn't your solution been built before now?" The market slide counts how many people or businesses have the problem and what they spend.
Keeping these separate makes each one stronger. A problem slide padded with market size figures loses its human edge. A problem slide that tries to explain timing starts arguing before the investor has agreed there is a pain at all. Some decks, like YouTube's, put a timing argument on the market slide — cheap digital video recording and broadband reaching critical mass — and keep the problem slide purely about the user's frustration.
If you only have room for one of these, keep the problem. An investor can accept a rough market estimate or an implied why-now, but they cannot fund a solution to a pain they do not believe. (Sequoia Capital)
How the slide changes by stage and customer type
At pre-seed and seed, the problem slide carries more weight because there is little traction to lean on. It should show that the founder has spoken with many buyers and can describe their day. Direct quotes, a short account of how the customer copes today, and one cost figure are usually enough.
At Series A and later, investors expect the problem to be confirmed by customers who pay. The slide can be shorter and may share space with early proof, as Front did by pairing a business email problem with the scale of business email. Later decks often frame the problem at a larger scale because the company is now selling into a bigger slice of the market.
Business-to-business decks should name the role that feels the pain and, where it differs, the role that pays. Consumer decks should describe a moment the listener has lived through. Regulated fields such as health care need extra care: describe the clinical or operational problem accurately, cite recognised sources, and avoid implying outcomes your product has not demonstrated.
Common mistakes
Describing a market, not a person. "The logistics industry is fragmented" is an observation. Name who feels the fragmentation and what it costs them.
Putting market size on the problem slide. Large totals belong on the market slide. On the problem slide, measure the cost to one customer.
Describing your product as a problem. "There is no AI-powered platform for X" describes a missing product. State the pain the product would remove.
Listing unrelated problems. Several problems that point to different products suggest a lack of focus. Keep the ones your first product solves.
Unsourced statistics. Round numbers without a source invite doubt. Add a short footnote with the source and year.
Ignoring how customers cope today. If you skip current alternatives, the investor will assume they are good enough. Say what people use now and why it falls short.
Too many words. A problem slide that needs a paragraph is still being worked out. Cut until each line is a single idea.
Diagnostic checklist
The slide names a specific customer, not an industry.
The pain is measured in a unit the customer already tracks.
It says how customers handle the problem today and why that falls short.
Every problem listed is one your first product solves.
Figures on the slide have a source and year.
Market size and timing arguments sit on their own slides.
The solution slide answers each problem line as written.
An investor could repeat the problem in one sentence after reading it.
Frequently asked questions
What should a pitch deck problem slide include?
Who has the problem, what it costs them, and why current options fall short. Sequoia asks founders to describe the pain of the customer and the shortcomings of current solutions. (Sequoia Capital)
How many problems should I list?
Usually one, or up to three that describe the same customer from different angles. If each problem needs its own evidence, give each its own slide or focus on the one your first product solves.
Should the problem slide include statistics?
Include one or two numbers that measure the cost to the customer, with a source. Save market totals for the market slide.
What is the difference between the problem slide and the why-now slide?
The problem slide says what hurts and for whom. The why-now slide explains what changed recently that makes a solution possible or urgent now. (Sequoia Capital)
Where does the problem slide go in a pitch deck?
Usually right after the cover or a one-line company purpose, and just before the solution. In our examples it most often appears as the second or third slide.
Can I combine the problem and solution on one slide?
You can when both fit in a line or two each. If either needs evidence or an image, split them so each slide carries one idea. (Y Combinator)
How we chose these examples
Corpus: published pitch deck teardowns on StartupFundraising.com. Founder-uploaded private decks are excluded entirely.
Selection: our slide-type classifier is not reliable enough to pick examples, so we searched extracted slide text for slides beginning with "problem" within the first six slides of published teardowns. We read the readable matches and chose nine that show materially different framing approaches across consumer, business software, real estate, public safety, climate and finance.
Review: examples were selected and described by our editorial model from the extracted slide text and checked against that text. No person has yet reviewed these examples for this page.
Figures quoted are the companies' own statements on their slides, often from older decks; we have not verified them.
Image audit: ten exact stored images were matched to the nine cited company examples, including both Mixpanel slides. The images are available in the archive; the original source files are not. Reuse permission for this guide remains undocumented; no image is marked licensed and no legal determination about use is asserted.
Alternative audit: the public corpus contains no problem-slide image with an explicit reuse grant applicable to this guide, so no company was substituted merely to create an illustrated example.
Authorship and review: this guide was assembled by StartupFundraising.com using its published teardown corpus and an editorial model. No person has yet reviewed or approved it for publication.
We make no claim that any problem slide caused a fundraising outcome.