How B2B software startups frame the problem in a pitch deck: who owns the broken workflow, what the manual workaround costs.
B2B SaaS Problem Slide: Real Pitch Deck Examples
Eight problem slides from business software startups, shown in full, compare how each names the team with the problem, what today's workaround costs, and why the tools a company already has don't solve it.
TL;DR
A business software problem slide should name the team that owns the broken work, show what the current workaround costs in hours, money or risk, and explain why the tools the company already pays for haven't fixed it. IriusRisk does all three: security design is done by hand, "Threat modeling 1 application can take 3 days at a cost of $3000", and manual documents are "not compatible with agile and devops workflows". Rippling names the root cause (the same employee data kept "across disconnected systems"), and Airbase explains why earlier tools left the problem open. A slide of macro statistics about the economy, like Thrive Global's, describes a trend but not a buyer.
B2B SaaS problem slides from real pitch decks
Each example shows the exact stored slide above its analysis and links to the full teardown. Figures are as shown on the slides; we have not verified them.
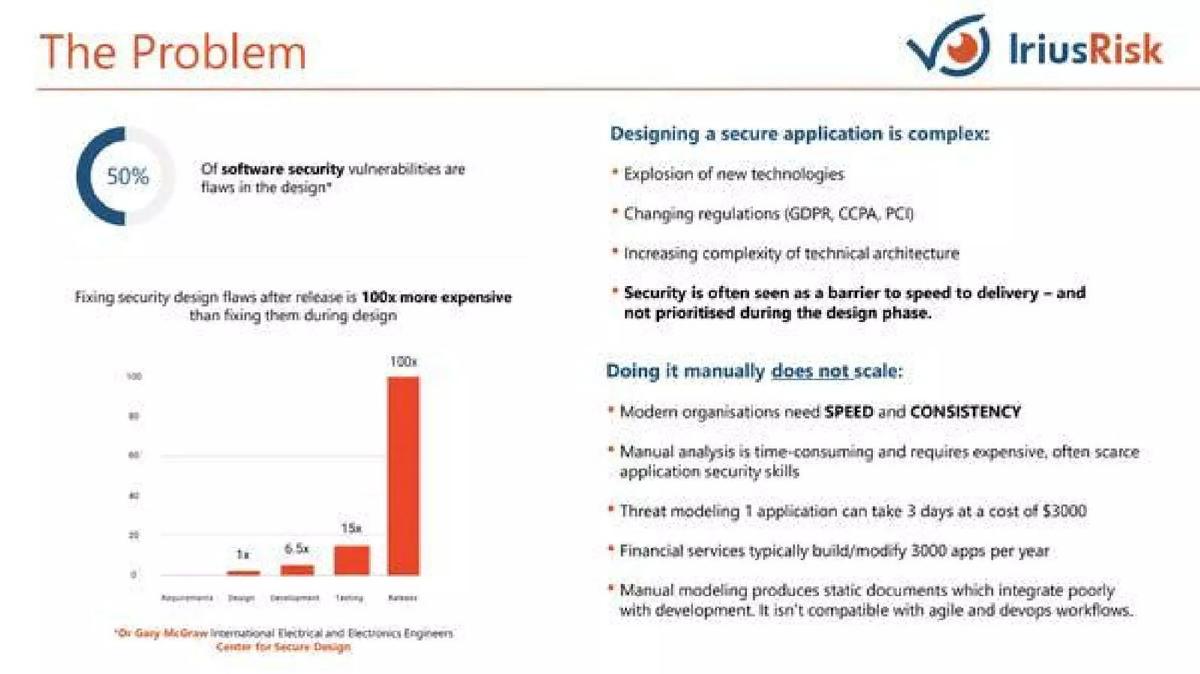
IriusRisk problem slide — slide 3
Application security design software. Cost chart plus the manual process.
IriusRisk deck, slide 3. Exact stored slide matched to this analysis.
Our analysis: It prices one unit of today's manual work, then shows how many units a typical buyer has.
Evidence and limitation: The 100x chart cites a named source (Dr Gary McGraw); the 3-day and $3,000 figures are unsourced.
What a founder can adapt: Give the cost of one task done the current way and how often a customer does it.
Supporting analysis
What the deck claims: "50% of software security vulnerabilities are flaws in the design." "Fixing security design flaws after release is 100x more expensive than fixing them during design." "Doing it manually does not scale": "Threat modeling 1 application can take 3 days at a cost of $3000"; "Financial services typically build/modify 3000 apps per year".
Presentation choice: 3 days × 3,000 apps a year lets an investor estimate the buyer's cost without being told.
When it does not fit: Source the per-application cost; it carries the whole argument.
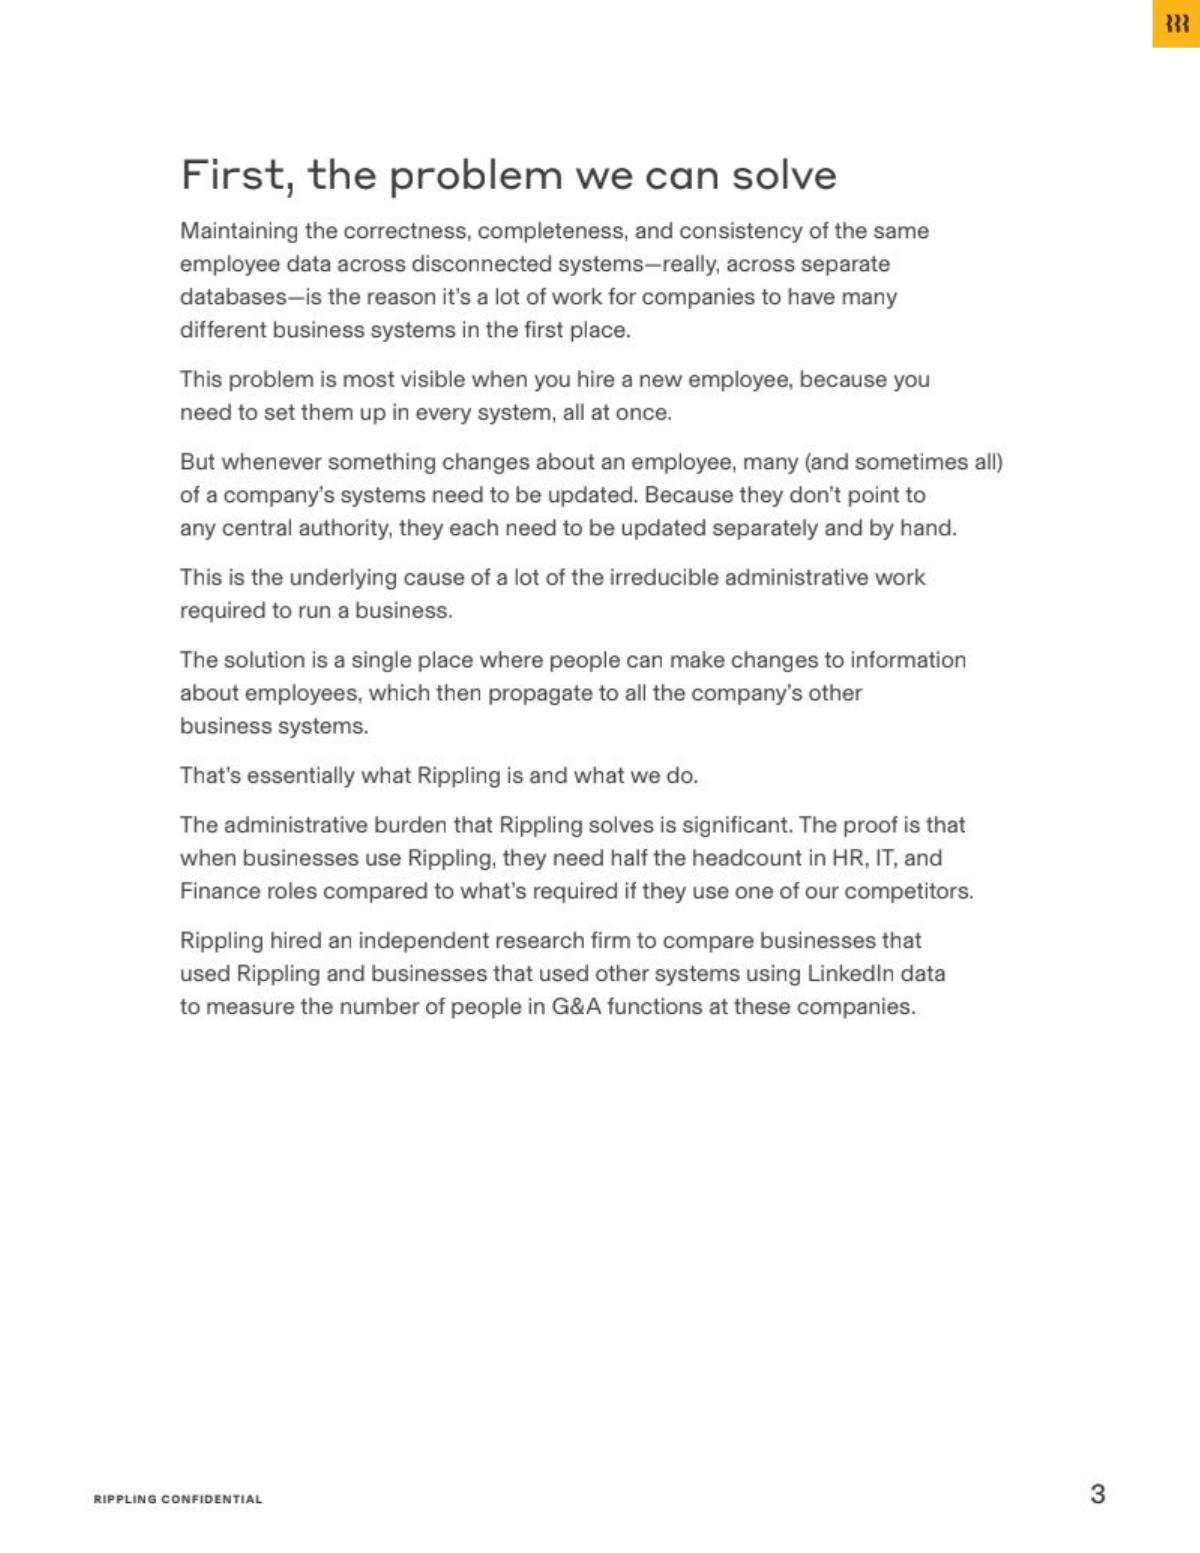
HR, IT and finance platform. A written memo page naming the root cause.
Rippling deck, slide 3. Exact stored slide matched to this analysis.
Our analysis: It names one underlying cause, then a moment every buyer recognises (a new hire), then a measured cost.
Evidence and limitation: A headcount comparison attributed to an unnamed independent research firm.
What a founder can adapt: Name the root cause, one familiar moment it shows up, and one measured cost.
Supporting analysis
What the deck claims: "Maintaining the correctness, completeness, and consistency of the same employee data across disconnected systems... is the reason it's a lot of work for companies." "This problem is most visible when you hire a new employee." Companies using Rippling "need half the headcount in HR, IT, and Finance roles", per "an independent research firm" using LinkedIn data.
Presentation choice: The headcount figure turns a vague admin burden into salaries a buyer can count.
When it does not fit: It is a text page; in a presented deck, pull the headcount figure out as a large number.
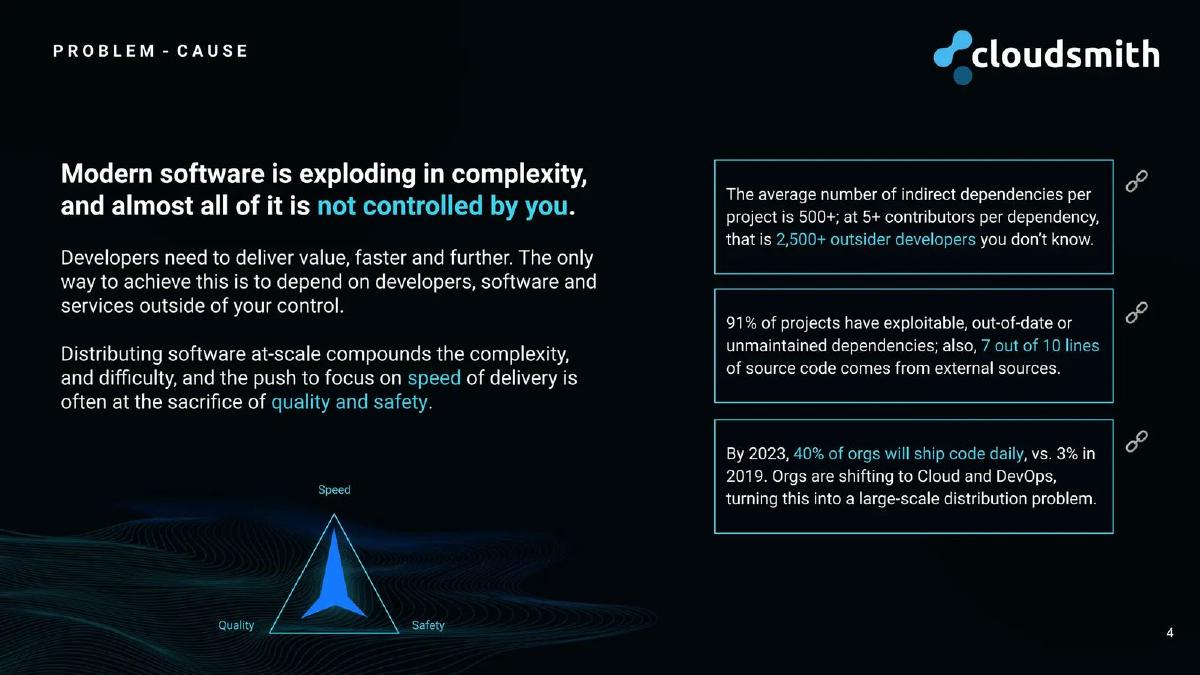
Software package management. Three sourced statistics about developer risk.
Cloudsmith deck, slide 4. Exact stored slide matched to this analysis.
Our analysis: The statistics describe risk inside the buyer's own code, not the economy.
Evidence and limitation: Each statistic has a link icon, indicating a source; the sources aren't named on the slide.
What a founder can adapt: Choose statistics about your buyer's own work, and show the trend making it worse.
Supporting analysis
What the deck claims: "Modern software is exploding in complexity, and almost all of it is not controlled by you." "The average number of indirect dependencies per project is 500+"; "91% of projects have exploitable, out-of-date or unmaintained dependencies; also, 7 out of 10 lines of source code comes from external sources"; "By 2023, 40% of orgs will ship code daily, vs. 3% in 2019."
Presentation choice: Every figure is about the engineering team that would buy the product.
When it does not fit: Add what a dependency failure costs a company; the slide shows risk but no price.
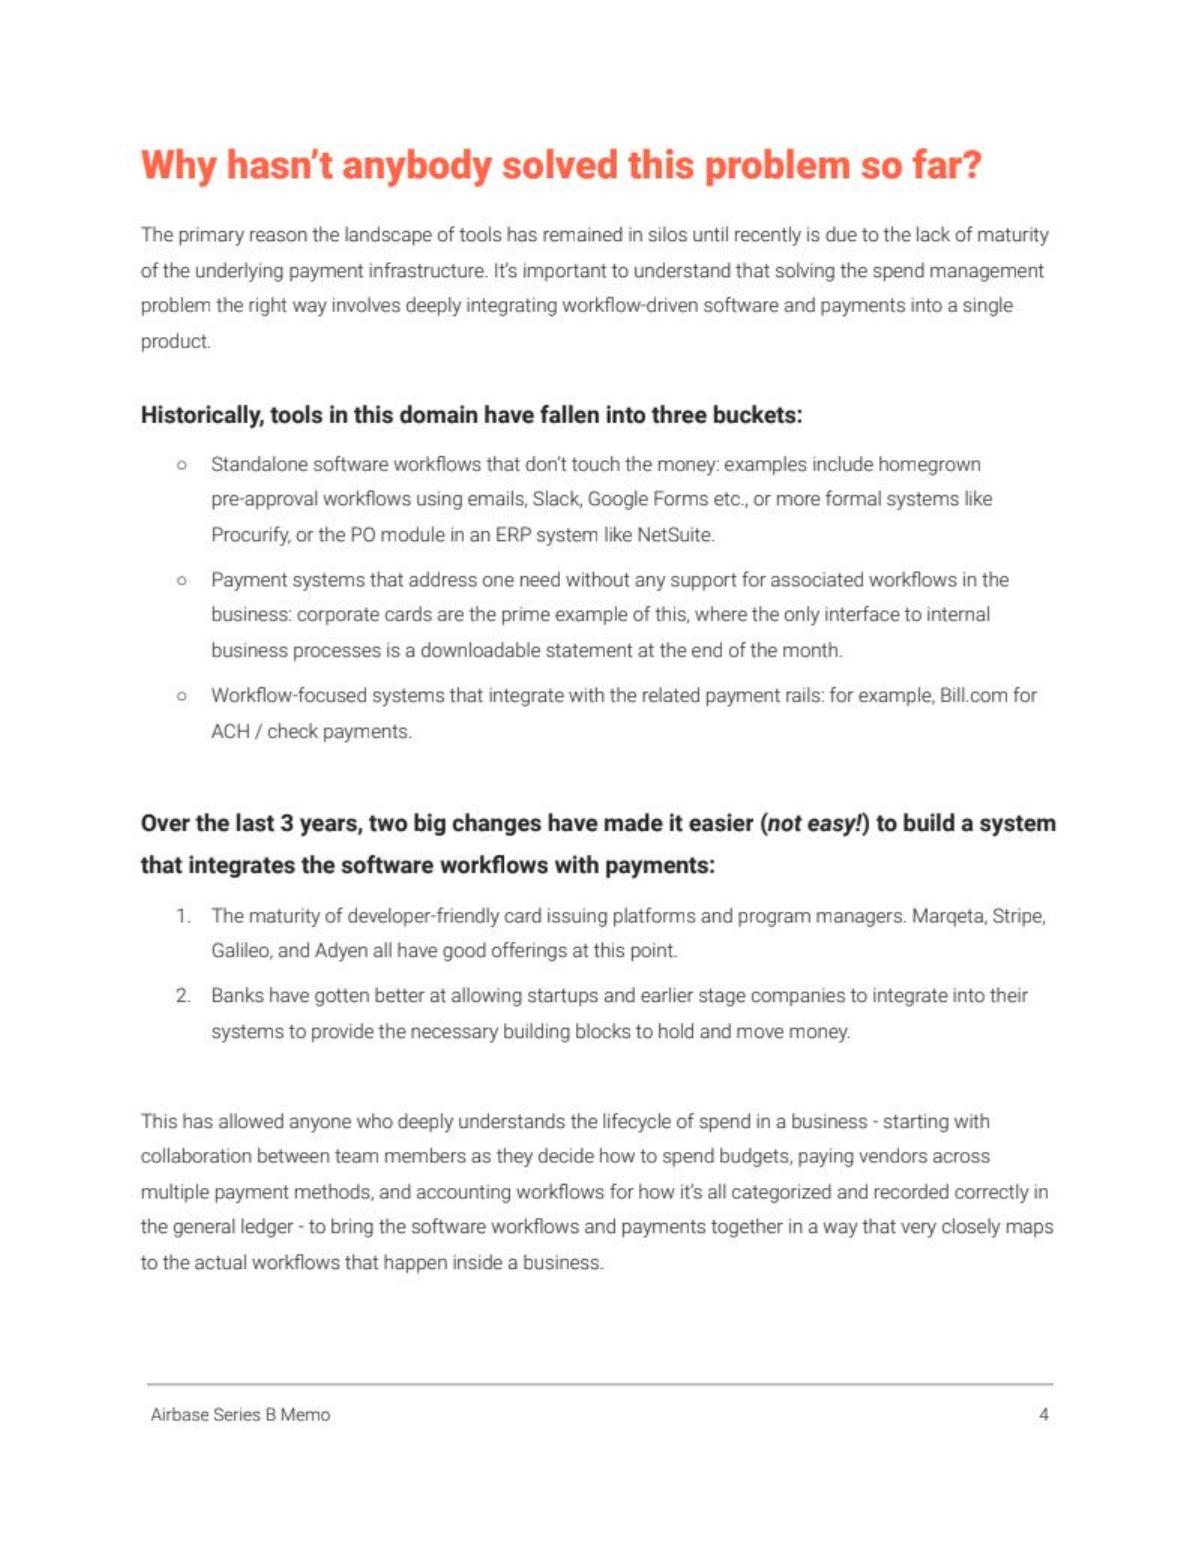
Spend management. A memo page on why the problem is still open.
Airbase deck, slide 4. Exact stored slide matched to this analysis.
Our analysis: It answers the investor question "why is this still a problem?" by sorting today's tools and naming their gap.
Evidence and limitation: No figures; named existing tools and infrastructure providers.
What a founder can adapt: Sort existing tools into two or three groups and say what each group misses.
Supporting analysis
What the deck claims: "Why hasn't anybody solved this problem so far?" Tools "have fallen into three buckets": "Standalone software workflows that don't touch the money" ("emails, Slack, Google Forms", "the PO module in an ERP"), "Payment systems... without any support for associated workflows" (corporate cards), and "Workflow-focused systems that integrate with the related payment rails" (Bill.com). Two changes (card-issuing platforms such as Marqeta and Stripe, and bank APIs) "made it easier (not easy!)".
Presentation choice: Grouping current tools shows the founder understands the category, and sets up the why-now.
When it does not fit: Add the finance team's cost today; the page explains the gap but not its price.
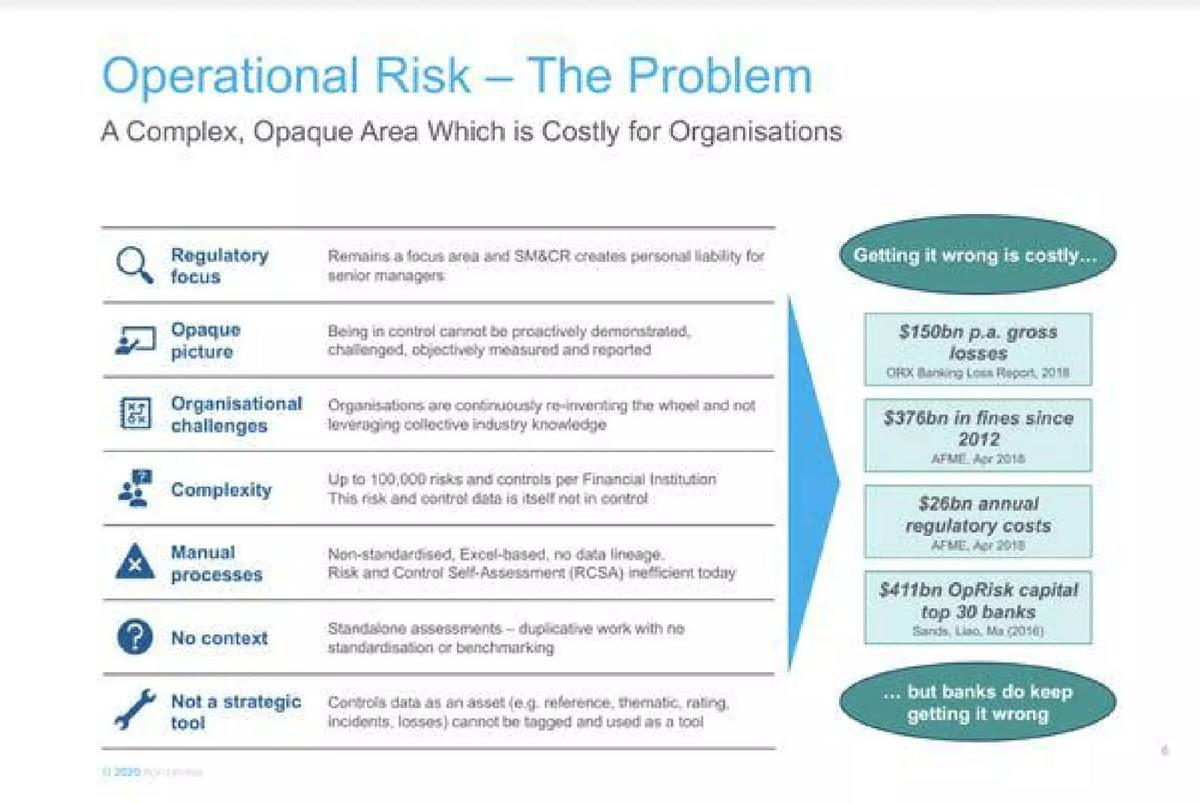
Operational risk data for banks. Seven problem rows and four sourced costs.
Acin deck, slide 5. Exact stored slide matched to this analysis.
Our analysis: The buyer is named (banks) and the costs are sourced, but they are industry totals, not one bank's cost.
Evidence and limitation: Four industry figures, each with a named source and year.
What a founder can adapt: Cite sources for big figures, then translate one into a single customer's cost.
Supporting analysis
What the deck claims: "Operational Risk — The Problem: A Complex, Opaque Area Which is Costly for Organisations." Rows include "Up to 100,000 risks and controls per Financial Institution" and "Manual processes: Non-standardised, Excel-based, no data lineage." "Getting it wrong is costly": "$150bn p.a. gross losses" (ORX, 2018), "$376bn in fines since 2012" (AFME), "$26bn annual regulatory costs" (AFME).
Presentation choice: Sourced figures make the stakes credible to a sceptical investor.
When it does not fit: Seven rows is a lot; lead with the manual Excel process and one cost.
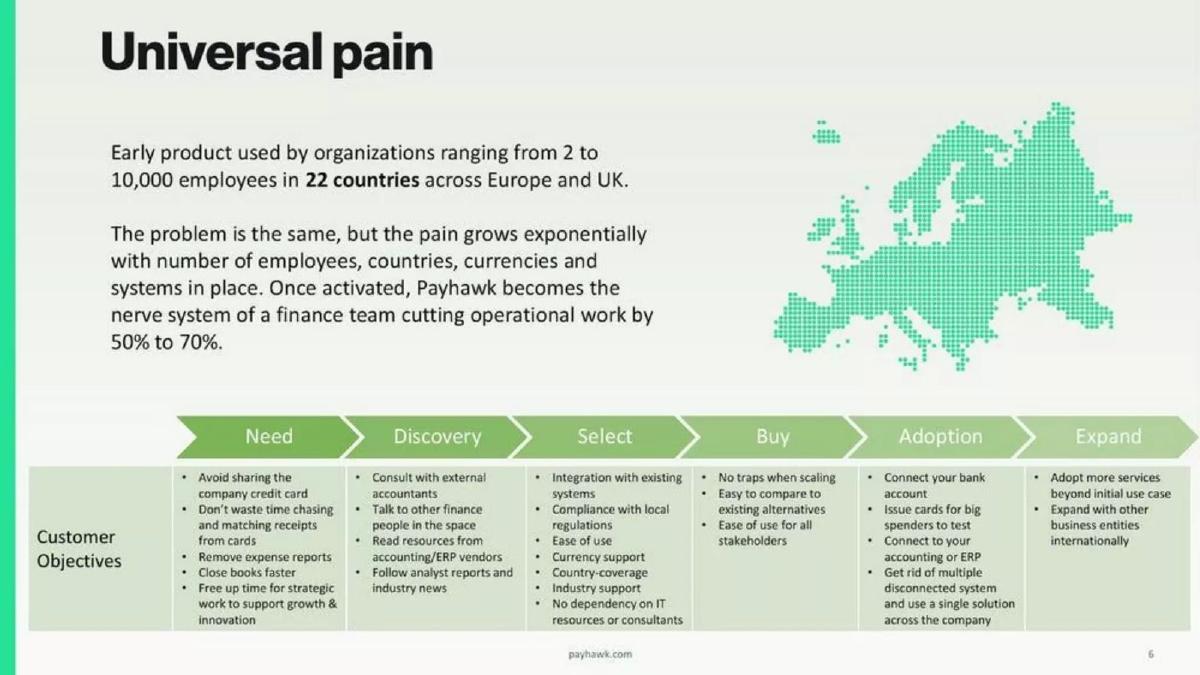
Spend management for finance teams. How the pain grows with company size.
Payhawk deck, slide 6. Exact stored slide matched to this analysis.
Our analysis: It shows the problem scaling with the customer, which is why larger customers pay more.
Evidence and limitation: Usage across 22 countries; the 50–70% reduction is unsourced.
What a founder can adapt: Say what makes the problem worse as a customer grows: people, locations, systems.
Supporting analysis
What the deck claims: "Universal pain." "Early product used by organizations ranging from 2 to 10,000 employees in 22 countries." "The problem is the same, but the pain grows exponentially with number of employees, countries, currencies and systems in place." Payhawk claims it cuts "operational work by 50% to 70%". Customer needs include "Avoid sharing the company credit card" and "Don't waste time chasing and matching receipts".
Presentation choice: Linking pain to company size supports expansion revenue later in the deck.
When it does not fit: The buying-journey table is a sales process, not a problem; move it to go-to-market.
Employee communication software. Why generic tools fall short.
StaffCircle deck, slide 6. Exact stored slide matched to this analysis.
Our analysis: It names the tools buyers already use and a group they can't reach: non-desk workers.
Evidence and limitation: No figures.
What a founder can adapt: Name the tools customers already use and the specific people or tasks they miss.
Supporting analysis
What the deck claims: "Email & Chat don't solve The Problem." "Email and Chat applications are generalist conversational tools overloaded with a mix of non-related items." "Most non-desk employees and contractors do not have access to internal company IT systems." "There are individual 3rd party 'point solutions' but businesses want a single unified platform."
Presentation choice: Naming non-desk workers gives a specific gap that email and chat genuinely miss.
When it does not fit: Six paragraphs of text, half describing the product. Cut to the gap and one cost.
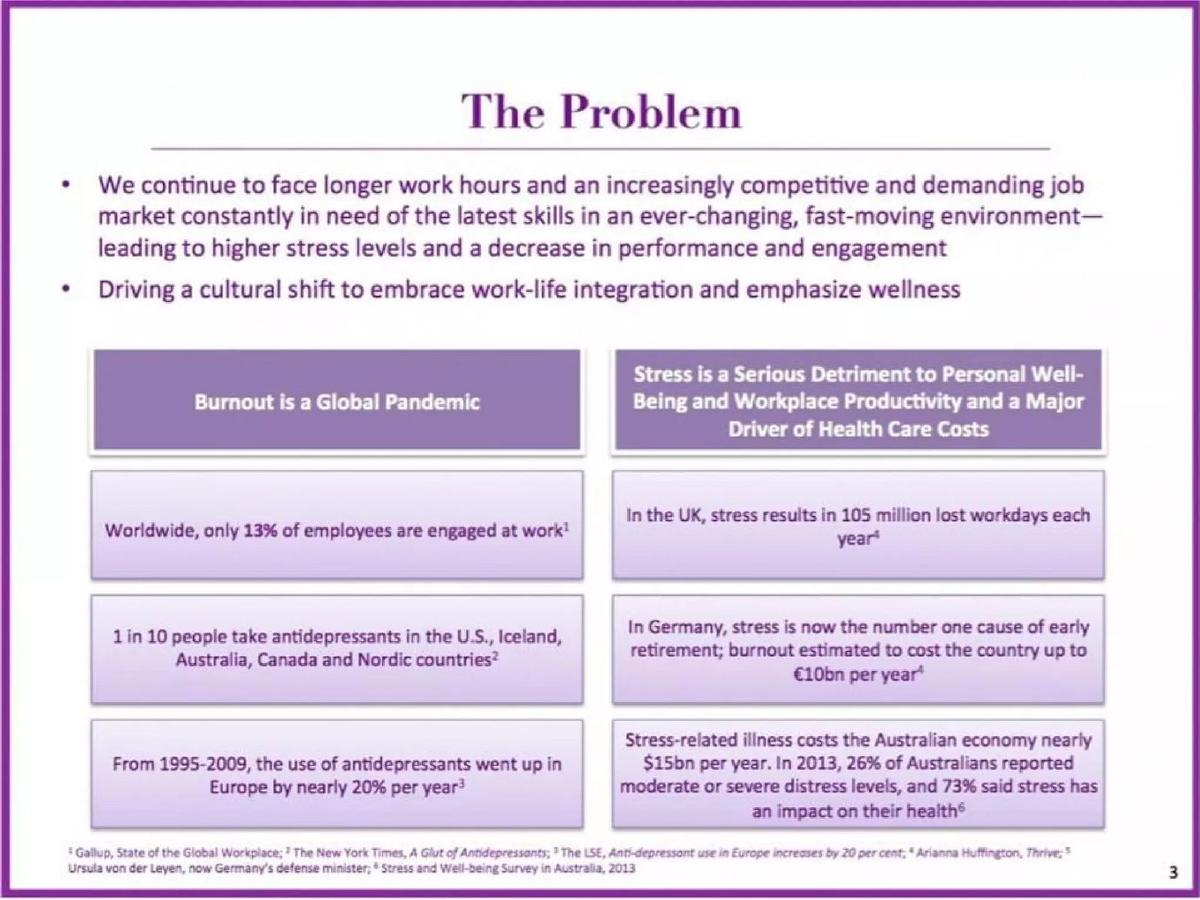
Workplace wellbeing. Included as a weaker pattern for a business buyer.
Thrive Global deck, slide 3. Exact stored slide matched to this analysis.
Our analysis: Well sourced, but every figure is about countries; none says what burnout costs the employer who would buy.
Evidence and limitation: Six footnoted figures, all national or global.
What a founder can adapt: Convert one figure into a cost per employer, such as lost days per 1,000 staff.
Supporting analysis
What the deck claims: "Burnout is a Global Pandemic": "Worldwide, only 13% of employees are engaged at work"; "1 in 10 people take antidepressants in the U.S., Iceland, Australia, Canada and Nordic countries". "In the UK, stress results in 105 million lost workdays each year"; stress "costs the Australian economy nearly $15bn per year".
Presentation choice: Included as a contrast: a real problem framed for society, not for a budget holder.
When it does not fit: Country-level statistics with no buyer named.
Whether each slide names the owner, prices the workaround, and says why current tools fail.
Example
Problem owner
Cost of workaround
Why current tools fail
IriusRisk
Security teams
Yes (3 days, $3,000 per app)
Yes (manual, not agile)
Rippling
HR, IT, finance
Yes (2× headcount)
Yes (disconnected systems)
Cloudsmith
Developers
Risk only
Partly
Airbase
Finance
No
Yes (three tool groups)
Acin
Banks' risk teams
Industry totals
Yes (Excel-based)
Payhawk
Finance teams
Claimed 50–70% saving
No
StaffCircle
Internal comms
No
Yes (email, chat, point tools)
Thrive Global
Not named
National totals
No
Key Takeaways
Name the team that owns the problem: finance, security, HR, developers. "Businesses" is too broad.
Put a price on today's workaround: days per task, dollars per task, fines, headcount.
Say why the tools the company already has don't fix it. Spreadsheets, email and point solutions are the usual answer.
Show how the pain grows with company size. Payhawk says it "grows exponentially" with employees, countries and systems.
Keep economy-wide statistics to one line. Buyers pay to fix their own cost, not a national one.
Build your B2B SaaS problem slide
One line per part, each with a number if you have one.
Owner. Which team or role does this work today, and who holds the budget?
Workaround cost. How long does one task take today, what does it cost, and how often does it happen?
Why tools fail. What do they use now (spreadsheets, email, another product), and what does it miss?
Growth. What makes the problem worse as the customer grows?
Copyable framework: [Team] spends [time/cost] on [task], [frequency]. They use [current tool], which can't [gap]. It gets worse with every [employee / location / system].
Illustrative example 1 — written by us
Before: Businesses struggle with inefficient onboarding processes.
After: HR teams at 200-person companies spend 5 hours setting up each new hire across 8 systems, 60 times a year. Their HR software doesn't update payroll, laptops or app access, so it's done by hand.
What improved: Our illustrative rewrite; figures are invented for the example. It names the owner, prices the task and says why current tools fall short.
What this guide adds
The general problem slide guide covers customer pain in any business. Business software is bought by a team with a budget, and investors check whether that team feels the cost today. This guide compares how software startups make that case.
The SaaS business model and traction guides cover pricing and growth; this guide covers the problem that justifies the purchase.
Three parts of a business software problem
Owner: the team or role whose work is broken (IriusRisk: security; Payhawk: finance; Rippling: HR, IT and finance).
Cost of the workaround: time, money or risk the current method creates (IriusRisk's 3 days and $3,000; Acin's fines and losses).
Why current tools fail: why spreadsheets, email or existing software haven't solved it (Airbase, StaffCircle, IriusRisk).
Strong slides cover all three. Most real slides cover two.
Common mistakes
No owner. "Businesses" or "organisations" hides who would buy.
Economy-wide numbers only. Translate them into one customer's cost.
No reason tools fail. Investors will ask why existing software hasn't fixed it.
Product on the problem slide. Keep what you built for the solution slide.
Sales process as problem. A buying journey belongs in go-to-market.
Diagnostic checklist
The slide names the team or role with the problem.
Today's workaround has a cost: time, money or risk.
The slide says why current tools don't fix it.
Big figures have a source and are translated to one customer.
No line describes your product.
Frequently asked questions
How we chose these examples
Corpus: published pitch deck teardowns on StartupFundraising.com. Founder-uploaded private decks are excluded.
Selection (2026-09-24): we searched extracted text of slides 2–6 for problem slides in decks that mention SaaS, subscriptions or business customers, and inspected about twenty-five candidates. We excluded consumer products, healthcare, climate and marketplace decks (covered by other problem guides) and matches that weren't problem slides.
Overlap check: the general problem slide guide covers customer pain in any business; the SaaS business model and traction guides cover pricing and growth. None of these eight decks appears in the general problem slide guide.
Thrive Global is included to show a weaker pattern. Rippling and Airbase are written memo pages rather than presented slides.
Review: all eight stored slide images were inspected on 2026-09-24 and matched to company, deck and slide number (editorial model review). No person has yet completed an editorial review of this page.
Figures are as shown on the slides; we have not verified them. We make no claim that any slide caused a fundraising outcome.