Cloudsmith’s Series A deck is a highly structured argument for the necessity of secure software distribution. By framing the problem through high-profile breaches like SolarWinds and CodeCov (Slide 5), the company establishes immediate urgency. The deck excels in demonstrating enterprise readiness, showcasing a 'who’s who' of tech logos including Shopify, Epic Games, and Carta (Slide 9). Most notably, the financial slides (Slides 13 and 17) provide a sophisticated view of their revenue mix, distinguishing between subscription and on-demand usage across three distinct customer tiers: Ultra, Ve…
Key takeaways
- The problem is framed using high-stakes analogies, comparing software delivery without safety to 'racing in the dark with no seat belt' (Slide 5).
- Cloudsmith leverages social proof by displaying over 30 high-tier customer logos, including Shopify and Netlify, to prove market fit (Slide 9).
- Revenue is segmented into three tiers—Ultra, Velocity Self-Serve, and Team Self-Serve—with the Ultra tier accounting for 59% of ARR (Slide 13).
- The deck distinguishes between 'Subscription' and 'On-Demand Usage' revenue, showing a diversified income stream (Slide 17).
- Traction is quantified with a 3x Year-over-Year (YoY) and 10% Month-over-Month (MoM) growth claim (Slide 17).
- The organization chart reveals a heavy lean toward Engineering and Marketing, with a dedicated 'Developer Relations' function (Slide 21).
- A 'Target Logos' slide identifies specific enterprise accounts like Apple, Visa, and Blizzard, signaling a clear outbound sales strategy (Slide 29).
- Competitive positioning is visualized through a pricing map, placing Cloudsmith against major incumbents like JFrog and Sonatype (Slide 33).
Introduction: The Software Supply Chain Mandate
Cloudsmith’s Series A deck is a clinical look at how to pitch a technical infrastructure product to venture capitalists. The deck, which supported a $15 million round, focuses heavily on the 'why now'—specifically the rise of catastrophic supply chain attacks. By moving quickly from the macro problem to granular customer data, Cloudsmith builds a case for a platform that is both mission-critical and highly scalable.
Slide 1: Title Slide
The deck opens with a minimalist title slide featuring the Cloudsmith logo and the tagline: "THE FUTURE OF SOFTWARE SUPPLY CHAINS." This positioning is strategic; it moves the conversation away from simple 'package management' and toward the broader, more lucrative category of 'supply chain security.'
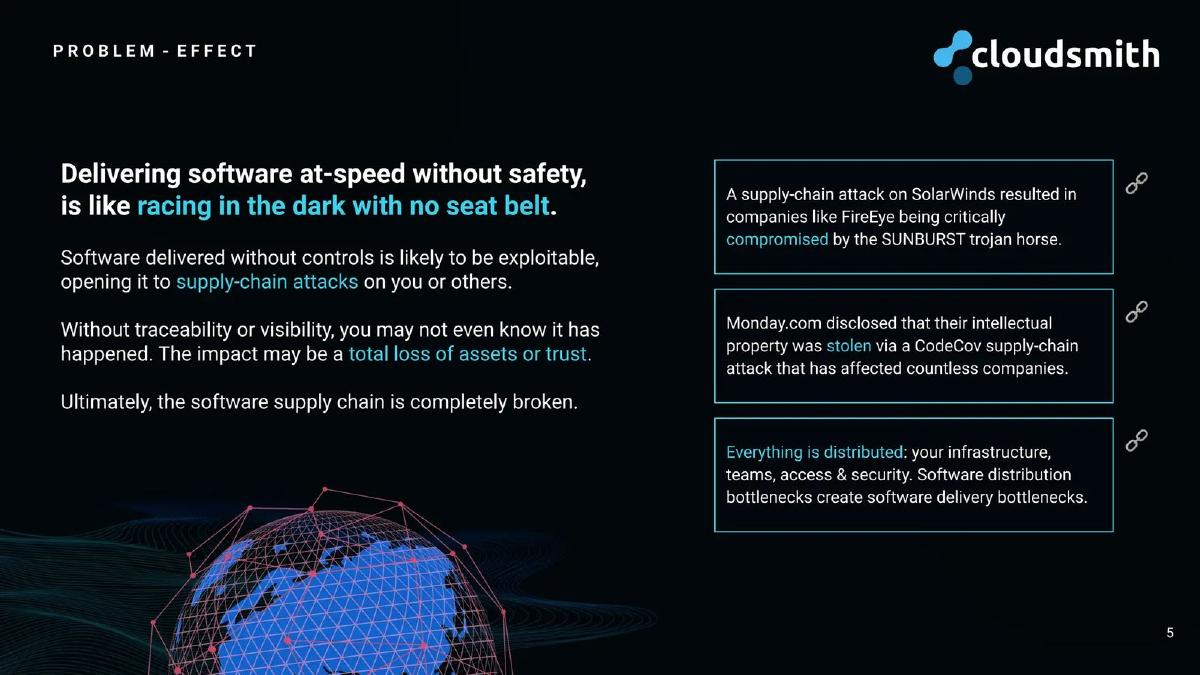
Slide 5: The Problem - Effect
Slide 5 establishes the stakes. It uses a visceral analogy: "Delivering software at-speed without safety, is like racing in the dark with no seat belt." The slide anchors this fear in reality by citing three specific points:
The SolarWinds attack and the SUNBURST trojan horse. · The CodeCov attack affecting Monday.com’s intellectual property. · The inherent risks of distributed infrastructure and bottlenecks.
The conclusion is blunt: "Ultimately, the software supply chain is completely broken." This creates a 'burning platform' that justifies the need for Cloudsmith's solution.
Slide 9: Accumulating Trust
This is a classic 'logo wall' slide, but the quality of the logos is exceptional for a Series A company. Cloudsmith lists "Over REDACTED# customers distributing to millions." Visible logos include high-growth tech firms and established enterprises such as Shopify, Epic Games, Carta, Netlify, Font Awesome, and Myob. The diversity of these logos—spanning gaming, e-commerce, and fintech—demonstrates that the problem Cloudsmith solves is horizontal and industry-agnostic.
Slide 13: Customer Segmentation
Slide 13 is perhaps the most important slide for a Series A investor. It breaks down the business into three tiers: Ultra, Velocity Self-Serve, and Team Self-Serve. While the specific dollar amounts are redacted, the percentage contributions to ARR are clear:
Ultra: 59% of ARR. · Velocity Self-Serve: 23% of ARR. · Team Self-Serve: 18% of ARR.
This slide also introduces a key nuance in their business model: ARR = Subscription (Left) + On-Demand (Right). By showing that a significant portion of their revenue comes from usage-based billing alongside traditional subscriptions, Cloudsmith demonstrates a 'land and expand' capability where revenue grows as the customer's software distribution volume increases.
Slide 17: Traction Metrics
Cloudsmith doubles down on data here, claiming 3x YoY and 10% MoM growth. The slide features a stacked area chart showing ARR growth from August 2019 to April 2021. The chart distinguishes between 'Subscription' (dark blue) and 'On-Demand Usage' (light blue), showing that both segments are growing in tandem. The slide also lists placeholders for critical SaaS KPIs: NPS, NRR, CAC, LTV, Payback Time, and ACV. The inclusion of an 'Ultra-only' metrics section shows they are tracking their most valuable customers with extreme precision.
Slide 21: Organisation Chart
The team slide is presented as a formal org chart rather than a collection of headshots. It identifies Alan Carson (Co-Founder & CEO) and Lee Skillen (Co-Founder & CTO) at the top. The structure is lean but functional, with a notable emphasis on Developer Relations (Dan McKinney and Ciara Carey). This suggests that Cloudsmith views the developer community as a primary acquisition channel. The marketing department is also well-staffed for this stage, including a Paid Media Manager and Creative Services, indicating a readiness to deploy capital into customer acquisition.
Slide 25: Thank You / Questions
A standard closing slide providing direct email contact information for the CEO and CTO. It maintains the dark, professional aesthetic of the rest of the deck.
Slide 29: Target Logos
This slide provides a window into Cloudsmith’s future growth strategy. It isn't a list of who they have, but who they want. The 'Target Logos' include massive entities like Apple, Visa, Blizzard, American Express, and Uber. For an investor, this slide shows the ceiling for the company is incredibly high; they are not just looking for startups, but for the backbone of the global economy.
Slide 33: Competitive Pricing
The final slide in this selection addresses the competitive landscape. It places JFrog in a box of its own, likely as the primary 'legacy' incumbent to beat. The rest of the market is mapped out, including cloud providers (AWS, Azure, Google), repository hosts (GitHub, GitLab), and niche players (PackageCloud, MyGet, GemFury). Cloudsmith positions itself in the upper-right quadrant of this map, though the axes are not explicitly labeled, the visual implication is that they offer a more modern or comprehensive solution than the fragmented alternatives.
What Cloudsmith Does Exceptionally Well
Cloudsmith’s deck is a masterclass in revenue transparency. Many Series A decks hide behind vague 'growth' percentages, but Cloudsmith provides a detailed breakdown of where their money comes from (Slide 13). By separating subscription revenue from usage-based revenue, they prove that their product is 'sticky'—customers don't just pay a flat fee; they pay more as they use the product more. This is a highly attractive trait for investors looking for 'negative churn' potential.
Furthermore, the framing of the problem (Slide 5) is excellent. They don't just say 'we manage packages.' They say 'the software supply chain is broken,' and they use the most famous hacks in recent history to prove it. This elevates the product from a 'nice-to-have' developer tool to a 'must-have' security requirement.
What is Missing from the Deck
Based on the 9 slides provided out of 36, there are a few notable omissions that were likely covered in the full presentation:
Product Deep Dive: We see the 'why' and the 'who,' but these slides don't show the 'how.' There are no screenshots of the platform or technical diagrams explaining how Cloudsmith sits between a build server and a production environment. · Unit Economics Details: While Slide 17 lists CAC and LTV as categories, the redacted nature of this public version hides the actual ratios. Investors would want to see if the LTV/CAC ratio is improving as they scale the 'Ultra' tier. · The 'Ask': There is no slide in this selection detailing how much they are raising (though the source listing confirms $15M) or how they intend to spend the capital (e.g., hiring 20 more engineers, expanding into the APAC market).
Founder's Guide: What to Copy
1. Segment your traction: Don't just show one ARR line. If you have different customer types (e.g., Enterprise vs. SMB), show how each contributes to the whole. Cloudsmith’s Slide 13 is a perfect template for this.
2. Use 'Target Logos' to show ambition: Most founders only show who they have signed. Showing who you are going to sign (Slide 29) shows that you have a clear sales roadmap and understand your Total Addressable Market (TAM) at a granular level.
3. Map the competition visually: Don't just use a checklist of features. Use a landscape map (Slide 33) to show how you fit into the broader ecosystem. This helps investors understand if you are a 'feature' or a 'platform.'
4. Anchor the problem in current events: If your industry has had a 'watershed moment' (like the SolarWinds hack was for DevOps), use it. It saves you from having to convince the investor that a problem exists; you only have to convince them that you are the best solution for it.
Frequently asked questions
- What is the core problem Cloudsmith addresses?
- Cloudsmith addresses the 'broken' software supply chain. According to Slide 5, delivering software at speed without safety leads to exploitable supply-chain attacks. They cite the SolarWinds/SUNBURST and CodeCov attacks as primary examples of the 'total loss of assets or trust' that occurs when companies lack traceability and visibility in their distribution process.
- How does Cloudsmith segment its customer base?
- The company uses a three-tier segmentation model: Ultra, Velocity Self-Serve, and Team Self-Serve. Slide 13 shows that the 'Ultra' tier is their most significant, contributing 59% of total ARR. The 'Velocity' tier contributes 23%, and 'Team' contributes 18%. This breakdown helps investors understand the sales motion, from low-touch self-serve to high-touch enterprise deals.
- What metrics does Cloudsmith use to prove traction?
- Cloudsmith highlights 3x YoY growth and 10% MoM growth. Slide 17 provides a comprehensive dashboard including ARR, Customer count, NPS, NRR, CAC, LTV, Payback Time, and ACV. They specifically track these metrics for 'Ultra-only' customers to demonstrate the health of their enterprise segment.
- Who are Cloudsmith's primary competitors?
- Slide 33 identifies a crowded landscape including JFrog (highlighted as a primary platform competitor), Sonatype/Nexus, PackageCloud, and cloud-provider native tools like AWS CodeArtifact, Google Cloud Platform, and Azure DevOps. They also list developer-centric tools like GitHub, GitLab, and Docker.
- What does the team structure look like at the Series A stage?
- The organization chart on Slide 21 shows a balanced structure led by Alan Carson (CEO) and Lee Skillen (CTO). The team is divided into Engineering (4 members shown), Product/DevRel (2 members), and Marketing (4 members). The presence of a Chief of Staff and two Developer Relations roles indicates a focus on operational scaling and community-led growth.