Peak’s pitch deck is a lean, 10-slide presentation that successfully bridges the gap between high-level AI vision and concrete enterprise metrics. Founded in 2014 and having raised over $117 million, the company uses this deck to highlight its 'Decision Intelligence' platform. The narrative moves quickly from the macro problem—data silos and skills shortages—to a solution that boasts a 79% gross margin and 140% year-over-year growth as of Q1 2020. While the deck is light on specific customer case studies and competitive analysis, it leans heavily into cultural health, citing a 0% unwanted att…
Key takeaways
- The deck reports a significant 140% Year-over-Year ARR growth as of Q1 2020 on slide 7.
- Peak maintains high software-like efficiency with a reported 79% Gross Margin in Q1 2020, shown on slide 7.
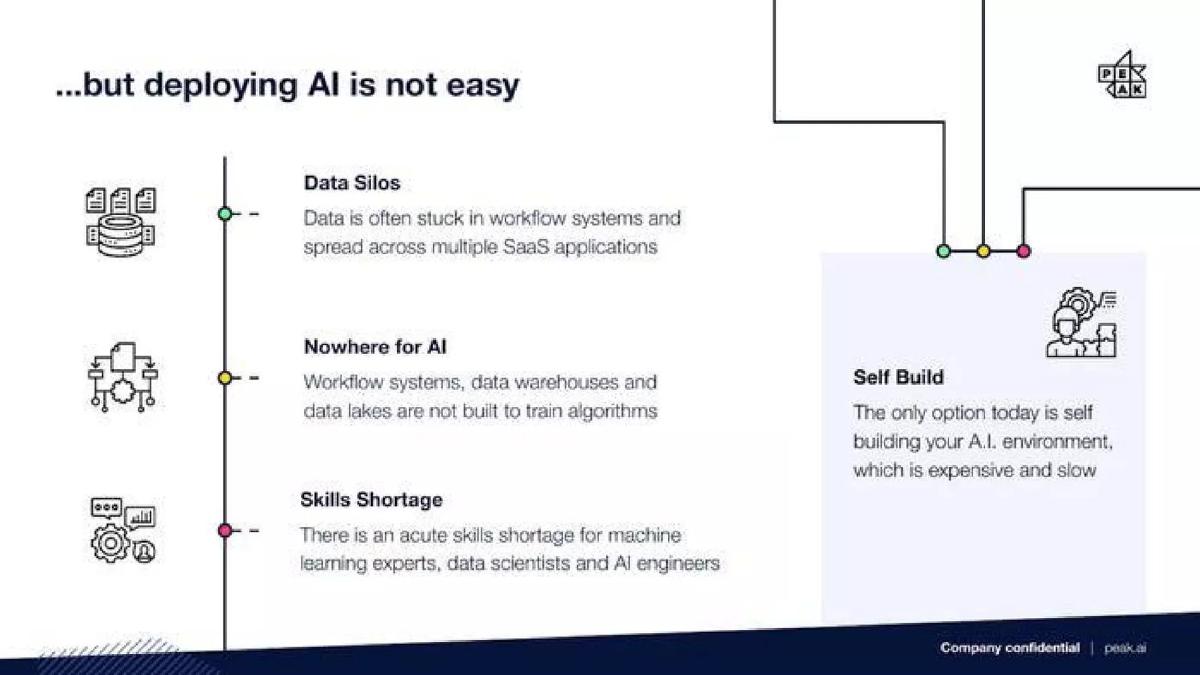
- The company identifies three core barriers to AI adoption: Data Silos, Nowhere for AI, and Skills Shortages on slide 3.
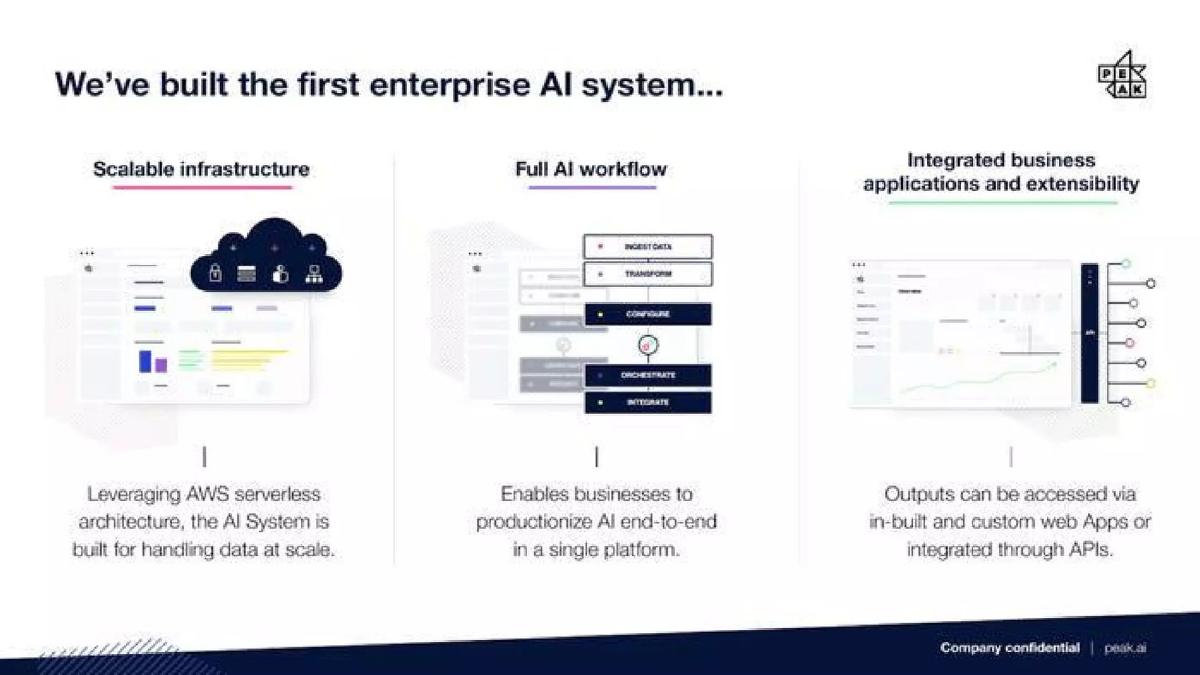
- Peak positions itself as the 'first enterprise AI system' leveraging AWS serverless architecture on slide 4.
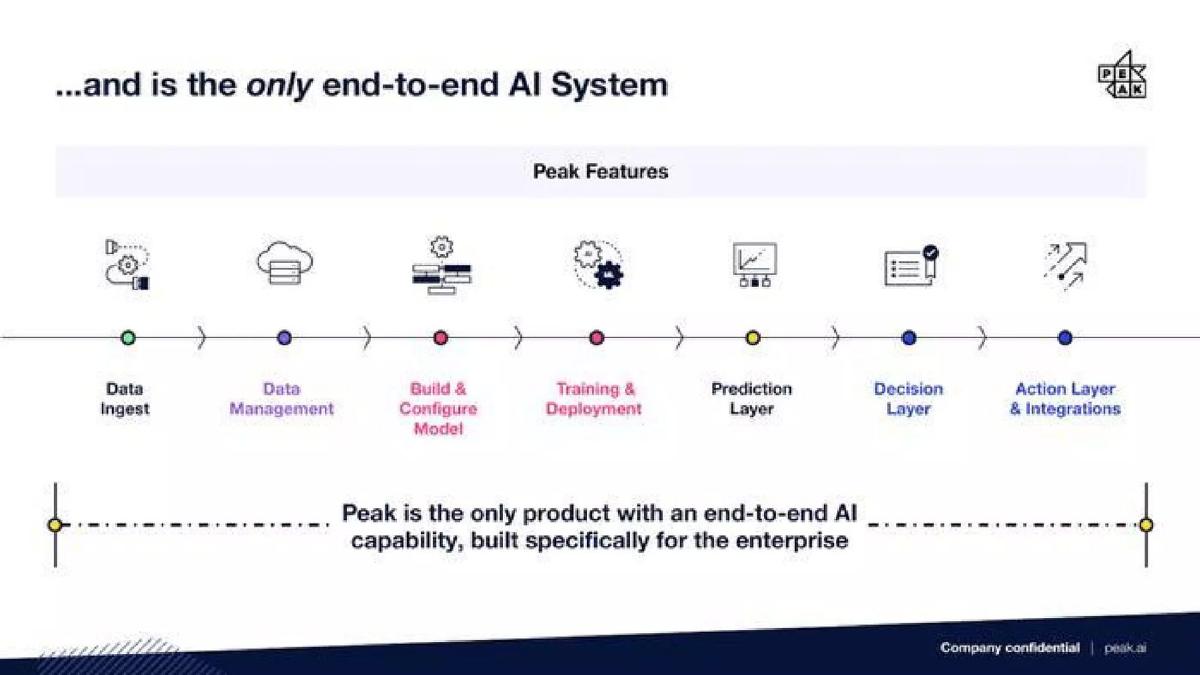
- The platform covers a seven-stage end-to-end workflow from Data Ingest to an Action Layer & Integrations on slide 6.
- Internal culture is a primary selling point, with slide 8 highlighting a 4.7/5 team satisfaction score and 0% unwanted turnover.
- The deck completely omits a specific 'Ask' slide, valuation, or detailed use of funds.
- There is no dedicated competitor slide, instead relying on the 'Self Build' alternative as the primary friction point on slide 3.
Peak Pitch Deck Teardown: The Decision Intelligence Narrative
Peak, a Manchester-based AI firm founded in 2014, has become a significant player in the 'Decision Intelligence' space. With over $117 million raised to date, their approach to fundraising is characterized by a lean, metric-heavy narrative that emphasizes business outcomes over technical complexity. This 10-slide deck, dating around early 2020, provides a clear window into how they secured Series-level interest by focusing on high-margin growth and organizational stability.
The Hook and the Problem (Slides 1-3)
Slide 1: Title Slide The deck opens with the company logo and the tagline "Do great things." The imagery shows a modern, green office environment with employees at workstations. It sets a tone of professional, established operations rather than a garage-stage startup.
Slide 2: The Macro Thesis Peak starts with a bold, inevitable claim: "Every company... Will be an AI company." This is a classic 'Why Now' setup. By positioning AI as a universal future requirement, they expand their Total Addressable Market (TAM) to include every enterprise on the planet, not just tech-first firms.
Slide 3: The Friction Points This slide identifies why the transition to AI is failing for most. They list three specific hurdles: Data Silos (data stuck in SaaS apps), Nowhere for AI (warehouses aren't built for training), and Skills Shortage (lack of ML experts). Crucially, they identify the current alternative—"Self Build"—as "expensive and slow." This frames Peak not just as a tool, but as a cost-saving and time-saving necessity.
The Solution and Product Architecture (Slides 4-6)
Slide 4: The Enterprise AI System Peak introduces its solution as the "first enterprise AI system." They break this down into three pillars: Scalable infrastructure (leveraging AWS serverless), Full AI workflow (productionizing AI in a single platform), and Integrated business applications (outputs via apps or APIs). This slide is critical because it moves the conversation from 'AI as a service' to 'AI as a system of record.'
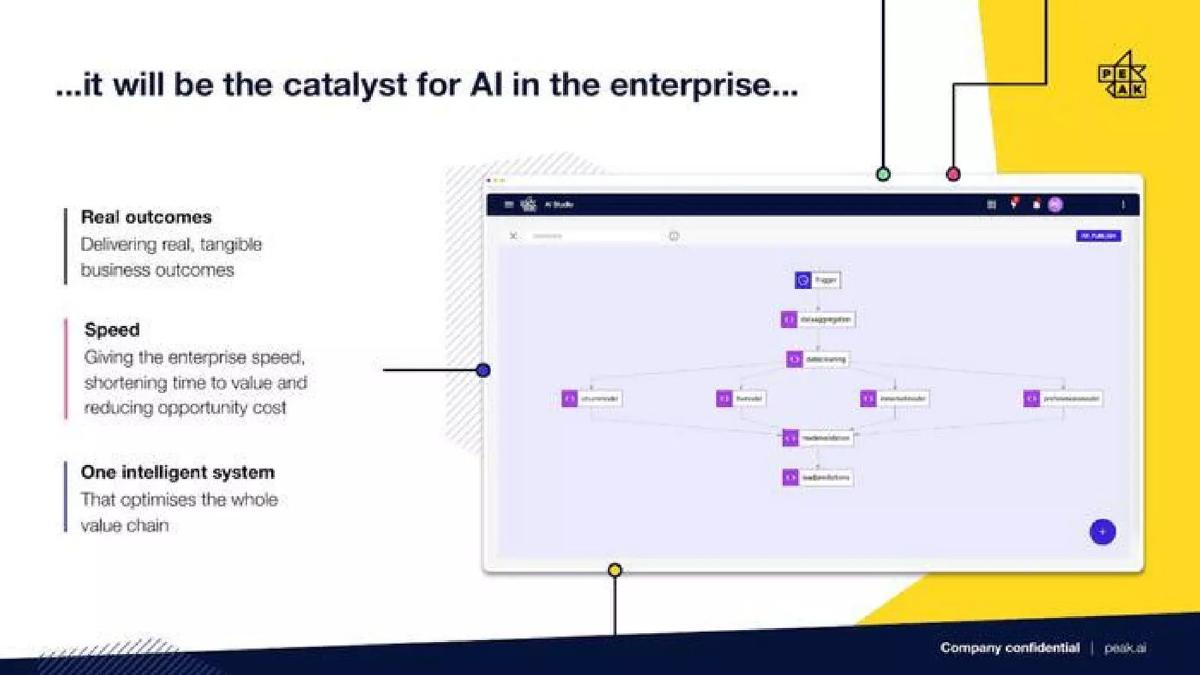
Slide 5: The Catalyst for Outcomes Here, the deck shows a screenshot of the "AI Studio." The focus is on three value drivers: Real outcomes , Speed (shortening time to value), and One intelligent system that optimizes the whole value chain. By showing the UI, they prove the product is real and functional, moving beyond the theoretical slides that preceded it.
Slide 6: The End-to-End Workflow This slide provides a linear visualization of the Peak feature set. It maps the journey from Data Ingest to Data Management , Build & Configure Model , Training & Deployment , Prediction Layer , Decision Layer , and finally the Action Layer & Integrations . This is a comprehensive map that reinforces their claim of being the "only" end-to-end system, suggesting that competitors only handle fragments of this chain.
Traction and Culture (Slides 7-8)
Slide 7: Growth and Margins This is the 'money slide.' Peak displays an ARR chart showing consistent, accelerating growth from July 2017 to March 2020. The key figures are hard to ignore: 140% YoY ARR Growth and a 79% Gross Margin as of Q1 2020. A 79% margin is gold standard for SaaS, indicating that their AI isn't just a disguised services business, but a highly automated, scalable software platform.
Slide 8: The Team Foundation In a rare move for a 10-slide deck, an entire slide is dedicated to HR metrics. They show a Headcount evolution chart, a 4.7/5 Team satisfaction score, and a 0% unwanted team turnover in the past six months. In the hyper-competitive AI talent market, these metrics are as important as revenue. They signal to an investor that the company is a stable vessel that won't be derailed by a mass exodus of data scientists.
Vision and Closing (Slides 9-10)
Slide 9: The Global Vision The vision is stated clearly: "To be the global market leader in enterprise AI Systems." The background image of Times Square suggests international ambitions, specifically a push into the US market, which is typical for UK-based startups at this stage.
Slide 10: Closing The deck ends as it began, with the "Do great things" tagline and a photo of the team in a meeting. It brings the focus back to the people behind the technology.
What Works in the Peak Deck
Metric Transparency: Including the 79% gross margin is a powerful way to defeat the common investor fear that AI companies are actually low-margin consulting shops. · Problem-Solution Alignment: The three problems identified on slide 3 (Silos, Infrastructure, Skills) are directly addressed by the three pillars on slide 4. This logical flow makes the product feel like an inevitable solution. · Cultural De-risking: By highlighting 0% attrition, Peak addresses a major operational risk—talent loss—that most founders ignore in their decks. · Minimalist Design: The deck uses whitespace effectively. It doesn't overwhelm the reader with technical diagrams, focusing instead on the business logic of the 'Decision Intelligence' category.
What is Missing from the Peak Deck
The Ask: There is no slide detailing how much capital is being sought, the valuation expectations, or the specific milestones the new capital will unlock. · Competitive Landscape: While they mention 'Self Build' as a competitor, they do not address other AI platforms or cloud-native AI tools from giants like Google or Microsoft. · Founder Backgrounds: The deck lacks a traditional 'Team' slide with bios. While the cultural metrics are great, investors usually want to see the specific pedigree of the leadership team. · Customer Case Studies: Although the catalogue listing mentions names like KFC and PepsiCo, the slides themselves are light on specific success stories. Adding a slide on how a 5% revenue increase was achieved for a specific client would have strengthened the 'Real Outcomes' claim on slide 5.
What a Founder Should Copy
The 'End-to-End' Map: Slide 6 is a perfect example of how to visualize a complex technical process for a non-technical audience. It shows breadth without getting bogged down in code. · Focus on Margins: If you have high margins (70%+), shout it from the rooftops. It is the single best way to prove you are a software company and not a services firm. · Retention as Traction: If your team turnover is low, use it as a metric. It proves you have a functional culture and that your 'Skills Shortage' risk is lower than your competitors'. · Logical Progression: The deck follows a strict 'Macro Trend -> Specific Barriers -> Integrated Solution -> Proven Traction' flow. This narrative structure is easy for an associate at a VC firm to summarize for their partners.
Frequently asked questions
- What is Peak's primary value proposition?
- Peak positions itself as a 'Decision Intelligence' company. According to the deck, it provides the first end-to-end enterprise AI system that integrates data management, model building, and an 'Action Layer.' The goal is to move beyond simple analysis to actually optimizing the entire value chain, providing 'real, tangible business outcomes' rather than just technical insights.
- How does Peak justify its market necessity?
- On slide 3, Peak argues that while every company will eventually be an AI company, current deployment is hindered by three factors: data stuck in silos, a lack of infrastructure built specifically to train algorithms, and an acute shortage of machine learning experts. They position their platform as the alternative to the 'expensive and slow' process of self-building an AI environment.
- What are the key financial metrics disclosed in this deck?
- The deck is highly transparent regarding growth and efficiency. Slide 7 shows a steep upward curve in ARR from July 2017 to March 2020. Specifically, it cites 140% YoY ARR growth and a 79% gross margin for Q1 2020. While the exact ARR figure is redacted as '£xxm,' the growth rate and margin suggest a highly scalable SaaS model.
- Why does the deck spend an entire slide on team satisfaction?
- Slide 8 focuses on 'great foundations,' highlighting a 4.7/5 satisfaction score and 0% unwanted attrition. In the AI sector, where the 'Skills Shortage' (mentioned on slide 3) is a major risk, proving that a company can retain talent is a powerful de-risking signal for investors. It suggests the company can execute its roadmap without constant hiring friction.
- What is missing from this pitch deck?
- The deck is notably missing a slide on the competitive landscape, a detailed breakdown of the 'Ask' (how much they are raising and why), and specific customer logos or case studies within the slides themselves. It also lacks a slide introducing the individual founders' backgrounds, opting instead to show the collective team and cultural metrics.