The Opendoor SPAC deck serves as a blueprint for high-growth, asset-heavy startups transitioning to public markets. It addresses the inherent risks of the iBuyer model—buying, renovating, and flipping homes—by demonstrating a clear path to profitability through operational efficiency and ancillary services. The presentation highlights a $1.3T market opportunity while showcasing a 12x efficiency advantage over traditional real estate agents. With a focus on 'Contribution Margin' (CM) positive markets, Opendoor projected a leap from $2.5B in 2020 revenue to $9.8B by 2023. The deck effectively u…
Key takeaways
- Opendoor claims a 12x efficiency advantage in transactions per person compared to traditional real estate agents (Slide 18).
- The company achieved a $2.7B run-rate revenue in 1Q20 across its first six markets, with Phoenix leading at a 4.2% market share (Slide 20).
- A significant portion of the growth strategy relies on ancillary services like title, escrow, and financing to boost long-term contribution margins to 7-9% (Slide 34, 40).
- The deck identifies a massive $1.3T total annual GMV in the U.S. real estate market, with 87% of homes falling within Opendoor's 'buy box' of $100K to $750K (Slide 24).
- Operational maturity is demonstrated by a 50% reduction in spend per home over two years and 40%+ bulk pricing discounts on materials (Slide 18).
- The transaction overview shows a pro forma enterprise value of $4.8B and $1.5B of pro forma cash on the balance sheet (Slide 45).
- Financial projections target a 2023 revenue of $9.8B with a 5.5% contribution margin, aiming for Adjusted EBITDA breakeven by that year (Slide 38).
- The 'buy box' strategy is validated by a 34% real seller conversion rate in 2019, with 90% of those sellers choosing to sell direct without agents (Slide 14).
Introduction: The iBuyer Institutionalization
The Opendoor SPAC deck from 2020 is a pivotal document in the history of PropTech. It represents the moment the 'iBuyer' model—where a company buys homes directly from consumers to resell them—moved from a venture-backed experiment to a public-market heavyweight. With 46 slides (23 of which are analyzed here), the presentation aims to convince institutional investors that Opendoor isn't just a house-flipper, but a high-margin technology platform. The deck successfully facilitated a $1B capital raise and a $4.8B valuation.
The Foundation: Team and Vision
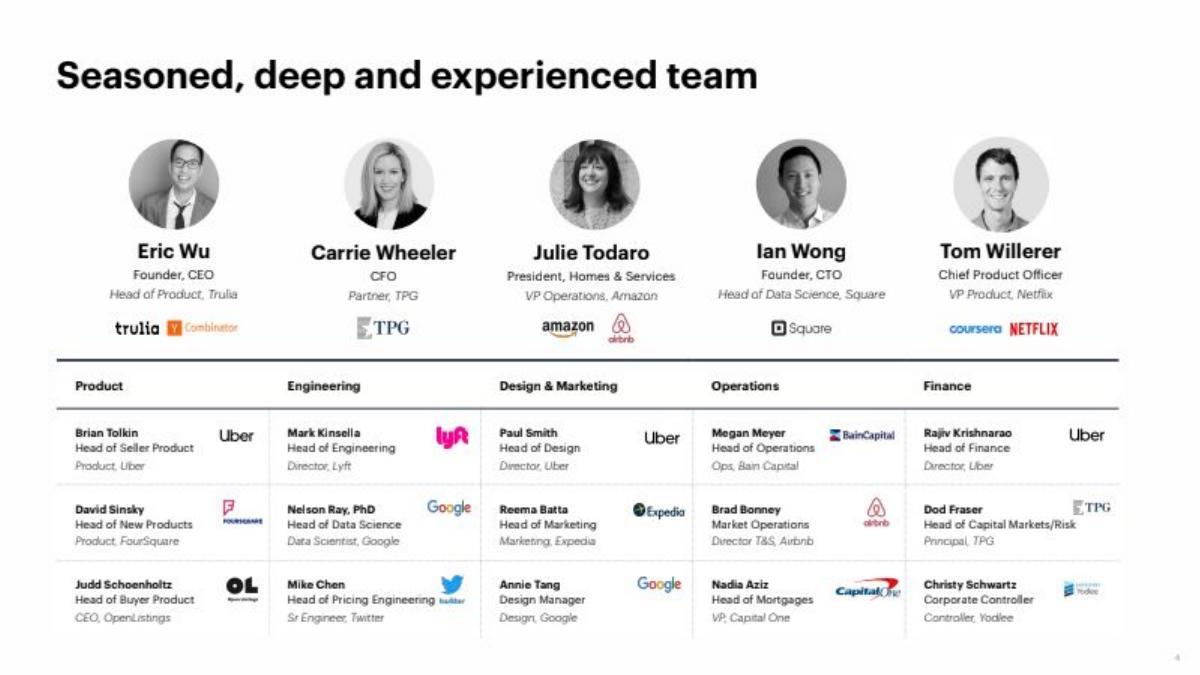
Slide 4 introduces a 'seasoned, deep and experienced team.' It highlights founders Eric Wu (Trulia) and Ian Wong (Square), alongside executives from TPG, Amazon, Netflix, and Uber. This slide is critical for a SPAC; it signals to investors that the company has the operational 'adults in the room' necessary to manage a multi-billion dollar balance sheet and complex logistics. The inclusion of logos like Google, Lyft, and Bain Capital across the broader leadership team reinforces this narrative of institutional-grade talent.
Slide 6 shifts to a human element with 'Charlisa’s next chapter.' By featuring a real customer story, Opendoor grounds its high-tech claims in real-world utility. This serves as a brief emotional bridge before the deck dives into the heavy mechanics of the business model.
The Investment Thesis
Slide 8 outlines the 'Investment highlights.' It lists six core pillars: a massive fragmented market, superior consumer experience, market leadership with a low-cost platform, rapid growth, strong unit economics, and significant upside. This slide acts as an executive summary for the entire pitch, setting the stage for the data-heavy slides that follow.
Slide 10 defines the problem. It characterizes the traditional real estate process as 'complex, uncertain, time-consuming and offline.' It provides a detailed breakdown of costs, claiming the traditional process can cost as much as 12%+ of the transaction, totaling $29,630 on a $250K home. By quantifying the pain point, Opendoor positions its service not just as a convenience, but as a financial optimization for the consumer.
Product and Conversion
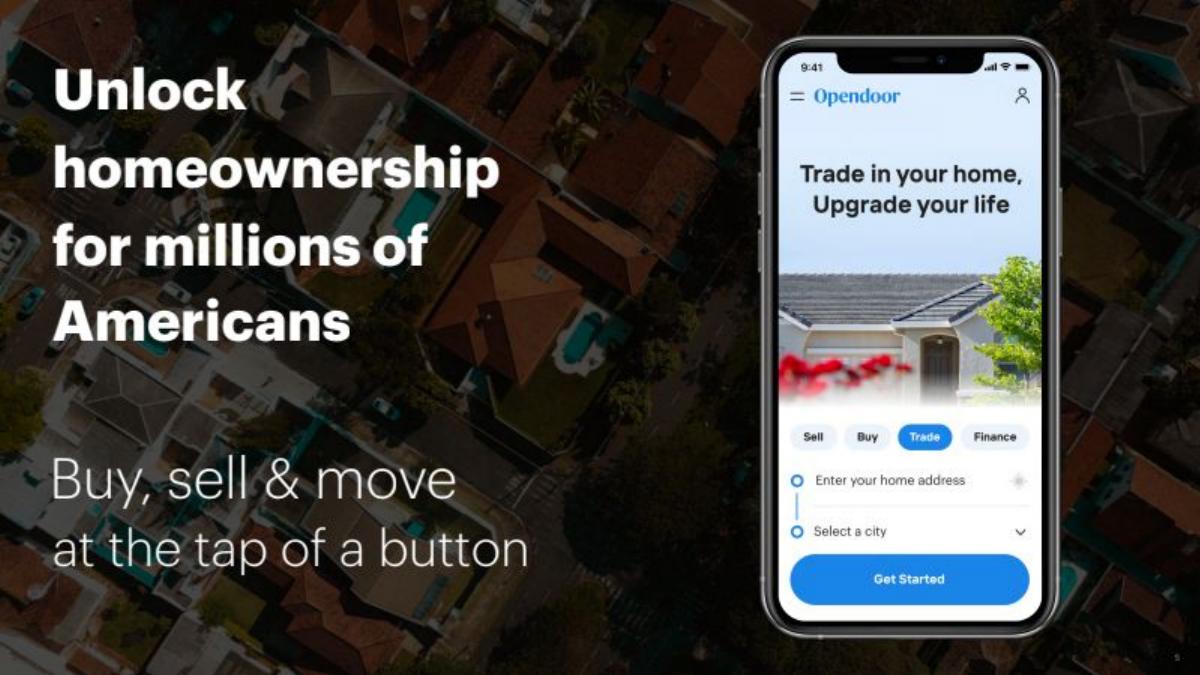
Slide 12 showcases the digital experience. It emphasizes 'Self-tour homes,' 'Financing in-app,' and a 'Digital offer process.' The visuals of the mobile app are intended to show that Opendoor has successfully moved the most friction-heavy parts of real estate into a smartphone interface.
Slide 14 provides evidence of product-market fit. It claims a 34% real seller conversion rate in 2019 and notes that 90% of sellers choose to sell direct to Opendoor without agents. A key chart on this slide shows 'Real seller conversion vs. fees,' demonstrating that even at a 10% fee, conversion remains at 23%, while it jumps to 44%+ when fees are below 6%. This data suggests strong pricing power and elastic demand for their convenience-based model.
The Operational Engine
Slide 16 explains the 'real estate service stack.' Opendoor breaks its business down into five components: Pricing, Home Ops, Fulfillment, Capital Markets, and Customer Experience. All of this is built on a 'Foundation of software and data science.' This is a crucial slide for justifying a tech valuation for an asset-heavy business; it argues that the software is what enables the physical operations to scale.
Slide 18 doubles down on this efficiency. It claims Opendoor is '12x more efficient than a traditional agent' in terms of transactions per person. It also cites a 50% reduction in spend per home over the last two years and 40%+ bulk pricing discounts on materials. The mention of 'Opendoor Scout,' an app to manage home ops workflows, provides a specific example of the technology in action.
Market Reach and Potential
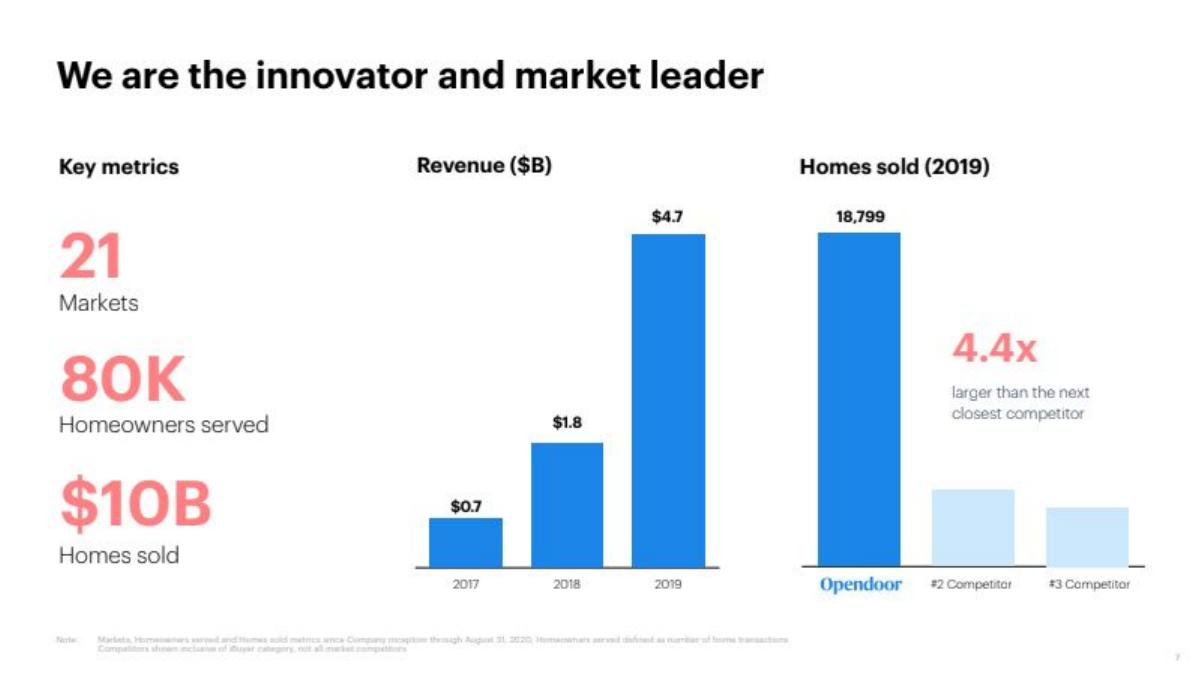
Slide 20 shows the company's footprint as of 1Q20. Across six markets (Phoenix, Las Vegas, Dallas-Fort Worth, Raleigh-Durham, Atlanta, and Orlando), they reached a $2.7B run-rate revenue. Phoenix is the standout with a 4.2% market share and $1.0B in run-rate revenue. This slide proves that the model works at scale in diverse geographic regions.
Slide 22 addresses the 'Track record of new market launches.' It shows a graph of market share by maturity, illustrating that newer markets (the 'Next 15') are scaling faster than the original Phoenix market. This 'S-curve' visualization is a classic pitch deck tactic to show that the company has 'cracked the code' on expansion.
Slide 24 and Slide 26 frame the total addressable market (TAM). Slide 24 identifies a $1.3T annual GMV in the U.S., while Slide 26 compares real estate's digital penetration (<1%) to other sectors like retail (14%) and used auto sales (1%). By aligning themselves with Amazon and Carvana, Opendoor suggests they are the inevitable winner of a massive, inevitable shift to digital.
Ancillary Services and Upside
Slide 28 and Slide 34 focus on the 'upside.' Slide 28 lists services like Title and Escrow, Financing, Insurance, and Warranty. Slide 34 quantifies the impact of these services, showing a path from an $11K/home contribution margin in Phoenix to a long-term target of $19K/home. They use Carvana and AutoNation as comps to show that a 50/50 split between core product margin and ancillary service margin is standard for 'trade-in' business models.
Financial Performance and Projections
Slide 30 introduces the financial overview. Slide 32 is perhaps the most important slide for skeptics: it shows that 90% of their markets are Contribution Margin (CM) positive. This is intended to prove that the business isn't just growing for growth's sake, but is fundamentally profitable at the unit level in almost every city it enters.
Slide 36 details the financing strategy. It highlights $2.4B in committed, non-recourse asset-backed facilities and a pro forma adjusted equity of $1.7B. The chart shows a significant decrease in senior debt cost from L+650 in 2016 to L+250 in 2020, demonstrating increasing confidence from lenders.
Slide 38 and Slide 40 provide the forward-looking projections. Opendoor projected a 58% revenue CAGR, reaching $9.8B by 2023. They also projected reaching a 0.1% Adjusted EBITDA margin by 2023, signaling the turn toward company-wide profitability. Slide 40 sets long-term targets of 7-9% for Total Contribution Margin and 4-6% for Adjusted EBITDA Margin.
The Transaction
Slide 45 provides the 'Transaction overview.' It confirms a pro forma enterprise value of $4.8B and a $600M PIPE raised at $10/share. It also notes that existing Opendoor shareholders would roll over 100% of their equity, owning 79.3% of the combined company. This high rollover rate is a strong signal of insider confidence.
What Opendoor Does Well
Opendoor excels at 'industrializing' a traditionally fragmented and emotional process. The deck is masterful at using data to strip away the 'magic' of real estate and replace it with a predictable, scalable manufacturing-style process. They use the right metrics (Contribution Margin, Buy Box, Market Share by Maturity) to speak the language of institutional investors. Furthermore, the comparison to Carvana is a brilliant framing device; it takes a new, scary business model (iBuying) and makes it feel familiar by comparing it to a sector (used cars) that investors already understood and valued highly at the time.
What is Missing
The deck is notably light on the risks of a housing market downturn. While it mentions 'Capital Markets' and 'Pricing' as core competencies, it doesn't explicitly model how the business would perform if home prices dropped 10-20% in a single year—a scenario that is the 'black swan' for any iBuyer. Additionally, while it mentions 'Home Ops,' it provides very little detail on the actual physical labor and supply chain management required to renovate thousands of homes simultaneously, which is often where the 'hidden' costs of this model lie.
What Founders Should Copy
The 'Comps' Strategy: If you are in a new or misunderstood category, find a successful company in a different industry with a similar business model (like Opendoor did with Carvana) to help investors anchor your valuation. · Market Maturity Graphs: Showing that your 2nd and 3rd markets are scaling faster than your 1st market is the best way to prove you have a repeatable 'playbook.' · Unit Economics Focus: In asset-heavy businesses, focus on Contribution Margin. It shows that even if the company is losing money overall due to growth and overhead, the core 'unit' of the business is profitable. · Quantifying the Pain: Don't just say the current process is 'bad.' Break down the exact costs and steps (as seen on Slide 10) to show exactly how much value you are creating or saving for the customer.
Frequently asked questions
- What is the core value proposition Opendoor presents to sellers?
- Opendoor focuses on removing the complexity and uncertainty of the traditional real estate process. According to Slide 10, the traditional process involves 12+ steps and can cost up to 12% of the transaction value. Opendoor offers a digital experience where sellers can receive a competitive offer and close on their own timeline, bypassing open houses and repair negotiations.
- How does Opendoor justify its unit economics?
- The company uses 'Contribution Margin' as a key metric. Slide 32 shows that 90% of their markets were CM positive in 1Q20, with Phoenix generating $11K per home. They argue that as markets mature and they add ancillary services (Slide 34), the contribution margin will expand from a 1Q20 level of 3.1% to a long-term target of 7-9%.
- What is the 'buy box' mentioned in the deck?
- The 'buy box' refers to the specific criteria Opendoor uses to purchase homes. Slide 24 defines this as homes priced between $100K and $750K. They claim that 87% of the 5 million annual home sales in the U.S. fall within this range, representing a $1.3T market opportunity.
- How does Opendoor compare itself to other industries?
- Slide 26 compares real estate to retail (Amazon), transportation (Uber), and used auto sales (Carvana). It points out that real estate has less than 1% online penetration, whereas retail is at 14%. This comparison is used to suggest that real estate is in the early stages of a digital transformation similar to those other sectors.
- What was the structure of the $1B capital raise?
- As detailed on Slide 45, the raise included a $600M PIPE (Private Investment in Public Equity) at $10 per share. This was led by $100M from Chamath Palihapitiya and included institutional investors like BlackRock and the Healthcare of Ontario Pension Plan (HOOPP). The deal resulted in $1.5B of pro forma cash on the balance sheet.