Penn Virginia Corporation's 2013 investor presentation serves as a technical roadmap for a public energy company pivoting its production mix. The deck focuses heavily on the Eagle Ford Shale, where the company expanded from 6,800 to 33,000 net acres in just over two years. By shifting its production from 82% natural gas in 2010 to 56% oil and liquids by late 2012, the company successfully drove realized prices per Mcfe from $31.92 to $53.48. The presentation is data-dense, utilizing geological maps, wellhead production curves, and sensitivity analyses to justify a capital-intensive drilling p…
Key takeaways
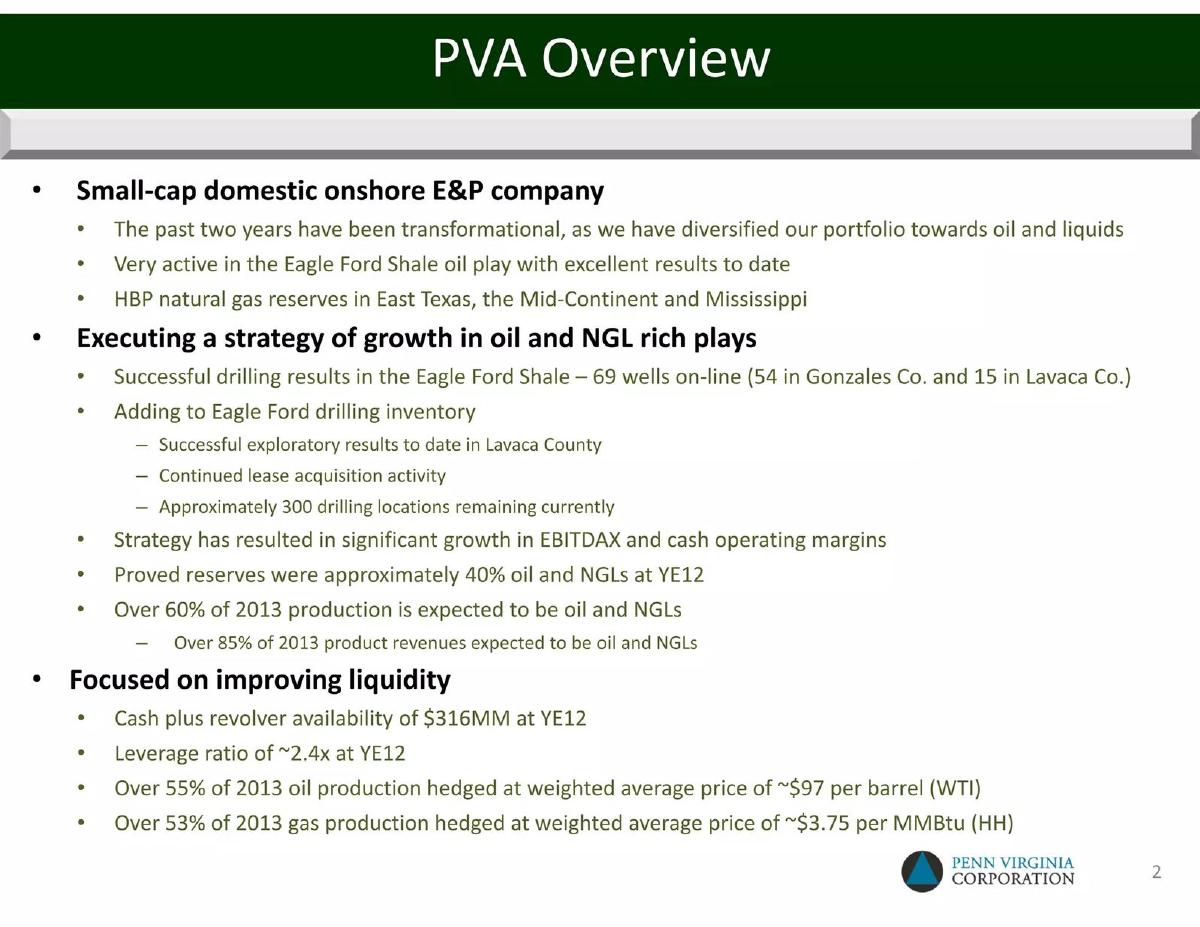
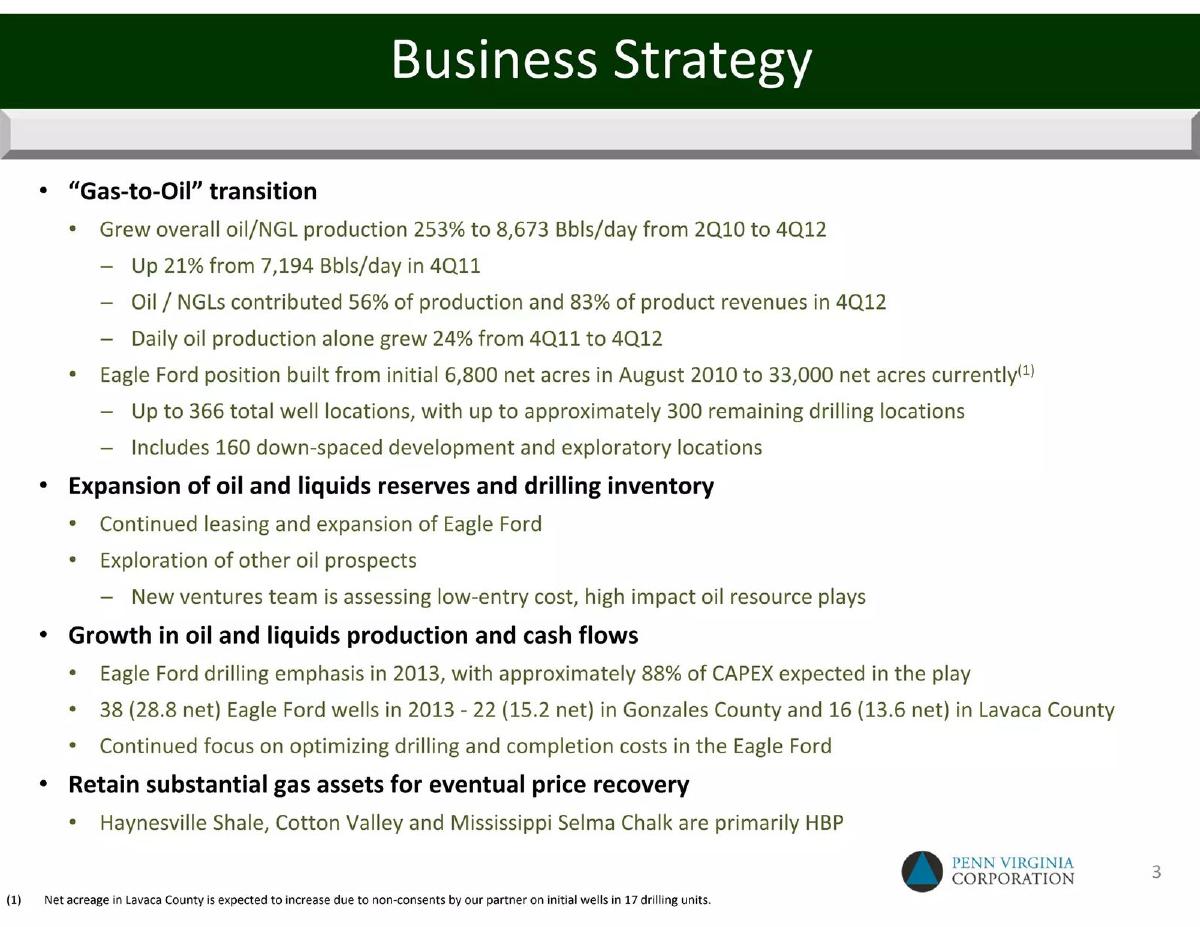
- The company executed a 'Gas-to-Oil' transition, growing oil/NGL production by 253% between 2Q10 and 4Q12 (Slide 3).
- Acreage in the Eagle Ford Shale grew significantly from 6,800 net acres in 2010 to 33,000 net acres by the time of the presentation (Slide 3).
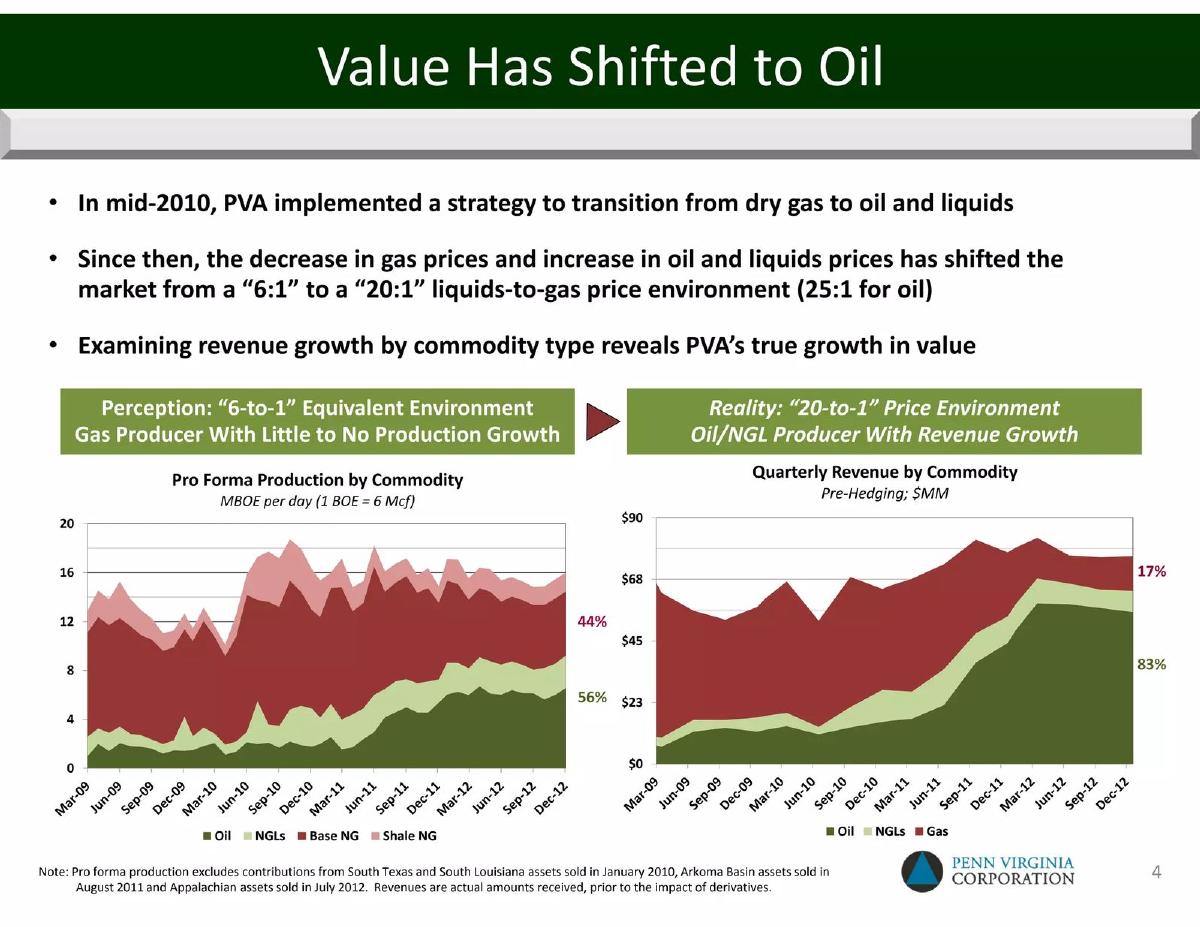
- The production mix shifted from 18% oil/condensate in FY 2010 to 56% in 4Q 2012 (Slide 6).
- Realized price per Mcfe increased from $31.92 in FY 2010 to $53.48 in 4Q 2012 due to the higher concentration of oil (Slide 6).
- Drilling and completion costs are cited at $9.1MM for Gonzales County and $10.1MM for Lavaca County (Slide 12).
- The company targets a net debt / EBITDAX ratio of less than 3.0x by year-end 2013 (Slide 15).
- Hedging strategies for 2013 included crude oil swaps and collars with weighted average floors ranging from $97 to $98 per barrel (Slide 15).
- Adjusted EBITDAX grew from $115.7 million in 2009 to $247.6 million in 2012 (Slide 21).
Overview
Penn Virginia Corporation's investor presentation for the Wells Fargo 2013 E&P Forum is a classic example of a mid-cap energy player communicating a structural pivot. The deck, dated March 7, 2013, focuses on the transition from a gas-heavy portfolio to an oil-weighted one, primarily through the development of the Eagle Ford Shale. The presentation is highly technical, aimed at institutional investors who understand oilfield economics, geological risk, and non-GAAP financial metrics like EBITDAX.
Slide 1: Title Slide
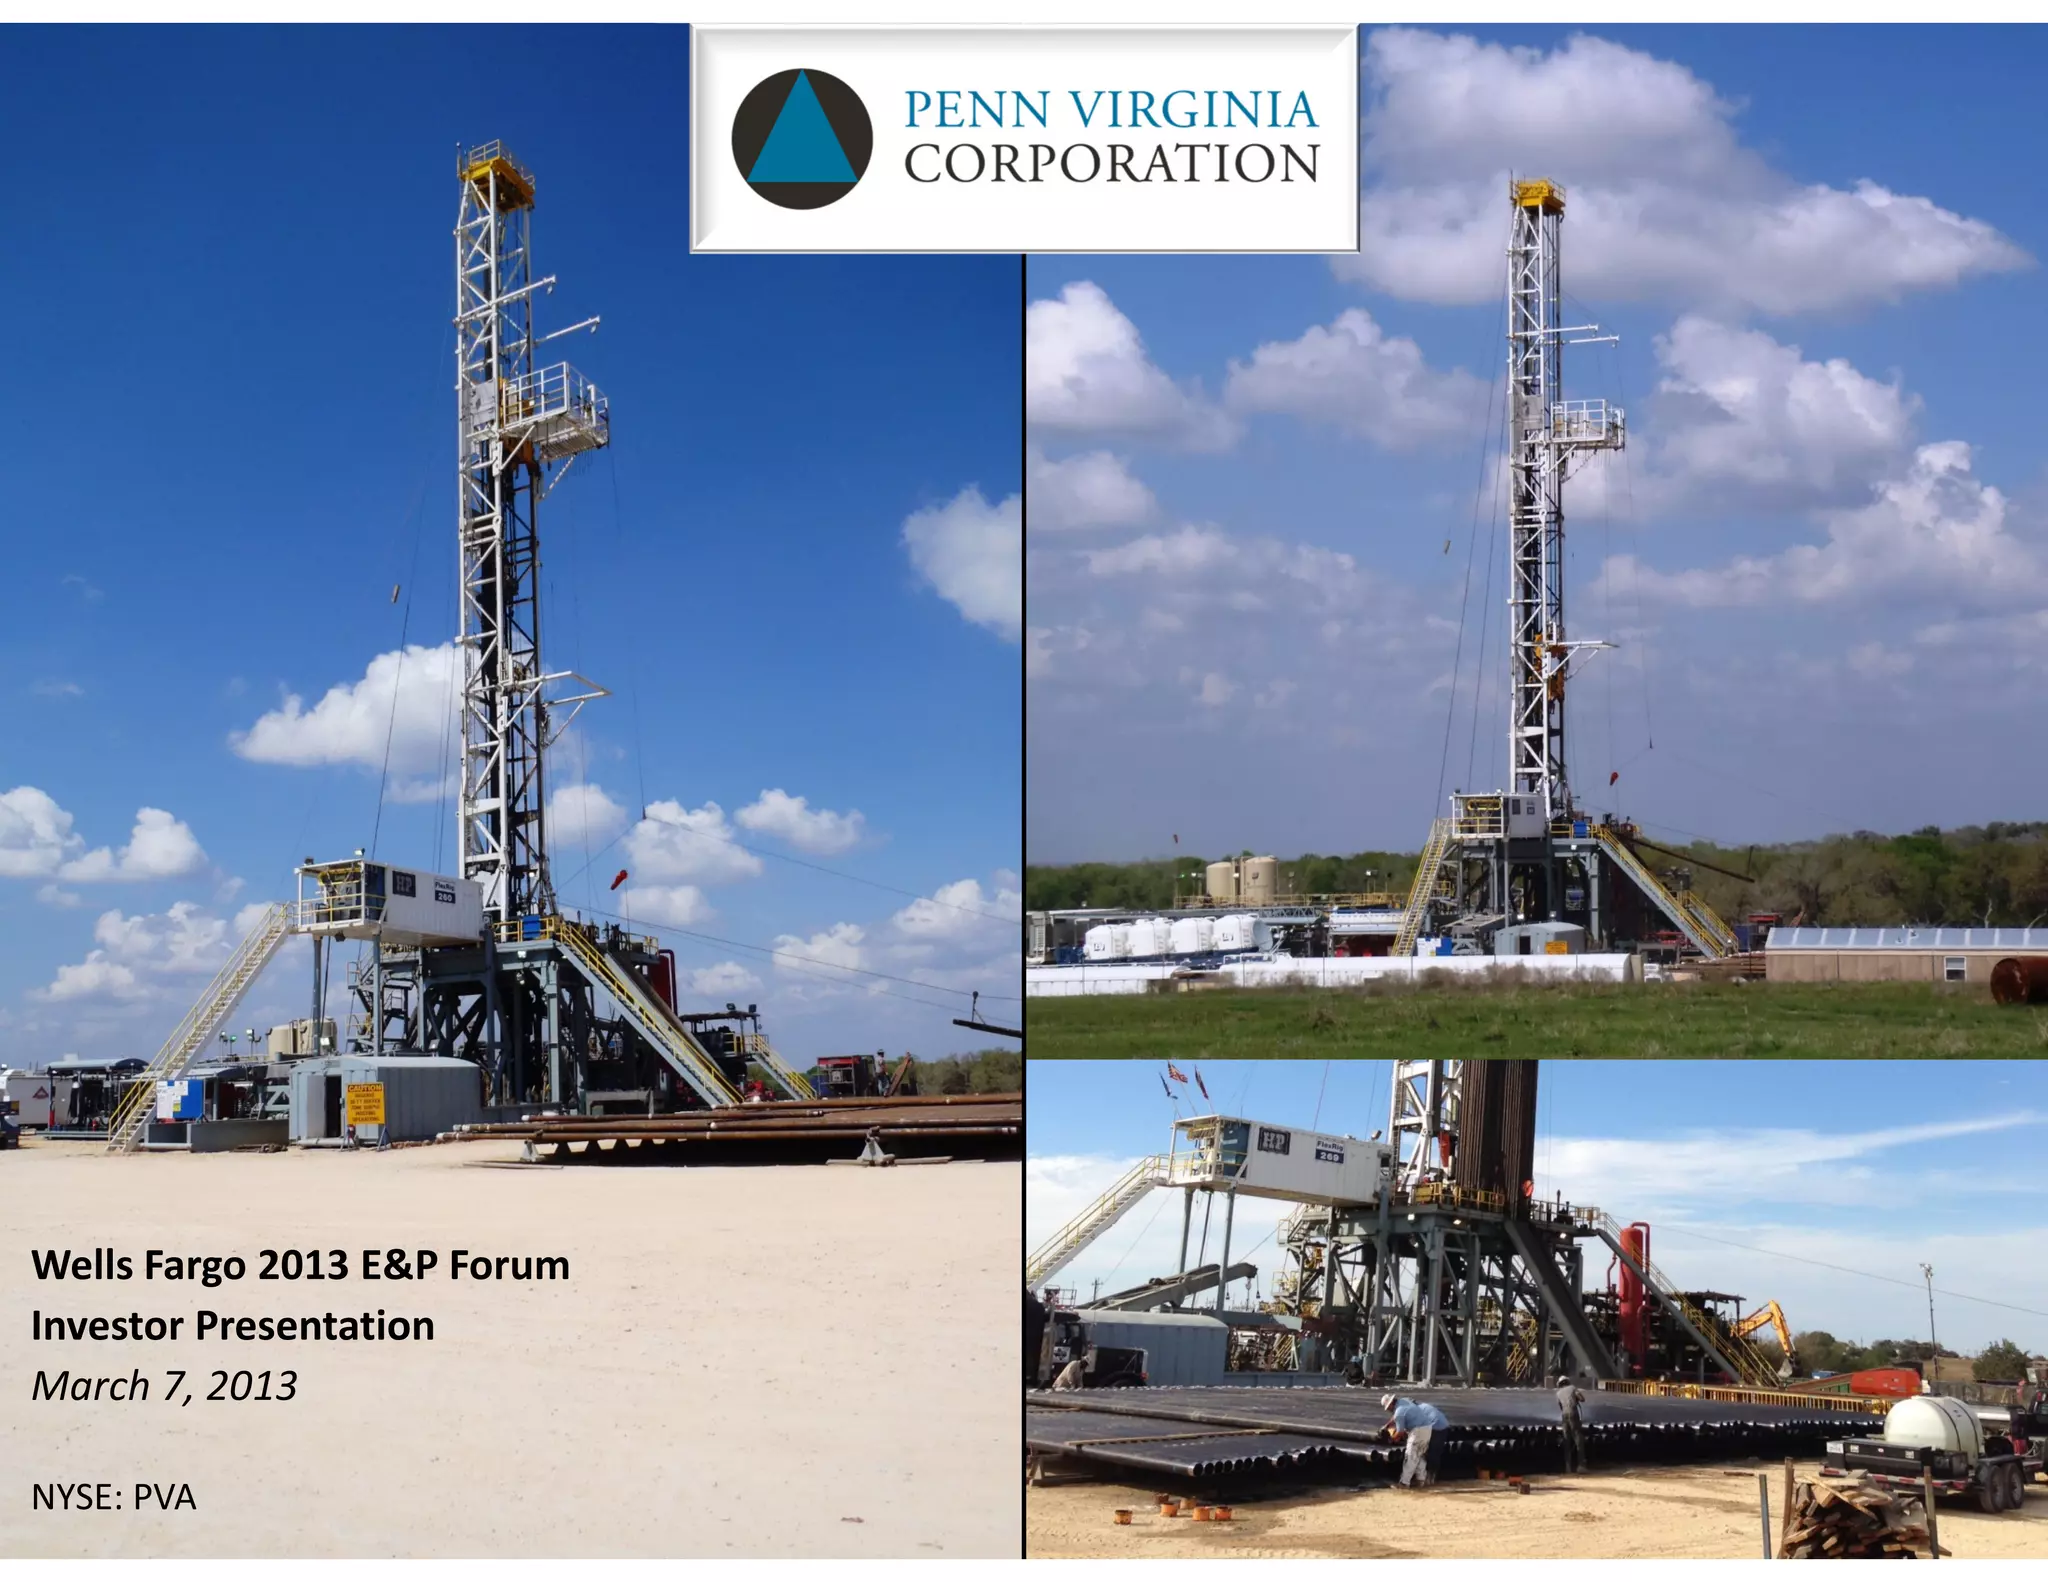
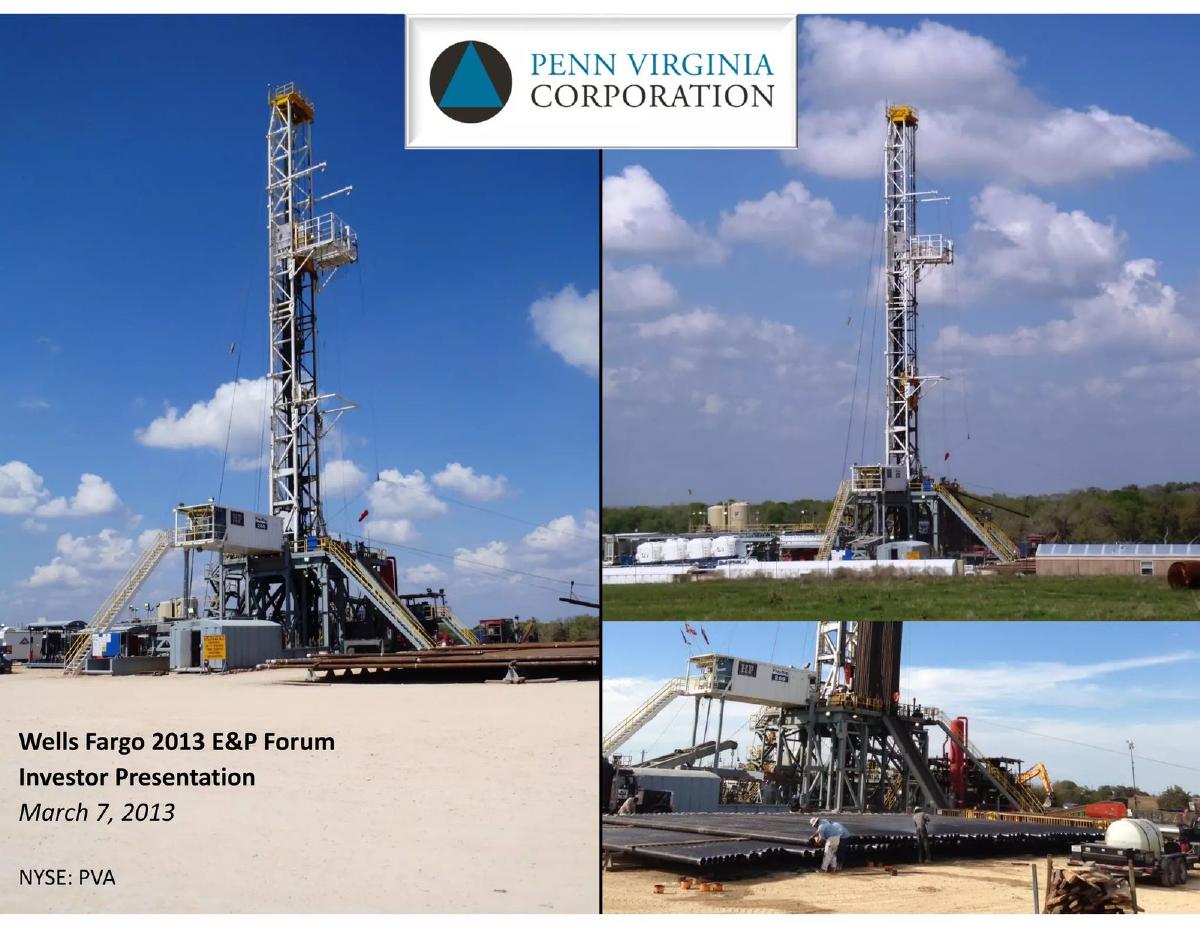
The title slide establishes the context: the Wells Fargo 2013 E&P Forum. It features three high-resolution photographs of drilling rigs and oilfield operations, emphasizing the company's active physical presence in the field. The NYSE ticker 'PVA' is clearly displayed, identifying this as a public company presentation.
Slide 3: Business Strategy
This slide outlines the core thesis of the company's current operations. The 'Gas-to-Oil' transition is the headline, supported by a 253% growth in oil/NGL production from 2Q10 to 4Q12. Key metrics include the expansion of the Eagle Ford position from 6,800 net acres to 33,000 net acres. The strategy is three-pronged: expand oil reserves, grow production/cash flows, and retain gas assets for a future price recovery. Notably, the company planned to allocate 88% of its 2013 CAPEX to the Eagle Ford play.
Slide 6: Production Mix and Operating Margins
This is one of the most critical slides for demonstrating the success of the stated strategy. Two bar charts compare FY 2010 to 4Q 2012. The first shows the production mix shifting from 82% natural gas to 56% oil and condensate. The second chart translates this shift into dollars: the realized price per Mcfe jumped from $31.92 to $53.48. The slide also breaks down the cash margin, which increased from $17.40 to $39.29, even as Lease Operating Expenses (LOE) and G&A costs fluctuated.
Slide 9: Eagle Ford Shale - Premier Acreage Position
Slide 9 provides geological and operational validation. It includes a map of the 'Volatile Oil Window' in Gonzales and Lavaca Counties, marking PVA acreage against industry results and 3-D seismic surveys. A wellhead production graph shows the decline curve for Gonzales Co. wells, comparing actual results against W&Co. and PVA forecasts. A table at the bottom lists 'Notable PVA Results' for 25 specific wells, with IP (Initial Production) rates ranging from 922 to 1,921 BOEPD.
Slide 12: Eagle Ford Shale - Compelling Economics
This slide presents the financial modeling for new wells. It separates Gonzales County and Lavaca County, listing assumptions for lateral lengths and estimated ultimate recovery (EUR). For Gonzales, the EUR is 460 MBOE with a $9.1MM cost; for Lavaca, the EUR is 590 MBOE with a $10.1MM cost. The slide uses sensitivity graphs to show the Pretax Rate of Return relative to WTI oil prices, highlighting that even at $60/bbl, the wells remain profitable, with IRRs exceeding 40% at the then-current $90/bbl price point.
Slide 15: Financial Strategy
The financial strategy slide emphasizes a 'conservative' approach. The company targets a net debt / EBITDAX ratio of less than 3.0x. The right side of the slide is dedicated to hedging. Bar charts show the volume of crude oil and natural gas production that has been hedged through 2014. For crude oil, the company had floors of $97-$98 per barrel for most of 2013, providing a safety net for their capital expenditure program.
Slide 18: Appendix Divider
A simple divider slide featuring a photo of a hydraulic fracturing site, including a large array of storage tanks and manifolds. This signals the transition from the core narrative to the supporting data and regulatory disclosures.
Slide 21: Non-GAAP Reconciliation
The final slide in the provided set is a mandatory disclosure for public companies using non-GAAP metrics. It reconciles Net Income to Adjusted EBITDAX from 2008 through 2012. This table is revealing: despite a net loss of $104.6 million in 2012, the company generated $247.6 million in Adjusted EBITDAX. The primary bridge between these figures is $206.3 million in depreciation, depletion, and amortization, and $104.5 million in asset impairments, which are non-cash accounting charges common in the energy sector.
What Penn Virginia Corporation Does Well
The deck is exceptionally strong at demonstrating a clear link between strategic intent and operational results. By placing the 'Gas-to-Oil' strategy (Slide 3) immediately before the margin expansion data (Slide 6), the management team proves they can execute a pivot. The use of specific well names and IP rates on Slide 9 adds a layer of transparency and 'ground truth' that professional energy investors require. Furthermore, the inclusion of sensitivity analysis on Slide 12 shows a sophisticated understanding of commodity price risk, demonstrating that the business model isn't just viable at $90 oil, but remains resilient at lower price points.
What is Missing
While the deck is comprehensive for a public investor update, it lacks a dedicated 'Team' slide in the provided selection. In the E&P space, the technical pedigree of the geology and engineering teams is often as important as the acreage itself. Additionally, while the deck mentions 'New ventures team is assessing low-entry cost, high impact oil resource plays' on Slide 3, it does not provide a competitive landscape analysis. There is no mention of how their acreage or cost structure compares to peers like EOG or Marathon, who were also major players in the Eagle Ford at the time. Finally, there is no explicit 'Ask' or 'Use of Proceeds' slide, as this is an investor update for an already-listed company rather than a primary capital raise deck.
What a Founder Should Copy
Founders in capital-intensive or commodity-linked industries should study Slide 6 and Slide 12. Slide 6 is a masterclass in showing how a change in product mix directly impacts the bottom line. It moves from a high-level concept (we are changing what we sell) to a granular financial outcome (this is exactly how much more we make per unit). Slide 12 is equally valuable for its use of sensitivity analysis. Instead of presenting a single 'best-case' scenario, the company shows a range of outcomes based on market variables (oil price). This builds credibility with sophisticated investors by acknowledging market volatility and showing that the company has planned for multiple economic environments.
Frequently asked questions
- What was the primary driver of Penn Virginia's strategy in 2013?
- The primary driver was a 'Gas-to-Oil' transition. As shown on Slide 3, the company focused on expanding its Eagle Ford position to increase the percentage of oil and liquids in its production mix. This was intended to capture higher realized prices and better margins compared to their legacy natural gas assets, which they opted to retain but not aggressively develop until prices recovered.
- How did the change in production mix affect the company's margins?
- The shift was highly effective for top-line growth per unit. According to Slide 6, the cash margin per Mcfe rose from $17.40 in FY 2010 to $39.29 in 4Q 2012. This was driven by the realized price increasing from $31.92 to $53.48 over the same period, directly correlating with oil increasing from 18% to 56% of total production.
- What are the specific drilling costs and returns for the Eagle Ford Shale?
- Slide 12 breaks this down by county. In Gonzales County, D&C costs were $9.1MM with an expected IRR of 40%-52%. In Lavaca County, costs were higher at $10.1MM, with IRRs between 37%-52%. Both estimates assumed a flat $90 per barrel WTI oil price and showed breakeven points between $47 and $57 per barrel.
- How did the company manage commodity price risk?
- Penn Virginia utilized an active hedging program consisting of swaps and collars. Slide 15 shows they had crude oil hedges in place for 2013 and 2014, with weighted average floors around $97-$98 for 2013. They also maintained natural gas hedges, though the volume of these appears to decrease significantly heading into 2014.
- Why is there a discrepancy between Net Income and Adjusted EBITDAX?
- As a capital-intensive E&P company, Penn Virginia had significant non-cash charges. Slide 21 shows that in 2012, while they had a net loss of $104.6 million, they added back $206.3 million in depreciation, depletion, and amortization, along with $104.5 million in impairments. These adjustments resulted in a positive Adjusted EBITDAX of $247.6 million.