Penn Virginia Corporation’s 2011 investor presentation serves as a technical roadmap for a public energy company pivoting its asset base. Facing volatile natural gas prices, PVA utilized this deck to demonstrate their aggressive expansion into the Eagle Ford Shale and Granite Wash plays. The deck is heavily data-reliant, featuring detailed well-by-well production tables, breakeven analysis by commodity price, and comparative benchmarking against six industry peers. By highlighting a 187% growth in oil/NGL production between 2Q10 and 3Q11, the company aimed to convince investors of its ability…
Key takeaways
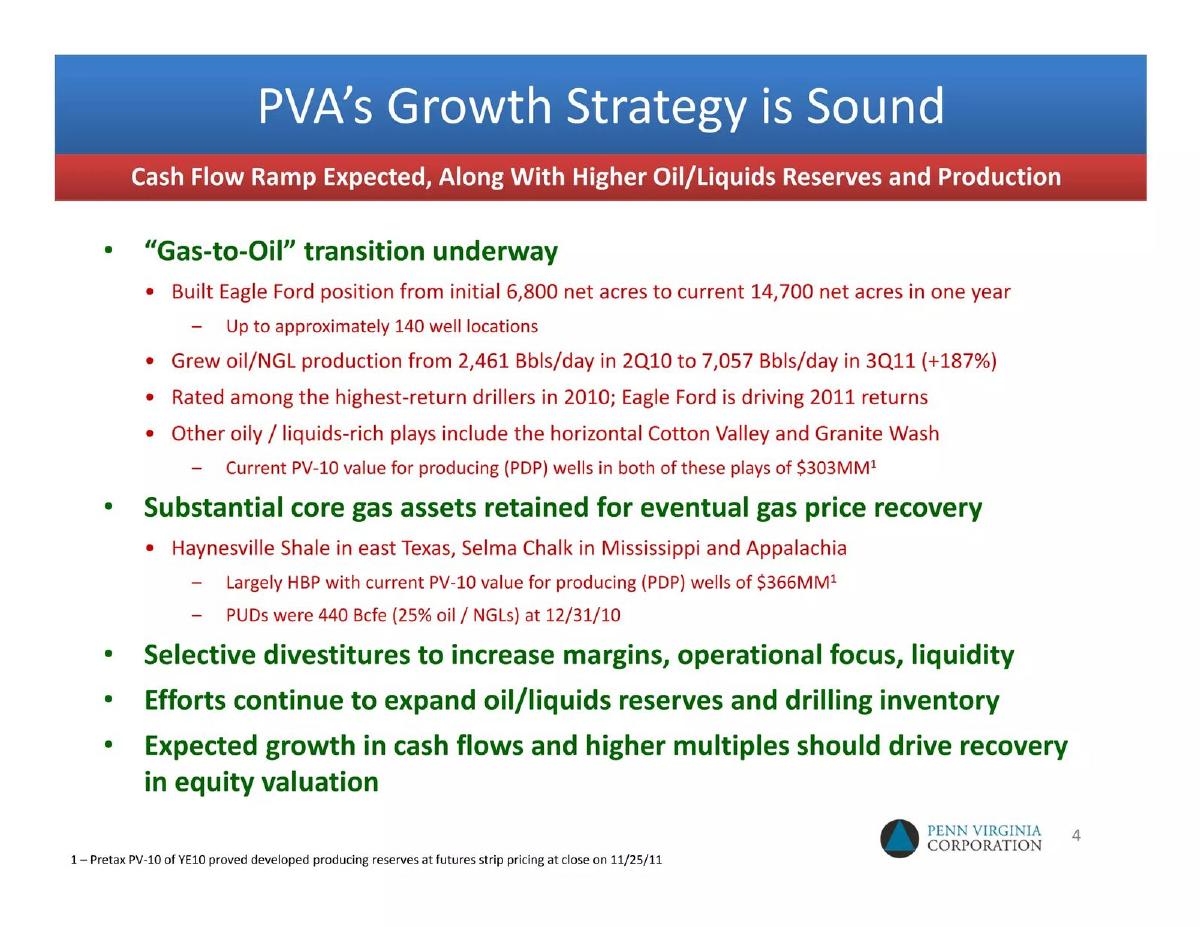
- The company executed a rapid expansion in the Eagle Ford, growing from 6,800 to 14,700 net acres in one year (Slide 4).
- Oil and NGL production increased by 187% from 2,461 Bbls/day in 2Q10 to 7,057 Bbls/day in 3Q11 (Slide 4).
- PVA projected 2012 cash flow per share (CFPS) and EBITDAX growth to outperform the majority of its six identified peers (Slide 7).
- The 2011 capital expenditure budget was set between $433MM and $443MM, with 89% allocated to oil and liquids-rich plays (Slide 10).
- Initial Eagle Ford wells showed a peak gross production rate of 1,012 BOEPD, supporting a 422 MBOE EUR type curve (Slide 13).
- Breakeven oil prices for a 10% IRR were identified as $55-66 for Eagle Ford and $31 for Granite Wash (Slide 16).
- PVA ranked 3rd in drill-bit finding and development (F&D) costs and 7th in return on drilling dollars among 38 top E&P firms in 2010 (Slide 19).
- To mitigate price risk, 38% of natural gas exposure for the remainder of 2011 was protected through swaps and collars (Slide 25).
Executive Summary and Title
Slide 1: Title Slide
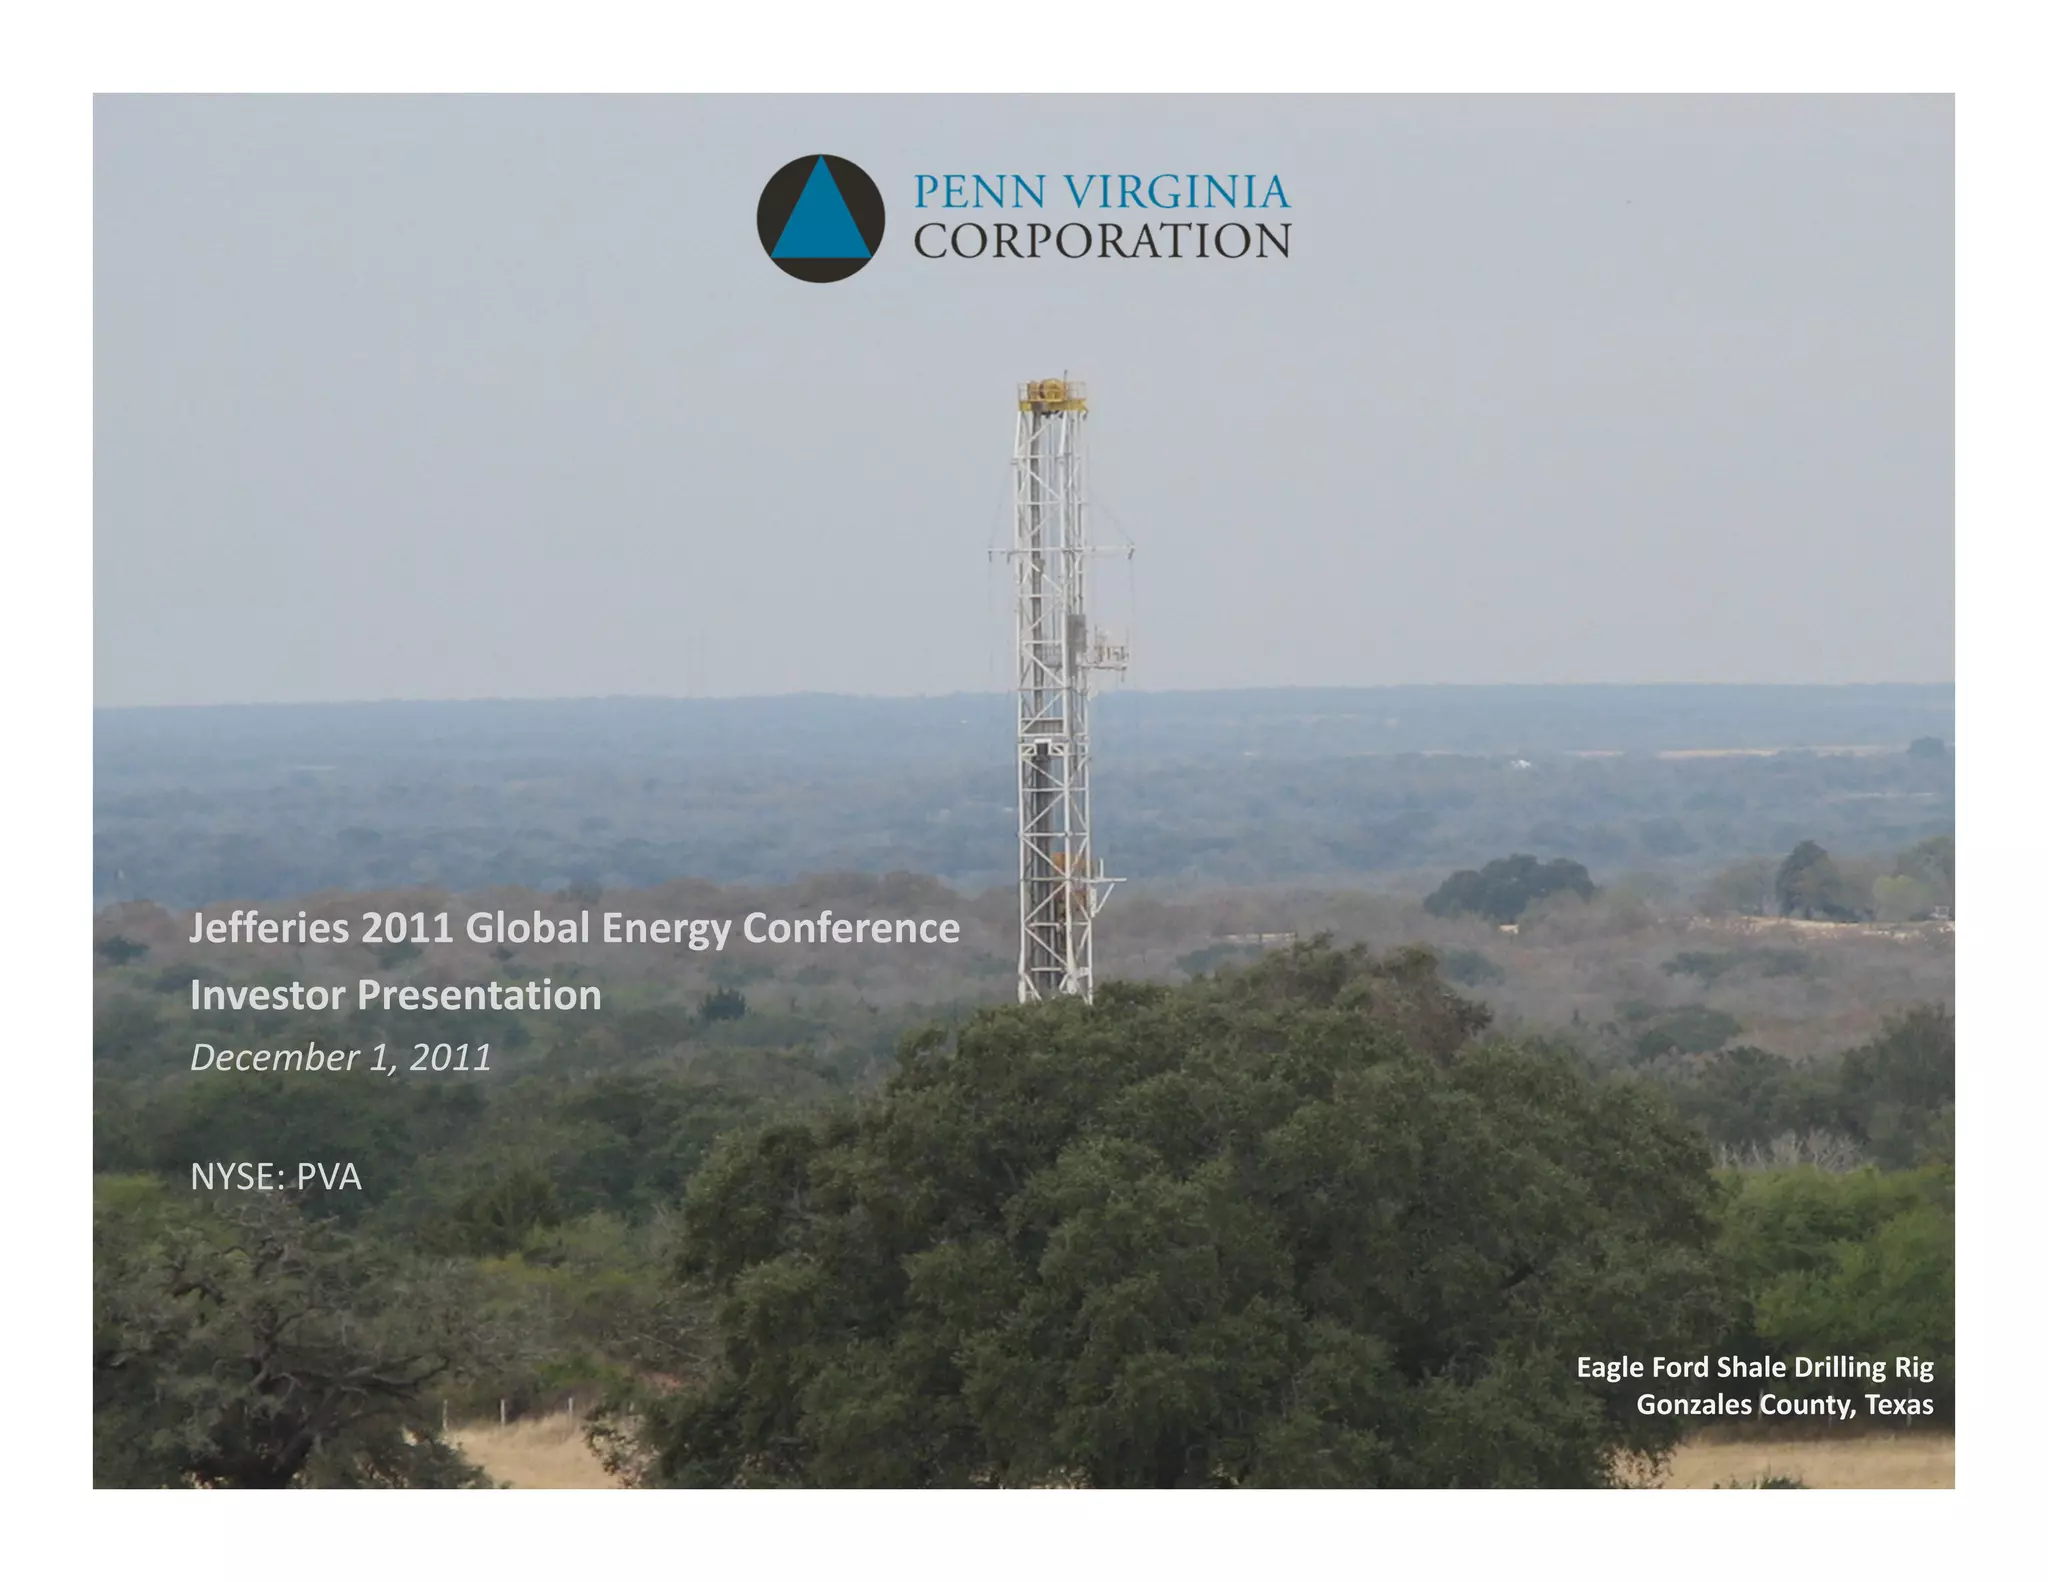
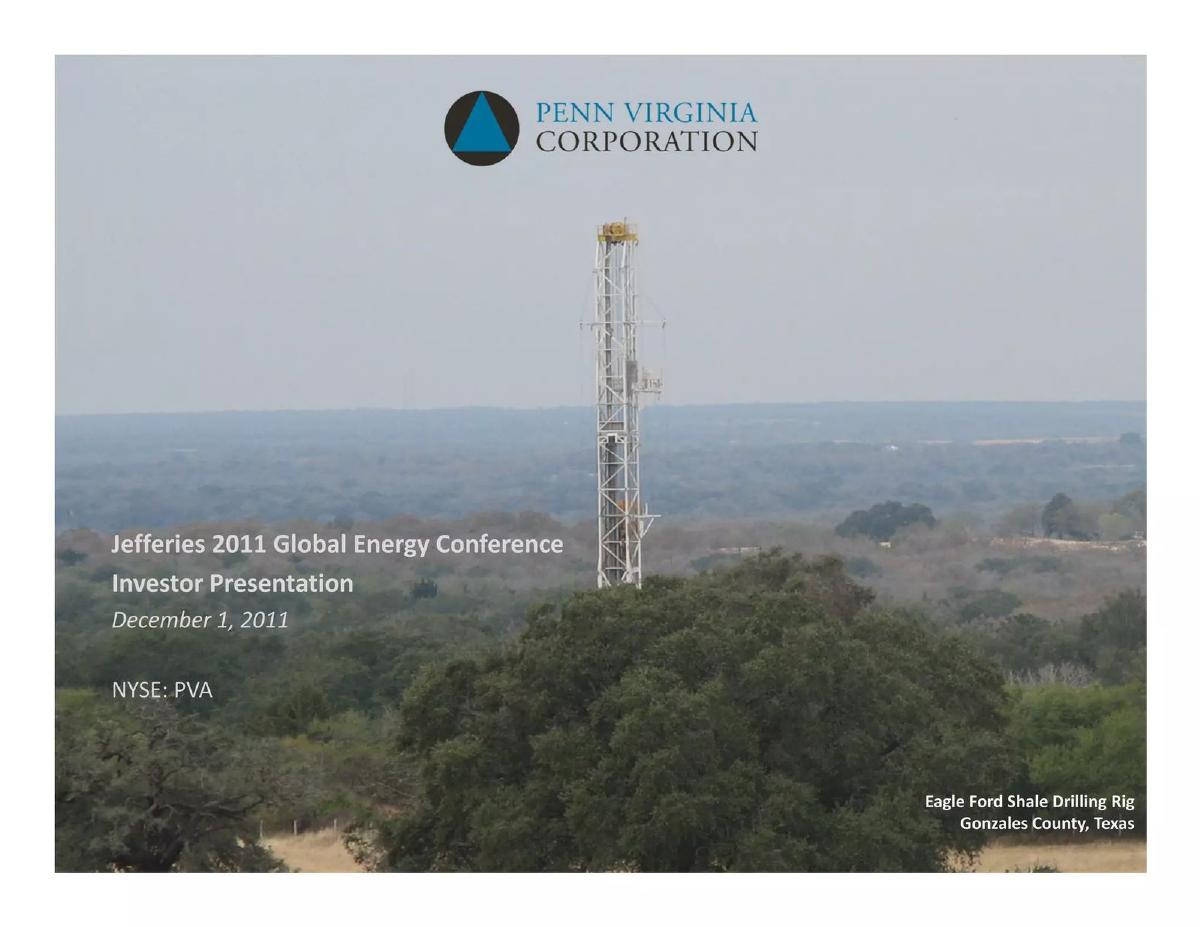
The presentation opens with a high-resolution photograph of an Eagle Ford Shale drilling rig in Gonzales County, Texas. The branding identifies the entity as Penn Virginia Corporation (NYSE: PVA). The context is established as the Jefferies 2011 Global Energy Conference, dated December 1, 2011. This slide immediately anchors the company’s identity in its most important asset at the time: the Eagle Ford.
Strategic Direction and Growth
Slide 4: PVA’s Growth Strategy is Sound
This slide serves as the executive summary of the company’s strategic pivot. It explicitly states that a "Gas-to-Oil" transition is underway. Key metrics cited include the expansion of the Eagle Ford position from 6,800 net acres to 14,700 net acres within a single year. The slide notes a 187% increase in oil/NGL production, rising from 2,461 Bbls/day in 2Q10 to 7,057 Bbls/day in 3Q11. It also mentions that core gas assets in the Haynesville Shale, Selma Chalk, and Appalachia are being retained for eventual price recovery, with a PV-10 value of $366MM for producing wells as of 11/25/11.
Slide 7: Cash Flow Growth is Expected
PVA uses this slide to benchmark its financial trajectory against six unnamed peers (identified in the footnotes as CRK, FST, GDP, GMXR, PETD, and PQ). A bar chart illustrates 2012E CFPS (Cash Flow Per Share) and EBITDAX growth. PVA projects growth near 50%, which is significantly higher than the peer median. The slide asserts that this growth is "fully-funded" and will drive additional debt capacity and liquidity through 2012.
Asset Portfolio and Operational Footprint
Slide 10: Core Operating Regions
This slide provides a geographic and financial breakdown of operations. The 2011E CAPEX is listed at $433MM to $443MM, with 89% dedicated to oil and liquids-rich plays. A map highlights operations in Texas, Oklahoma, Mississippi, and Pennsylvania. Pie charts show the shift in production and reserves: 2011E production is estimated at ~48 Bcfe, with 30% being oil and liquids (increasing to 41-42% by 4Q11). The 2010 Proved Reserves are stated as 942 Bcfe, with East Texas and Mississippi representing the largest portions at 448 Bcfe and 182 Bcfe respectively.
Slide 13: Eagle Ford Shale: Excellent Early Results
This is a highly technical slide intended for analysts. It lists 20 specific wells (e.g., Gardner #1H, Hawn Holt #1H through #15H, Munson Ranch) and provides data on lateral length, frac stages, cumulative production, and peak daily rates. The average lateral length is 4,040 feet with 16 frac stages. The average peak gross production rate is cited as 1,012 BOEPD. This data is used to validate the company’s 422 MBOE EUR (Estimated Ultimate Recovery) type curve, which is a critical metric for valuing E&P assets.
Economics and Value Creation
Slide 16: Quality Inventory of Drilling Locations
PVA presents a table of its drilling inventory across five plays: Eagle Ford Shale, Granite Wash, Horizontal Cotton Valley, Haynesville Shale, and Selma Chalk. For each play, it lists gross undrilled locations, average working interest, and breakeven prices. Notably, the Granite Wash shows a WTI breakeven oil price of $31 for a 10% IRR, while the Eagle Ford ranges from $55-66. The slide emphasizes that all core plays are economic at 2012-2013 future strip pricing.
Slide 19: Track Record of Value Creation
This slide focuses on capital efficiency. Using a JPMorgan PD F&D Survey from March 2011, PVA compares itself to 38 top E&P firms. Two bar charts show that PVA ranks 3rd in "Ex-Leasehold PD F&D" costs (at approximately $2.91/Mcfe) and 7th in "Return on Drilling Dollars." By placing PVA at the favorable ends of these distribution charts, the deck argues that the management team is superior at converting capital into productive assets compared to the broader industry.
Appendix and Risk Management
Slide 20: Appendix Title Slide
A transition slide featuring a Haynesville Shale drilling rig in Harrison County, Texas. This marks the move from the primary narrative to supporting technical data.
Slide 25: Natural Gas Hedges
To address the risk of falling natural gas prices, this slide details the company’s hedging positions. It states that 38% of natural gas price exposure is hedged for the remainder of 2011. A chart shows the weighted average floor/swap price by quarter, ranging from $5.67 in 4Q11 to $5.10 in 4Q12. This is contrasted against a "Budget Price by Quarter" of $3.75 to $4.25, demonstrating that the hedges are set well above the internal budget requirements to ensure fiscal stability.
Slide 28: Contact Information
The final slide provides the corporate address in Radnor, PA, the company website, and a phone number. The background image shows Granite Wash drilling rigs at sunset in Washita County, Oklahoma, maintaining the visual theme of active field operations.
What Works Well in This Deck
Granular Data Transparency: The inclusion of Slide 13, which lists specific well performance, is a strong move for an E&P company. It moves beyond generalities and provides the raw data that institutional investors and analysts need to build their own valuation models. Providing lateral lengths and frac stages shows a commitment to technical excellence.
Clear Strategic Pivot: The deck does not bury the lead. The "Gas-to-Oil" transition is the central theme, and every subsequent slide supports this shift. By showing the CAPEX allocation (89% to liquids) and the resulting production growth (187% increase in oil), the company demonstrates that it is executing on its stated strategy rather than just talking about it.
Third-Party Validation: Using JPMorgan survey data on Slide 19 to rank the company against 38 peers provides objective credibility. It is much more persuasive to show a third-party ranking than to simply claim to be "efficient."
What Is Missing from This Deck
Management Team Biographies: While this is a public company deck where the CEO is likely known, the absence of a team slide in this 10-slide selection (and potentially the full 28-slide deck) is a missed opportunity to highlight the technical expertise of the geologists and engineers driving the Eagle Ford success.
Environmental and Regulatory Risk: In 2011, hydraulic fracturing was under increasing scrutiny. The deck focuses entirely on economics and production without addressing the regulatory landscape or environmental safeguards, which are standard components of modern energy decks.
Detailed Use of Proceeds: While the CAPEX budget is mentioned, a more detailed breakdown of how the next $400MM+ would be spent (e.g., infrastructure vs. new well spudding) would provide more clarity on the operational roadmap.
What a Founder Should Copy
The Breakeven Table: Slide 16 is a masterclass in communicating unit economics. By showing the commodity price required to hit a 10% IRR across different assets, the company tells investors exactly what market conditions are required for them to succeed. Founders in any sector should be able to show their "breakeven" metrics with this level of clarity.
Peer Benchmarking: Slide 7 and Slide 19 show how to use peer data effectively. Instead of just showing your own growth, showing your growth relative to the competition—and identifying those competitors by name in the footnotes—creates a sense of urgency and competitive advantage.
Visual Proof of Assets: The use of actual field photography (rigs in specific counties) throughout the deck serves as a constant reminder that the company owns tangible, productive assets. For hardware or infrastructure startups, this visual grounding is essential for building trust.
Risk Mitigation Disclosure: The hedging slide (Slide 25) is a professional way to handle market volatility. It shows that the company isn't just hoping for good prices; they have a mathematical plan to protect their downside. Founders should always include a slide that addresses their primary market risk and how they are actively mitigating it.
Frequently asked questions
- What is the primary strategic goal outlined in the PVA deck?
- The primary goal is a 'Gas-to-Oil' transition. The company aimed to shift its production mix toward oil and natural gas liquids (NGLs) to capture higher margins and better equity valuation multiples. This involved focusing 89% of their 2011 CAPEX on liquids-rich plays like the Eagle Ford Shale and Granite Wash, while holding gas assets for a future price recovery.
- How does PVA justify its operational efficiency to investors?
- PVA uses third-party benchmarking from a JPMorgan survey to show they are 'best in class.' Specifically, Slide 19 highlights that they ranked 3rd out of 38 E&P firms for low finding and development (F&D) costs and 7th for return on drilling dollars. This data suggests that their technical execution is superior to the broader market.
- What specific performance metrics are provided for the Eagle Ford Shale?
- Slide 13 provides a granular table of 20 on-line wells, listing lateral lengths, frac stages, and production rates. The average peak gross production rate was 1,012 BOEPD, with a 30-day average of 688 BOEPD. These results form the basis for their 422 MBOE estimated ultimate recovery (EUR) type curve.
- How does the company address commodity price volatility?
- The company uses a hedging strategy detailed in the appendix. Slide 25 shows that 38% of their natural gas price exposure was hedged for the end of 2011 using swaps and collars. They also provide breakeven analysis on Slide 16, showing that their core plays remain economic even if oil prices drop to the $31-$66 range.
- What is the significance of the peer comparison on Slide 7?
- Slide 7 is designed to show growth potential relative to the market. It compares PVA's expected 2012 CFPS and EBITDAX growth against six competitors. By showing PVA at the top of the chart (near 50% growth), the company makes a case for being a high-growth investment compared to more stagnant peers.