The 2012 Penn Virginia Corporation (PVA) investor presentation serves as a case study in defensive corporate maneuvering within the energy sector. Facing depressed natural gas prices, the company utilized this 22-slide deck to communicate a pivot toward oil and natural gas liquids (NGLs). Key financial metrics, such as a 30% reduction in year-over-year CAPEX and a robust hedging program, were emphasized to reassure investors of liquidity. The deck relies heavily on operational data from the Eagle Ford Shale to demonstrate efficiency gains, showing a decrease in well costs alongside increased…
Key takeaways
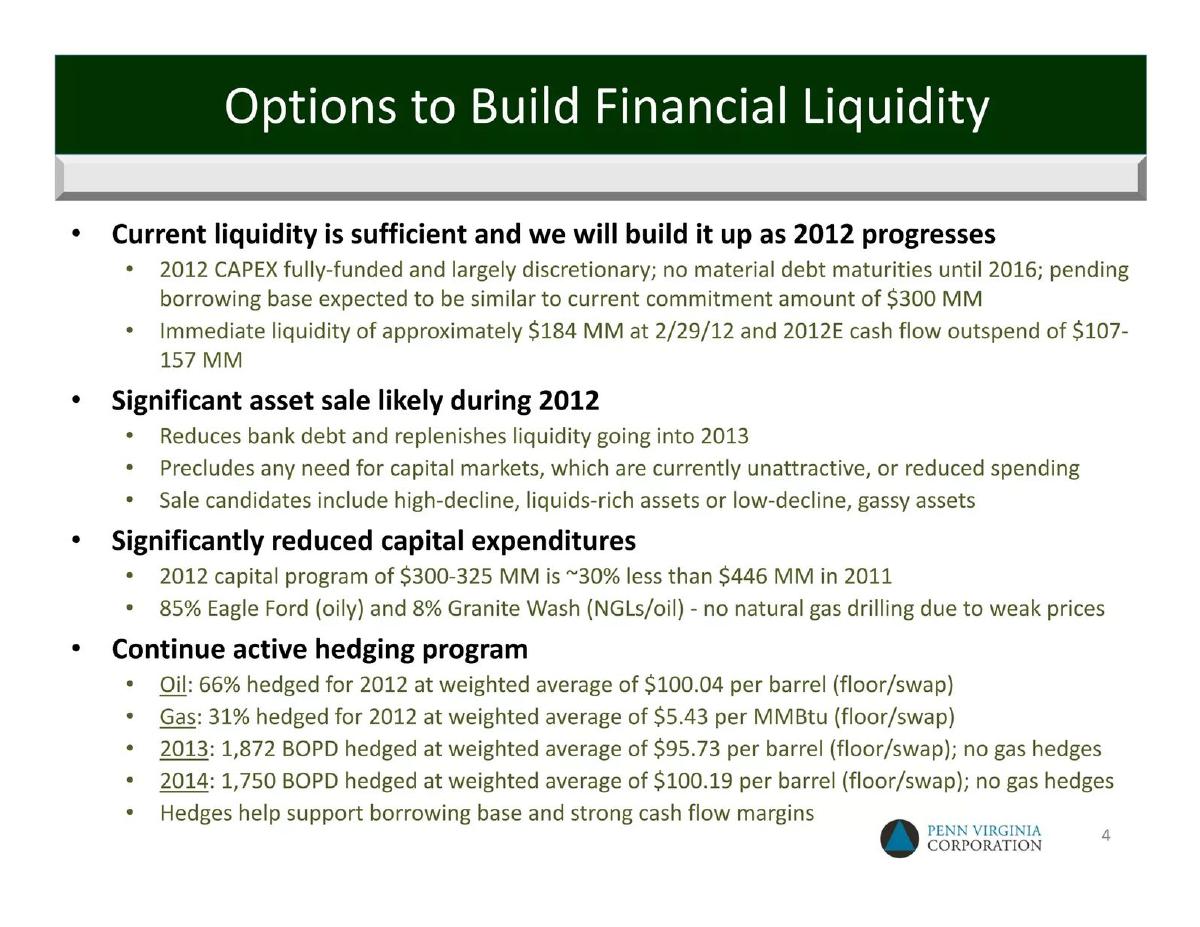
- The company planned a significant reduction in capital expenditures, dropping from $446 MM in 2011 to a projected $300-325 MM in 2012 (Slide 4).
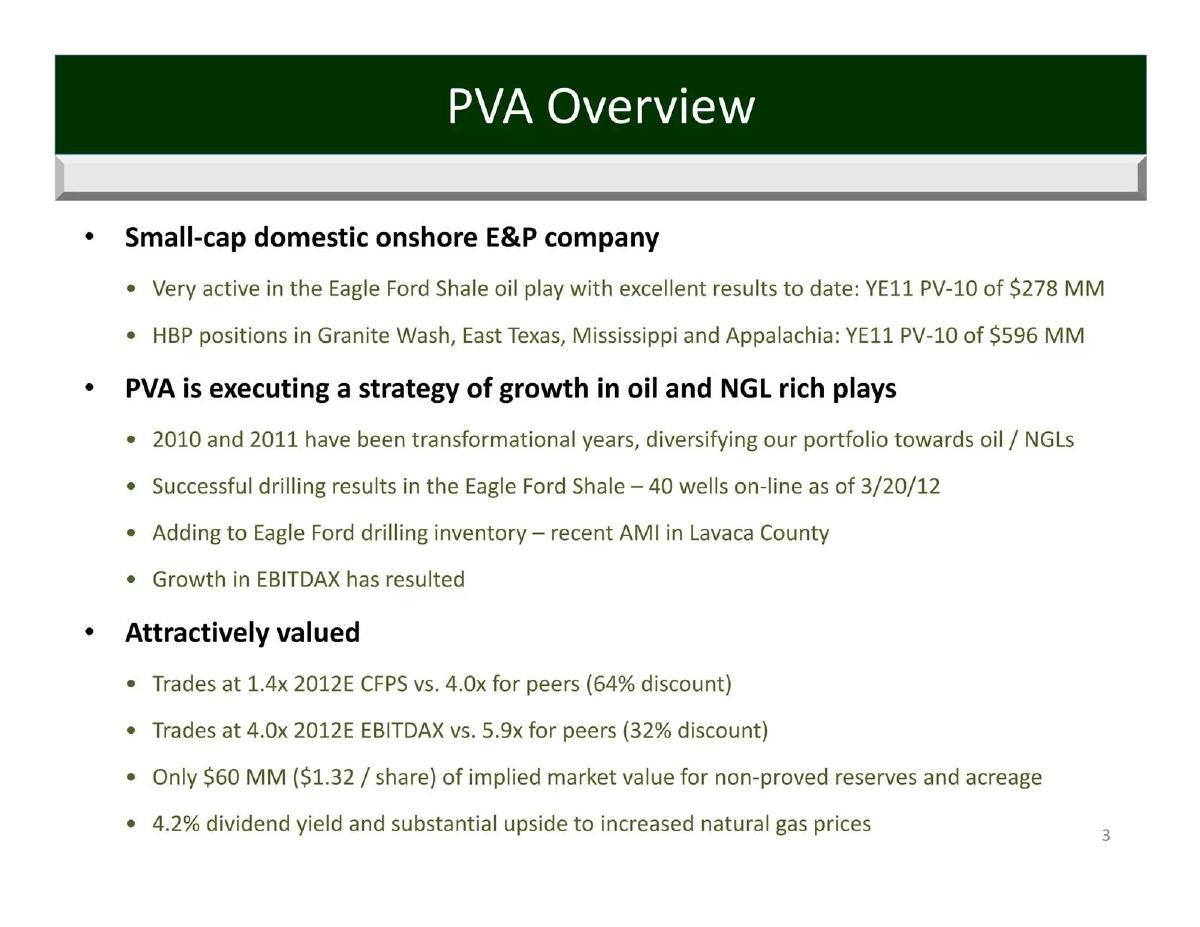
- A strategic shift toward oil and NGLs resulted in adjusted EBITDAX growth, reaching approximately $65 million in 3Q11 (Slide 7).
- PVA maintained a high level of price protection, with 66% of 2012 oil production hedged at a weighted average of $100.04 per barrel (Slide 4).
- The Eagle Ford Shale became the primary focus, accounting for approximately 85% of the 2012 capital program (Slide 10).
- Operational efficiency in the Eagle Ford was demonstrated by a reduction in average total well costs from over $10 million in 3Q11 to approximately $8 million in 4Q11 (Slide 13).
- Total proved reserves were reported at 883 Bcfe at the end of 2011, with the largest portion (261 Bcfe) located in the Cotton Valley (Slide 10).
- The company explicitly stated a cessation of drilling in dry gas plays due to oversupply, despite having hedges locked in above forecast prices (Slide 19).
- Liquidity management was a central theme, with $184 MM in immediate liquidity reported as of February 29, 2012 (Slide 4).
Introduction: A Public Company in Transition
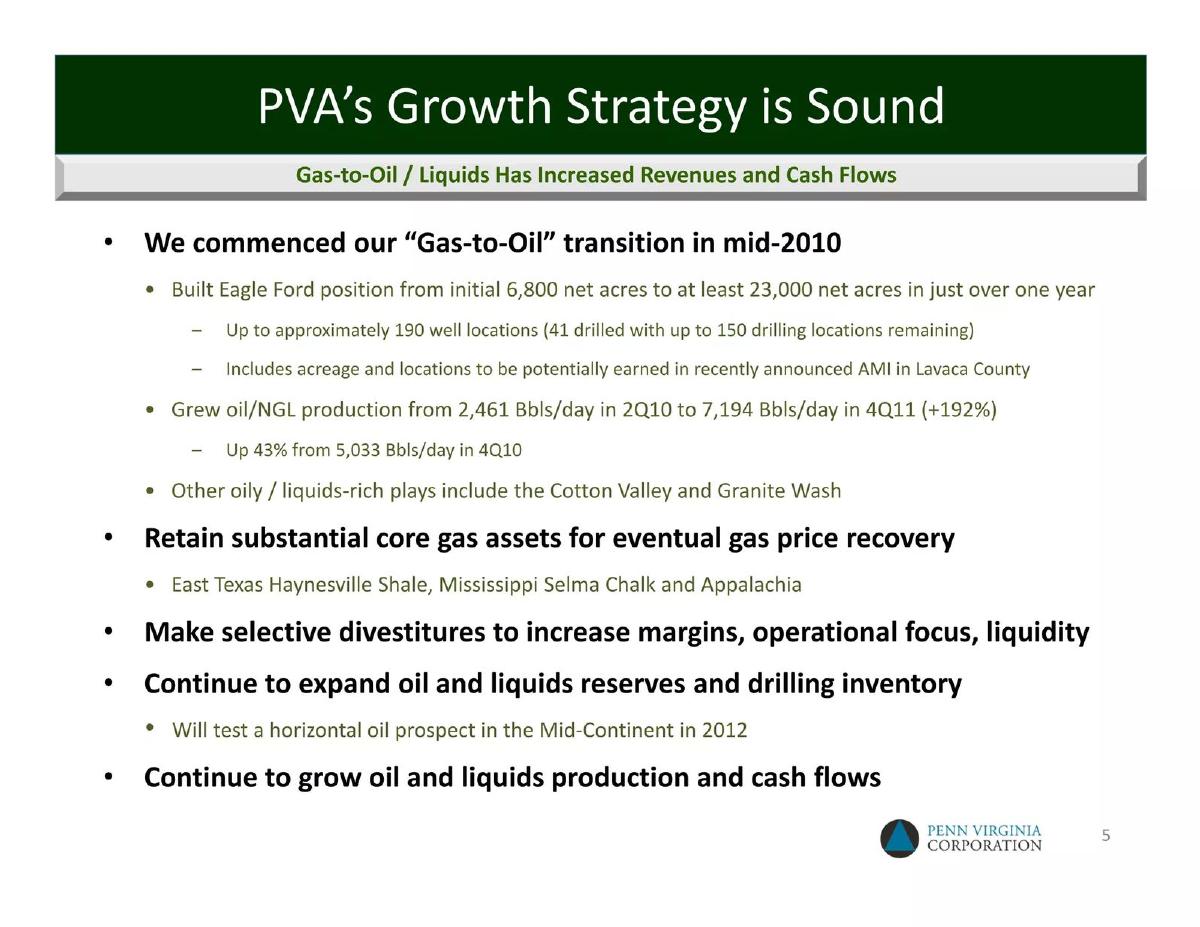
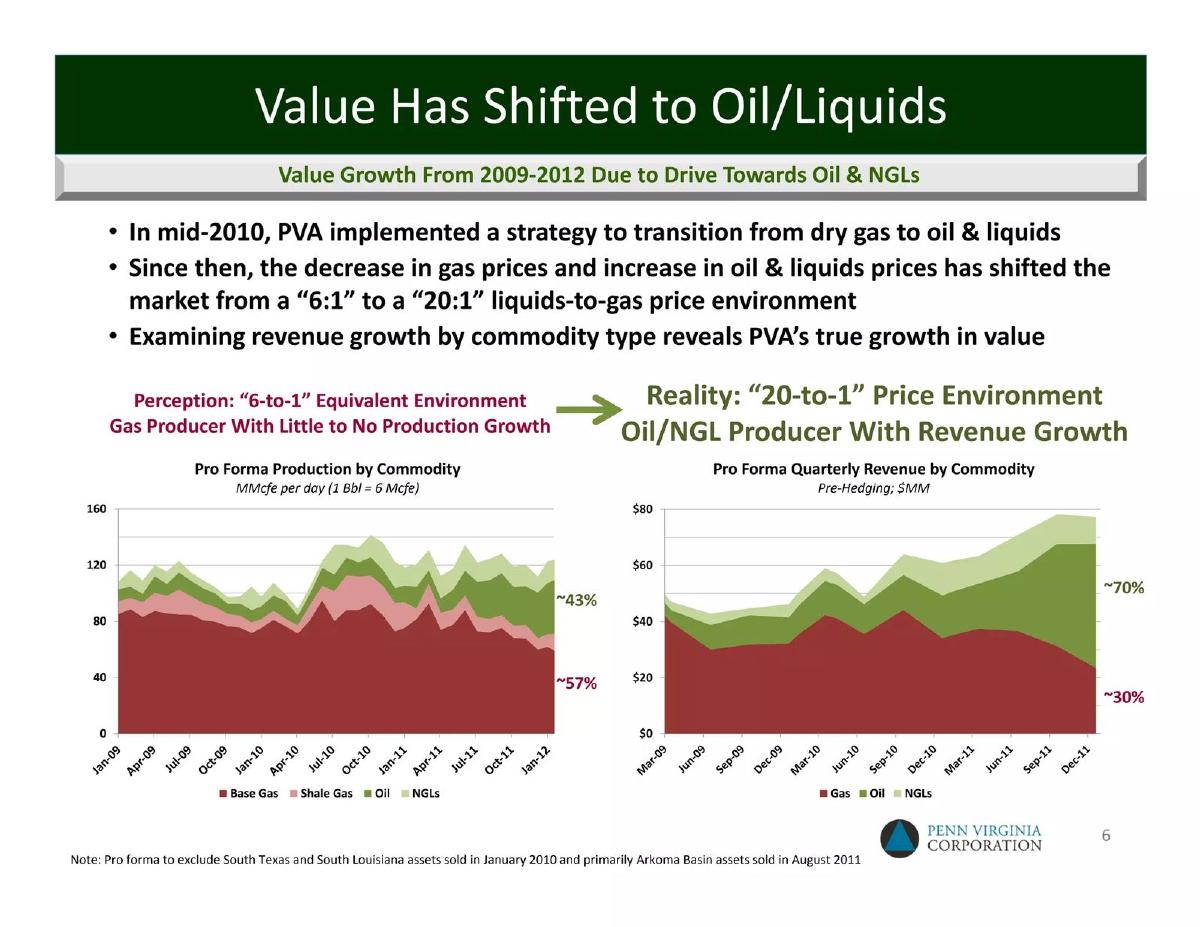
The Penn Virginia Corporation (PVA) investor presentation from March 2012 is a technical and financial roadmap for a company navigating a volatile commodity market. Unlike early-stage startup decks that focus on vision and team, this NYSE-listed company deck (Slide 1) focuses on asset optimization, balance sheet preservation, and operational efficiency. The core narrative is a pivot: moving away from natural gas, which was suffering from oversupply, and toward oil and natural gas liquids (NGLs).
Slide 1: Title and Branding
The cover slide is functional, featuring the company logo and three photographs of drilling rigs. It establishes the scale of operations and provides the essential trading information (NYSE: PVA). The date, March 21, 2012, is critical context, as this was a period of significant price divergence between oil and natural gas in North America.
Slide 4: Options to Build Financial Liquidity
This is arguably the most important slide for an investor concerned about solvency. PVA outlines a clear defensive strategy. They state that current liquidity is sufficient, citing $184 MM available as of February 29, 2012. The slide lists three primary levers: asset sales, CAPEX reduction, and hedging. Specifically, they note a 30% reduction in the capital program compared to 2011 ($300-325 MM vs $446 MM). The hedging data is granular, showing 66% of 2012 oil hedged at $100.04 per barrel, providing a floor for revenue despite market fluctuations.
Slide 7: EBITDAX and Cash Margin Growth
PVA uses this slide to prove that their strategic shift is working. The bar chart shows Quarterly EBITDAX (Earnings Before Interest, Taxes, Depreciation, Amortization, and Exploration expenses) growing from approximately $45 million in 1Q10 to over $60 million in 4Q11. The line graph overlaying the bars shows the Gross Operating Margin per Mcfe (thousand cubic feet equivalent) rising from under $3 in 2Q10 to over $5 in 4Q11. This visualizes the direct correlation between their 'Oil/Liquids Strategy' and improved profitability.
Slide 10: Core Operating Regions
This slide provides a geographic and asset-class breakdown. It uses a map of the United States (focusing on Texas, Pennsylvania, and Mississippi) to categorize plays into Oil/Liquids, Wet Gas, and Dry Gas. The slide reiterates the 2012 CAPEX focus: 85% of the budget is allocated to the Eagle Ford Shale. Two pie charts compare 2012E Production (41.5 Bcfe) against 2011 Proved Reserves (883 Bcfe). This highlights a mismatch: while the Eagle Ford is the growth engine, the bulk of the company's legacy reserves remain in gas-heavy regions like Cotton Valley and Selma Chalk.
Slide 13: Eagle Ford Shale Performance
Focusing on their primary growth asset, this slide presents two key charts. The 'Sales Volumes by Commodity' chart shows a massive ramp-up in production, particularly in net oil sales (represented in green). The second chart, '2H11 Drilling & Completion Costs,' is a classic efficiency play. It shows total well costs dropping from roughly $10.5 million in 3Q11 to $8 million in 4Q11. The company attributes this to 'drilling efficiencies and altered completion design,' which is a standard industry way of saying they learned how to drill faster and cheaper as they gained experience in the field.
Slide 18: Appendix Transition
A simple transition slide featuring a high-resolution image of a drilling rig. In a 22-slide deck, moving to the appendix at this stage suggests the core narrative has been established, and the remaining slides will provide supporting technical data.
Slide 19: Natural Gas Hedges
This slide addresses the 'elephant in the room': the depressed natural gas market. PVA shows that they have locked in prices well above the forecast. A bar chart compares their 'Weighted Average Floor / Swap Price' (ranging from $5.10 to $5.70 per MMBtu) against a 'Forecast Price' that dips toward $3.00. Despite these favorable hedges, the company explicitly states they are 'not drilling dry gas plays' because the commodity remains oversupplied. This demonstrates disciplined capital allocation—choosing not to chase production even when hedged, in favor of higher-return oil assets.
Slide 22: Contact Information
The final slide provides the corporate address in Radnor, PA, a phone number, and the company website. It is set against a backdrop of a drilling rig obscured by trees, maintaining the industrial theme of the presentation.
What PVA Does Well
The deck is exceptionally transparent regarding financial risk and mitigation. By listing specific hedge prices and floor values (Slide 4 and 19), PVA gives investors a clear way to model the company's downside protection. The use of 'EBITDAX' is appropriate for the sector, and the clear link between the strategic pivot and margin expansion (Slide 7) creates a compelling narrative of a management team reacting effectively to market conditions. The operational data on Slide 13 is also strong, providing concrete evidence of 'learning curve' benefits in their most important asset, the Eagle Ford Shale.
What is Missing
From the provided slides, there is a notable absence of a 'Team' or 'Management' slide. While this is common in quarterly investor updates for public companies, a teardown of a fundraising deck usually looks for the human element. Furthermore, there is no explicit 'Competitor' analysis. While they mention the broader commodity market, they do not compare their cost per well or flow rates against other operators in the Eagle Ford or Granite Wash. Finally, the deck lacks a long-term vision beyond 2012; it is very much a 'survive and pivot' document focused on the immediate fiscal year.
Founder Takeaways
Founders in capital-intensive industries should study Slide 4. It doesn't just say 'we need money'; it lists the 'Options to Build Financial Liquidity.' This shows a proactive approach to balance sheet management that doesn't rely solely on external investors. Additionally, the way PVA uses Slide 13 to show costs going down while volume goes up is the 'holy grail' of operational slides. If you can prove that you are getting more efficient as you scale, you significantly de-risk the investment. Lastly, the discipline shown on Slide 19—refusing to invest in a low-return area despite having hedges—is a lesson in avoiding the 'sunk cost' fallacy and staying focused on the highest-margin opportunities.
Frequently asked questions
- What was the primary reason for PVA's strategic shift in 2012?
- The primary driver was the depressed price environment for natural gas due to oversupply. As shown on Slide 19, the company ceased drilling in dry gas plays despite having favorable hedges. They pivoted toward 'liquids-rich' plays like the Eagle Ford Shale, where oil and NGL prices offered better margins and higher returns on capital compared to dry gas.
- How did PVA manage its financial risk during this period?
- PVA utilized an aggressive hedging program and CAPEX reduction. According to Slide 4, they hedged 66% of their 2012 oil at $100.04/bbl and 31% of their gas at $5.43/MMBtu. Additionally, they cut their capital program by approximately 30% compared to 2011 levels to preserve liquidity and avoid the need for unattractive capital market raises.
- What specific operational improvements were highlighted in the Eagle Ford Shale?
- Slide 13 details significant cost efficiencies. Between 3Q11 and 4Q11, the average total well cost dropped from over $10 million to roughly $8 million. This was attributed to drilling efficiencies and altered completion designs. During the same period, sales volumes ramped up significantly, moving from near zero in 1Q11 to over 500 MBOE (projected) by early 2012.
- What did the company's reserve profile look like at the time of this presentation?
- As of year-end 2011, PVA reported 883 Bcfe of proved reserves. Slide 10 breaks this down geographically: Cotton Valley held the most at 261 Bcfe, followed by Selma Chalk at 170 Bcfe and Haynesville at 147 Bcfe. Notably, the Eagle Ford, despite being the growth engine, only accounted for 60 Bcfe of proved reserves at that time.
- What were the company's options for building further liquidity?
- Slide 4 outlines three main pillars: maintaining a $300 MM borrowing base, pursuing significant asset sales of high-decline or non-core gassy assets, and reducing capital expenditures. The company aimed to fund its 2012 CAPEX entirely through internal cash flow and asset sales, precluding the need for new equity or debt issuances in a difficult market.