The Frank acquisition deck is a masterclass in presenting a 'distribution-first' thesis to a legacy financial institution. The deck centers on a single, massive figure: 4.25 million students. By positioning this user base as a low-cost acquisition engine for high-value financial products, Frank successfully pitched itself as a strategic shortcut for JP Morgan to capture the Gen Z market. However, the simplicity of the deck—omitting team backgrounds, detailed unit economics, and technical infrastructure—served to keep the focus entirely on the scale of the data. Following the $175M acquisition…
Key takeaways
- The deck leans heavily on a total user count of 4.25 million students to justify its strategic value (Slide 1).
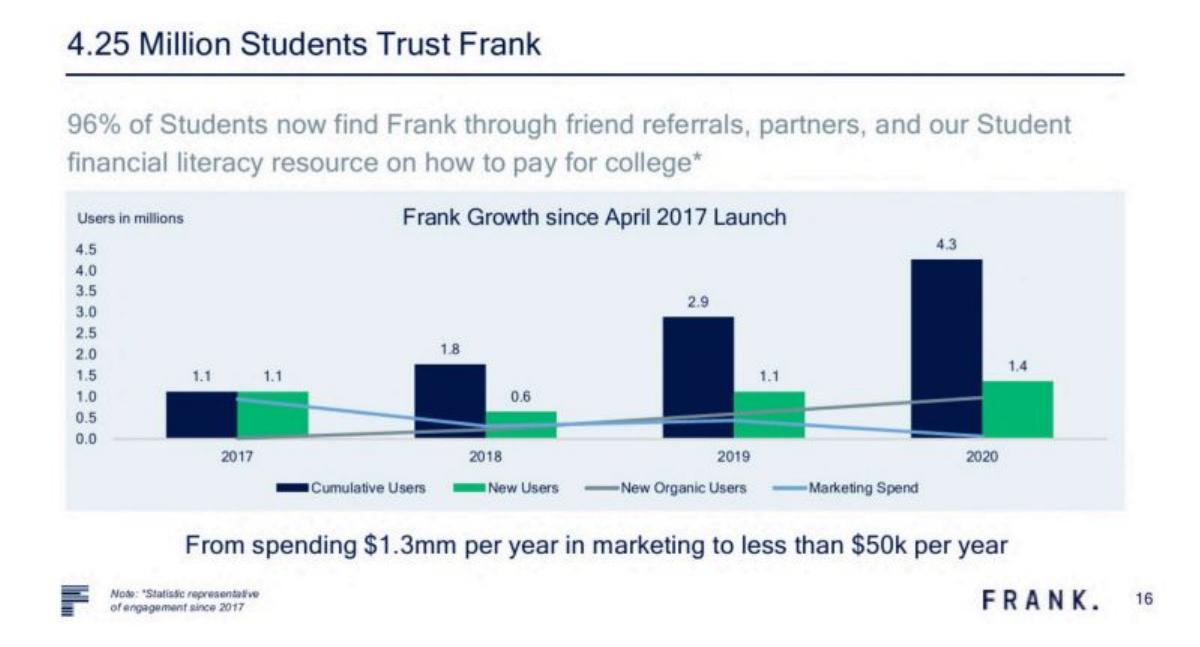
- Frank claimed a significant reduction in marketing spend, dropping from $1.3mm per year to less than $50k per year while increasing new users (Slide 2).
- The core value proposition was an acquisition cost of under $5 per student, specifically targeting the FAFSA application process (Slide 1).
- The startup positioned itself as a 'centralized suite' that handles KYC and onboarding in one click after a FAFSA filing (Slide 1).
- Frank listed an enterprise customer pipeline including 800+ colleges and 30 Fortune 500 employers (Slide 4).
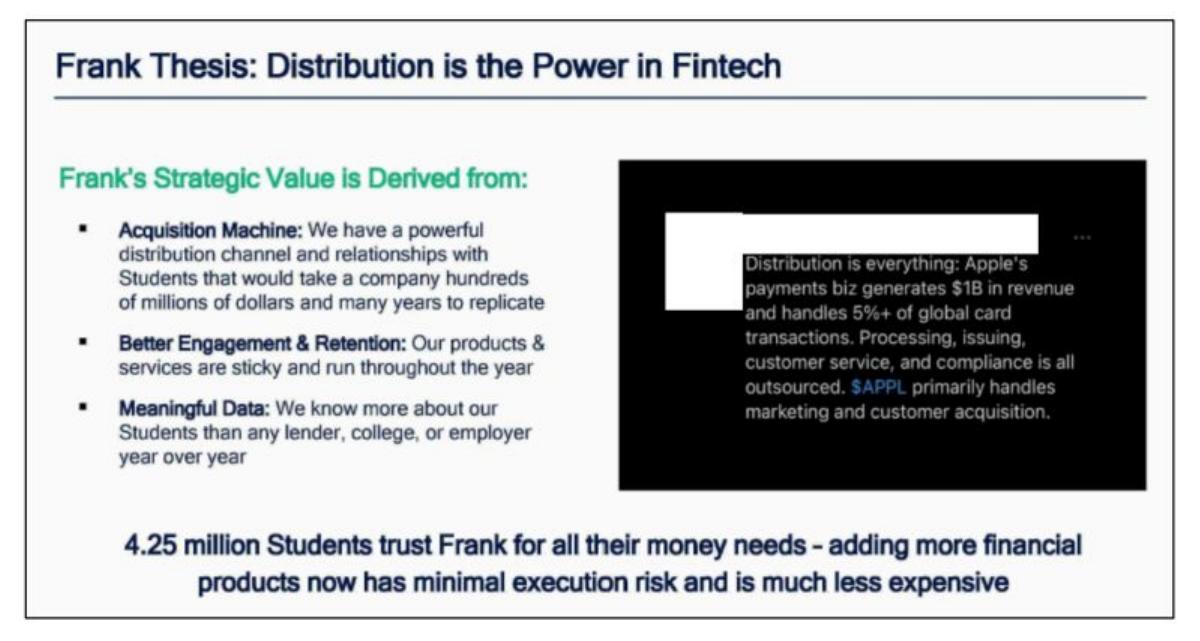
- The deck uses a comparison to Apple's payment business to argue that distribution is more valuable than the underlying financial processing (Slide 5).
- There is a complete absence of a team slide, financial projections, or a breakdown of active vs. registered users.
- The product claims to allow students to apply for financial aid in under 7 minutes (Slide 7).
The Strategic Illusion of Scale
The JP Morgan × Frank acquisition deck is a unique artifact in the fintech world. Unlike a standard Series A or B deck designed to raise capital for operations, this deck was built to sell a vision of instant market dominance to a legacy incumbent. The narrative is simple: Frank has the students, and JP Morgan has the products. By merging the two, the bank could theoretically bypass the expensive and slow process of building a brand for Gen Z.
However, looking at these slides through the lens of the subsequent SEC fraud charges, the deck becomes a study in how 'vanity metrics' can be used to obscure a lack of fundamental substance. The repetition of the 4.25 million user figure acts as a hypnotic anchor for the entire presentation.
Slide 1: The Frank Solution
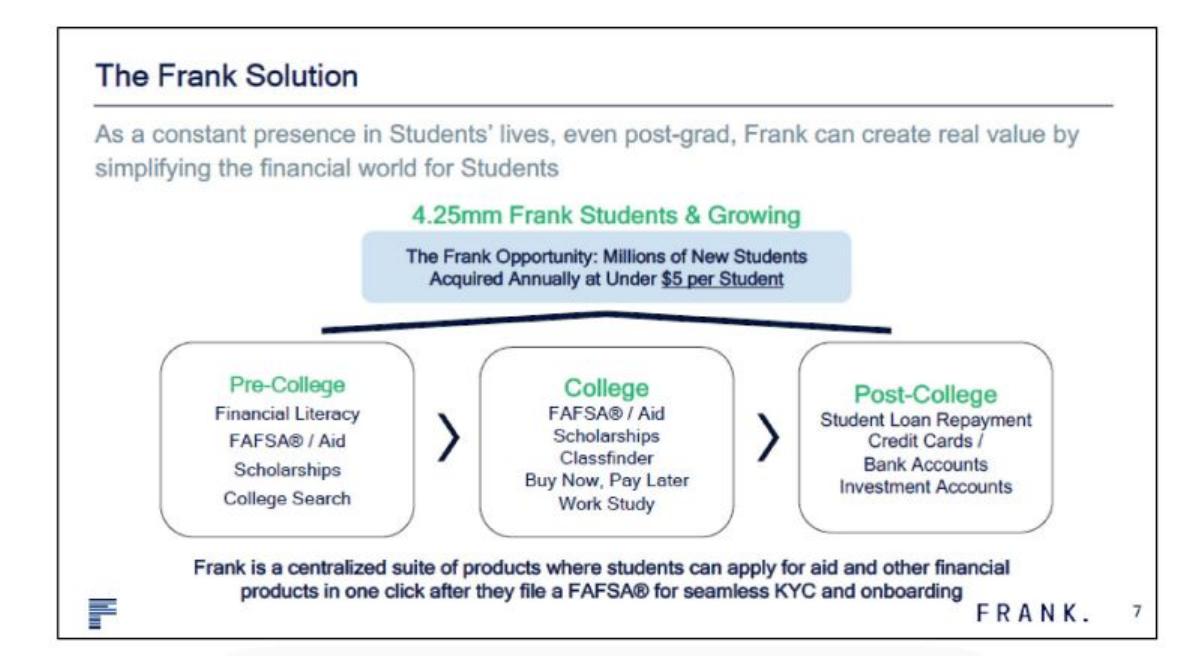
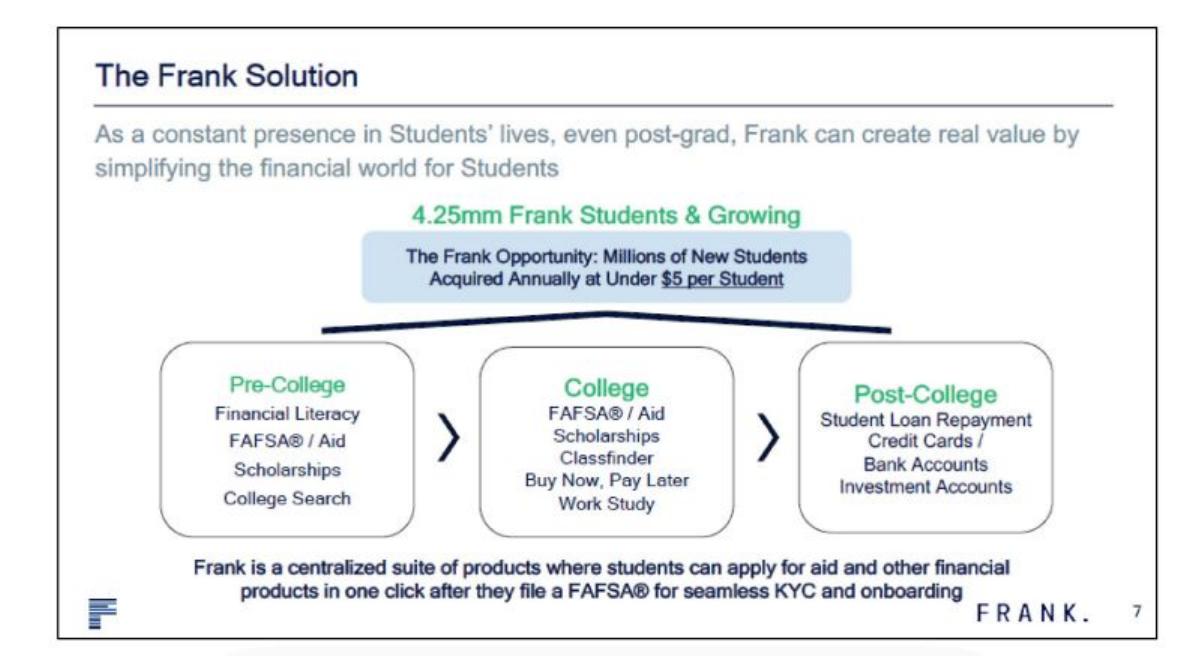
Slide 1 introduces the core thesis of the company. It positions Frank as a 'constant presence' in a student's life, moving from pre-college to post-grad. The most prominent figure on the slide is 4.25mm Frank Students & Growing . Below this, a blue box highlights the 'Frank Opportunity': acquiring millions of new students annually at under $5 per student .
The slide breaks down the product lifecycle into three stages: Pre-College (Financial Literacy, FAFSA, Scholarships), College (Classfinder, BNPL, Work Study), and Post-College (Loan Repayment, Credit Cards, Investment Accounts). The bottom text emphasizes that Frank is a 'centralized suite' where students can apply for aid in 'one click' after filing a FAFSA, which supposedly provides 'seamless KYC and onboarding.'
Slide 2: User Trust and Growth Trajectory
Slide 2 is titled 4.25 Million Students Trust Frank . It claims that 96% of Students find the platform through referrals and organic resources. The bar chart shows 'Cumulative Users' growing from 1.1 million in 2017 to 4.3 million in 2020. The most aggressive claim on this slide is the text at the bottom: 'From spending $1.3mm per year in marketing to less than $50k per year.' This suggests a viral coefficient that is almost unheard of in the fintech space, where customer acquisition costs (CAC) typically trend upward as a company scales.
Slide 3: Growth vs. Spend Correlation
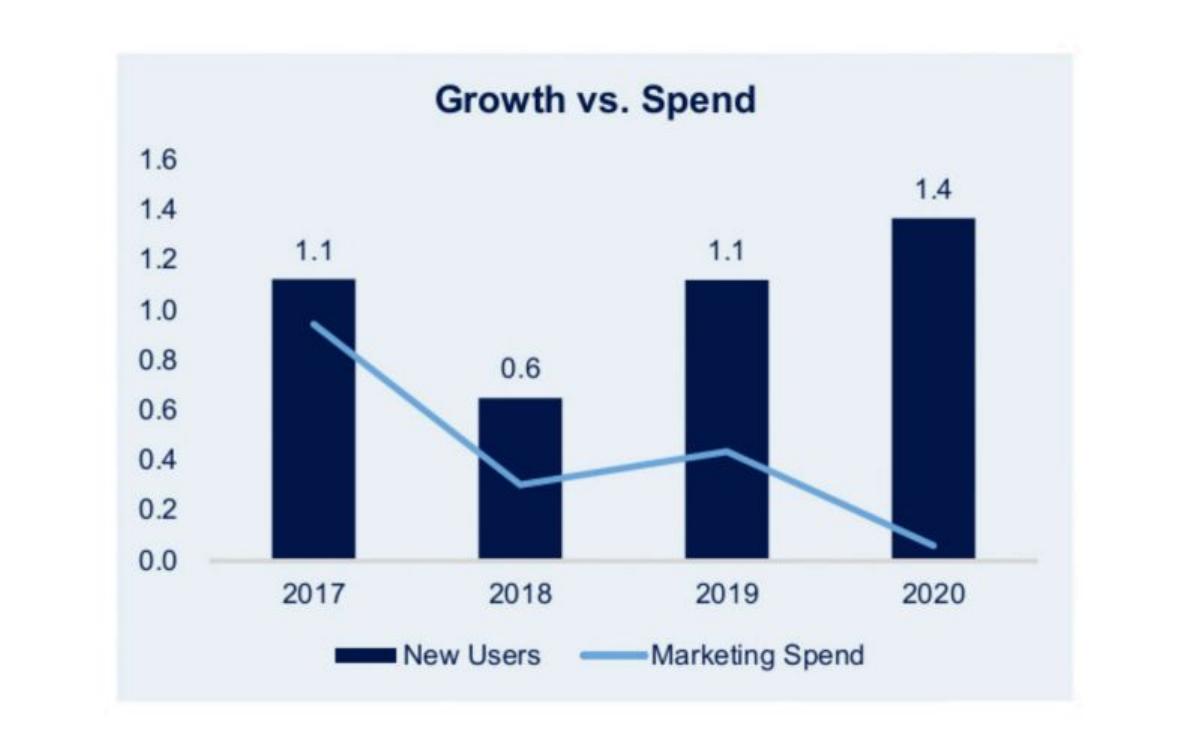
Slide 3 reinforces the efficiency narrative with a simplified version of the previous chart. It shows 'New Users' as dark blue bars and 'Marketing Spend' as a light blue line. The line shows a sharp decline from 2017 to 2020, while the bars for 2019 (1.1 million) and 2020 (1.4 million) show increasing acquisition. This slide is intended to prove that Frank had reached a 'tipping point' where the brand was self-sustaining, requiring almost no capital to grow the user base.
Slide 4: The Ecosystem and Enterprise Pipeline
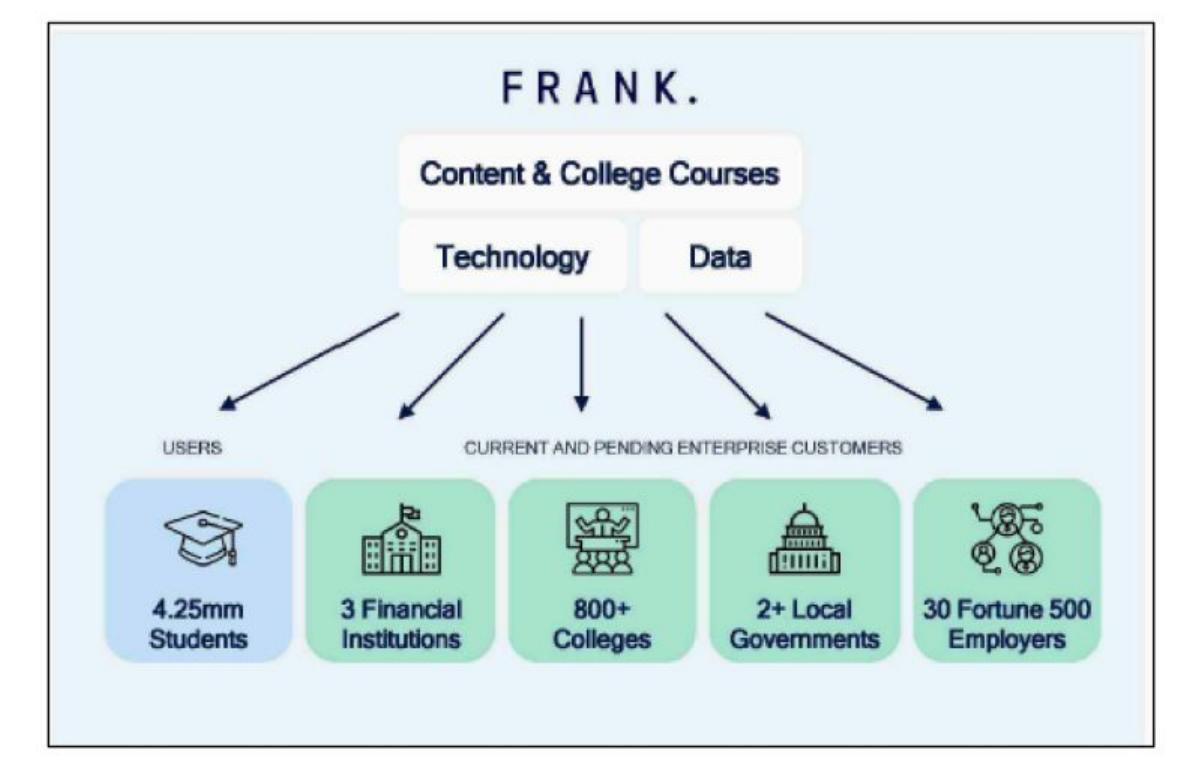
Slide 4 attempts to show the breadth of Frank's influence beyond just the students. It lists 'Current and Pending Enterprise Customers,' including:
3 Financial Institutions · 800+ Colleges · 2+ Local Governments · 30 Fortune 500 Employers
By including 'pending' customers in the same icons as current ones, the slide creates a sense of momentum without providing specific contract values or revenue. It frames Frank as a B2B2C platform where technology and data are the primary exports.
Slide 5: The Distribution Thesis
Slide 5, titled Frank Thesis: Distribution is the Power in Fintech , is the most 'sales-heavy' slide in the deck. It uses a redacted quote (likely from a social media post or news article) about Apple's payment business to argue that 'Distribution is everything.' The slide claims Frank's strategic value comes from being an 'Acquisition Machine' that would take others 'hundreds of millions of dollars' to replicate. It concludes with the assertion that adding more financial products now has 'minimal execution risk.'
Slide 6: The 2020 Growth Snapshot
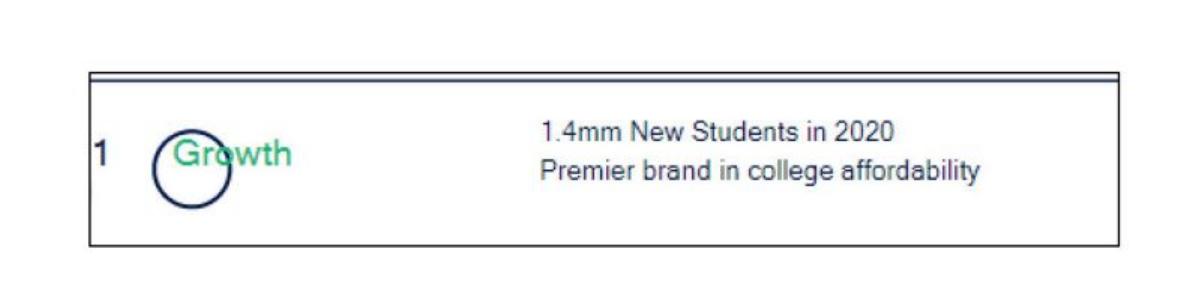
Slide 6 is a minimalist transition or summary slide. It simply states '1.4mm New Students in 2020' and calls Frank the 'Premier brand in college affordability.' This slide serves to re-anchor the investor on the most recent growth figure, ensuring the scale of the 2020 cohort is not lost in the larger cumulative numbers.
Slide 7: The User Experience Value
The final slide (numbered 7) asks 'Why 4.25 million students choose Frank.' It lists three pillars: 'Quick & Easy' (Apply for aid in under 7 minutes), 'Safe & Secure' (Bank level security), and 'Human Support.' This slide is designed to appeal to a bank's concern for compliance and customer satisfaction, using icons for a stopwatch, a lock, and a smiling face to simplify the value proposition.
What Frank Got Right in the Pitch
From a purely tactical perspective, this deck is highly effective at speaking the language of a corporate acquirer. The focus on 'Distribution' (Slide 5) was a direct hit on the biggest pain point for large banks like JP Morgan: the high cost of acquiring young customers who are increasingly wary of traditional banking brands.
The deck also correctly identified the FAFSA application as a high-intent entry point . By positioning themselves as the 'one-click' gateway to financial aid (Slide 1), they presented a clear utility that students actually need, rather than just another budgeting app. The claim of 'seamless KYC' was also a clever way to signal to a bank that the data was already 'clean' and ready for integration into their systems.
What Was Missing from the Deck
The omissions in this deck are glaring, especially for a $175 million transaction. There is no Team slide. In most startup pitches, the founders' backgrounds are a primary selling point. By omitting this, the deck keeps the focus entirely on the data and the 'machine' rather than the people running it.
There is no Revenue or Business Model slide. The deck never explains how Frank makes money today. It implies that the value is entirely in the future cross-sell of JP Morgan products. While this is common in 'acqui-hires' or strategic data plays, the total lack of current financial performance is a red flag for a company claiming to have 4 million users.
Finally, there is no definition of a 'User.' Slide 2 shows cumulative users, but it doesn't distinguish between someone who started a FAFSA application and never finished, someone who just signed up for a newsletter, and a truly active user. In the fintech world, 'Registered Users' is a notoriously soft metric compared to 'Monthly Active Users' (MAU).
Lessons for Founders
Founders can learn two very different lessons from the Frank deck. The first is the power of a unified narrative . Every slide in this deck supports the idea that Frank is an efficient, low-cost growth engine. By not cluttering the deck with unnecessary details, they made the 'Distribution' thesis impossible to miss.
The second, and more important lesson, is about data integrity . The very metrics that made this deck so attractive—the 4.25 million users and the sub-$50k marketing spend—were the ones that ultimately led to the company's downfall and legal action. While a pitch deck is a marketing document, it is also a legal representation of your business. Over-simplifying or 'massaging' user definitions to fit a growth narrative can create a 'success' that is ultimately unsustainable and legally dangerous. A founder should always be prepared to back up every single number on a slide with a raw data export during due diligence.
Frequently asked questions
- What was the primary metric Frank used to sell to JP Morgan?
- The primary metric was a user base of 4.25 million students. Frank repeated this number across almost every slide (Slides 1, 2, 4, 5, and 7). They framed this not just as a list, but as a 'trusted' relationship that allowed them to acquire new students for under $5 each, a figure significantly lower than typical fintech customer acquisition costs.
- How did Frank justify its strategic value to a large bank?
- Frank used a 'Distribution is Power' thesis. On Slide 5, they argued that their value came from being an 'Acquisition Machine' with data that would take a company hundreds of millions of dollars and many years to replicate. They explicitly stated that adding more financial products now had 'minimal execution risk' because the distribution channel was already built.
- What specific products did Frank claim to offer students?
- According to Slide 1, the product suite spanned the entire student lifecycle. Pre-college offerings included financial literacy and college search. During college, they offered FAFSA aid, scholarships, a 'Classfinder,' and Buy Now Pay Later (BNPL) services. Post-college, they planned to cross-sell student loan repayment, credit cards, and investment accounts.
- What did the deck claim about marketing efficiency?
- Slide 2 and Slide 3 focused on a dramatic increase in organic growth. They claimed that 96% of students found Frank through referrals and partners. The charts showed marketing spend plummeting from $1.3 million in 2017 to less than $50,000 in 2020, even as new user acquisition grew from 1.1 million to 1.4 million in the same period.
- What major components were missing from this pitch deck?
- The deck is notably brief at only 7 slides. It lacks a Team slide, which is standard for any startup pitch. It also lacks a Competition slide, a detailed Business Model slide (explaining how they actually make money beyond 'strategic value'), and any audited financial statements or revenue figures. The focus is almost exclusively on user growth and distribution.