The October 2012 investor presentation for Penn Virginia Corporation (PVA) serves as a blueprint for a mid-cap energy company executing a fundamental pivot. Facing low natural gas prices, PVA aggressively transitioned its production mix toward oil and natural gas liquids (NGLs). The deck highlights a 257% growth in oil/NGL production from 2Q10 to 2Q12 and a capital plan that allocated 92% of expenditures to the Eagle Ford Shale. By focusing on high-margin 'volatile oil' windows and providing granular well-level economics, PVA aimed to convince investors of its ability to generate cash flow in…
Key takeaways
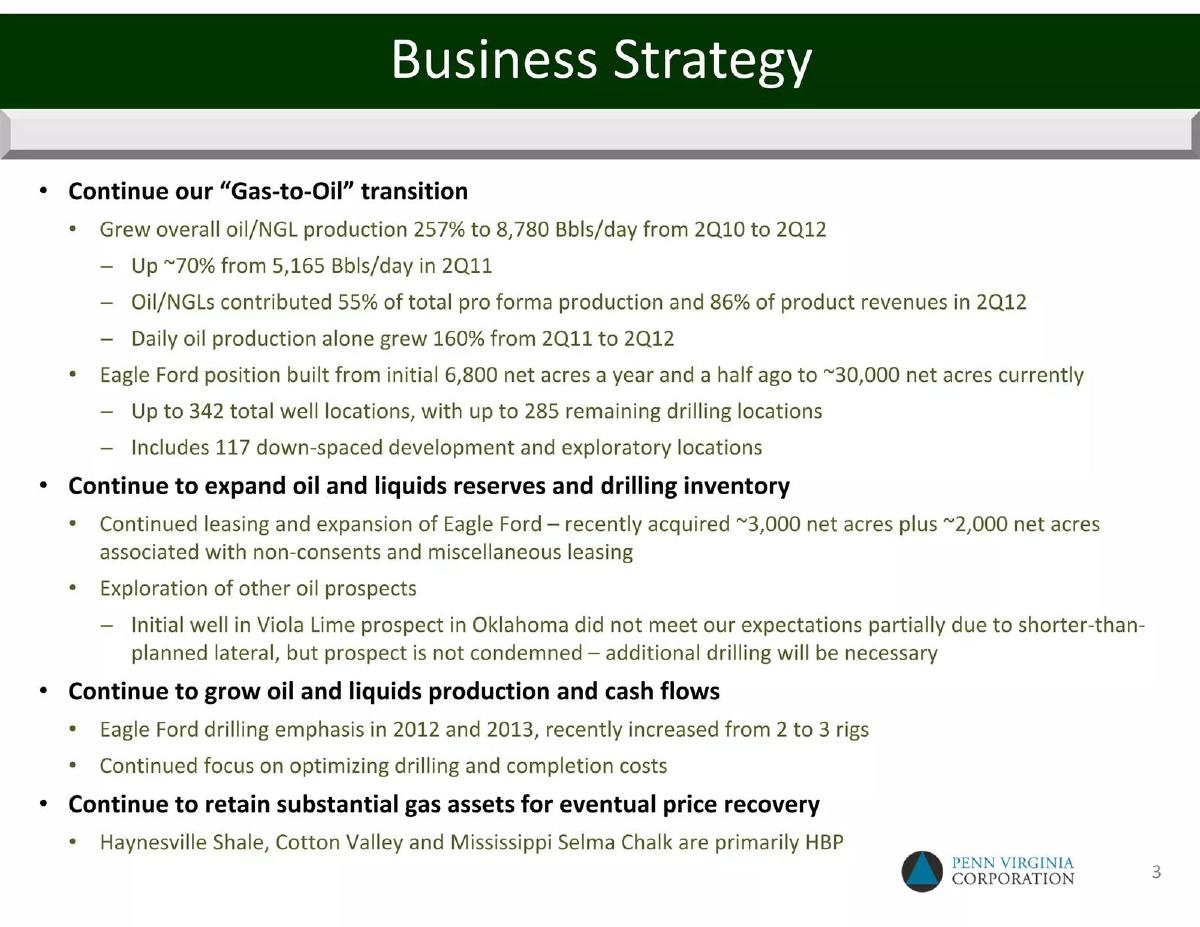
- The company executed a significant 'Gas-to-Oil' transition, growing oil/NGL production by 257% between 2Q10 and 2Q12 (Slide 3).
- Capital allocation was highly concentrated, with 92% of the $315 million to $340 million 2012 budget dedicated to Eagle Ford drilling (Slide 6).
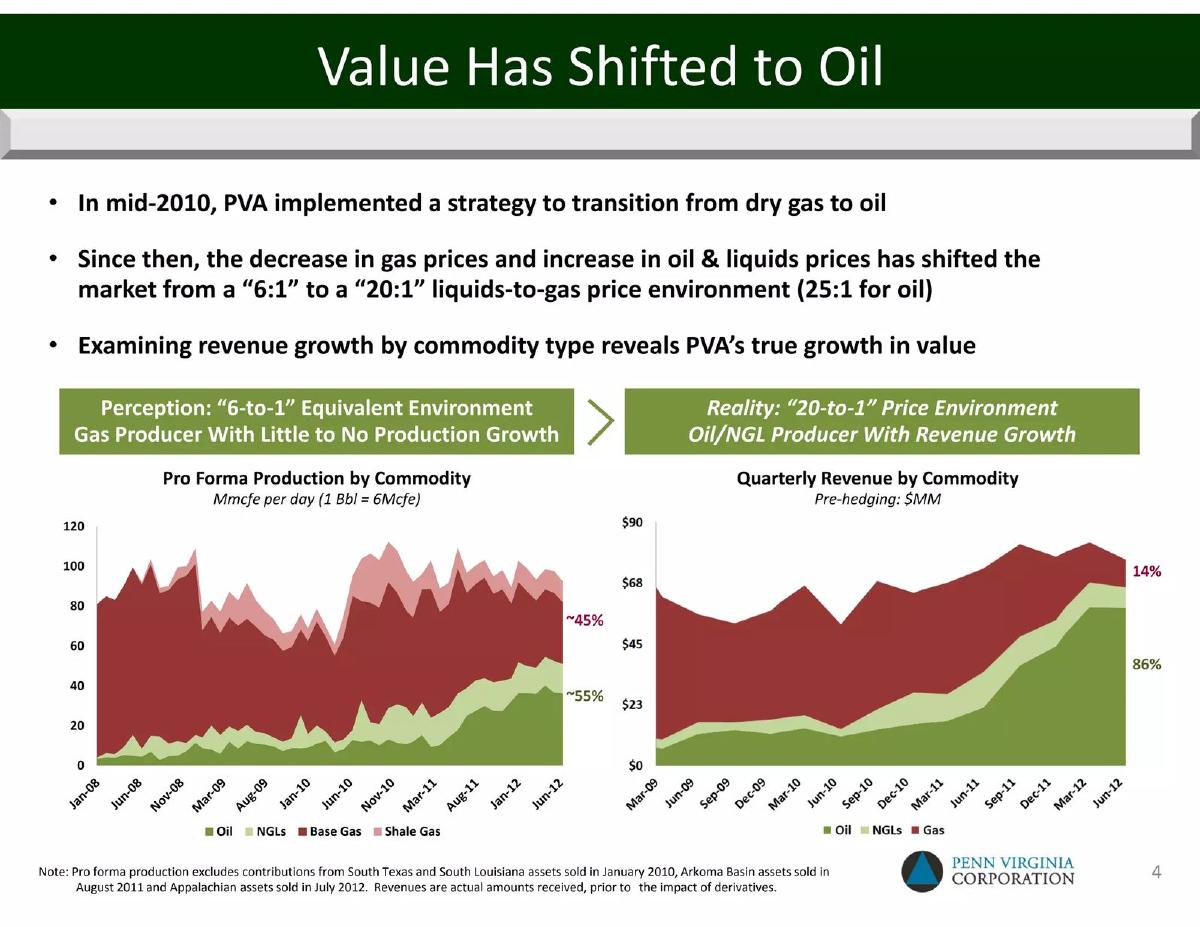
- Operational efficiency is demonstrated by oil/NGLs contributing 86% of product revenues in 2Q12 despite being only 55% of pro forma production (Slide 3).
- The deck provides specific breakeven oil prices for their primary plays, ranging from $50 to $57 per barrel (Slide 15).
- Production mix shifted from 18% oil/condensate in FY2010 to a projected 55% in PF 2Q2012 (Slide 9).
- Realized prices per Mcfe increased from $5.32 in FY2010 to a pro forma $8.27 in 2Q2012 due to the higher-value oil mix (Slide 9).
- The presentation uses Adjusted EBITDAX as a primary financial metric, reconciling it from net losses of $132.9 million in 2011 to a positive $222.5 million (Slide 21).
- Geographic focus is narrowed to the 'Volatile Oil Window' in Gonzales and Lavaca Counties, supported by specific IP rates for over 20 wells (Slide 12).
Executive Summary: The Pivot to Liquids
The October 2012 investor presentation for Penn Virginia Corporation (NYSE: PVA) represents a critical moment in the company's history. At a time when natural gas prices were volatile and often depressed, PVA presented a clear, data-driven argument for its transformation into an oil-focused producer. The deck is structured to show progress in three main areas: production mix shift, capital discipline, and asset quality in the Eagle Ford Shale.
Slide 1: Title and Visual Identity
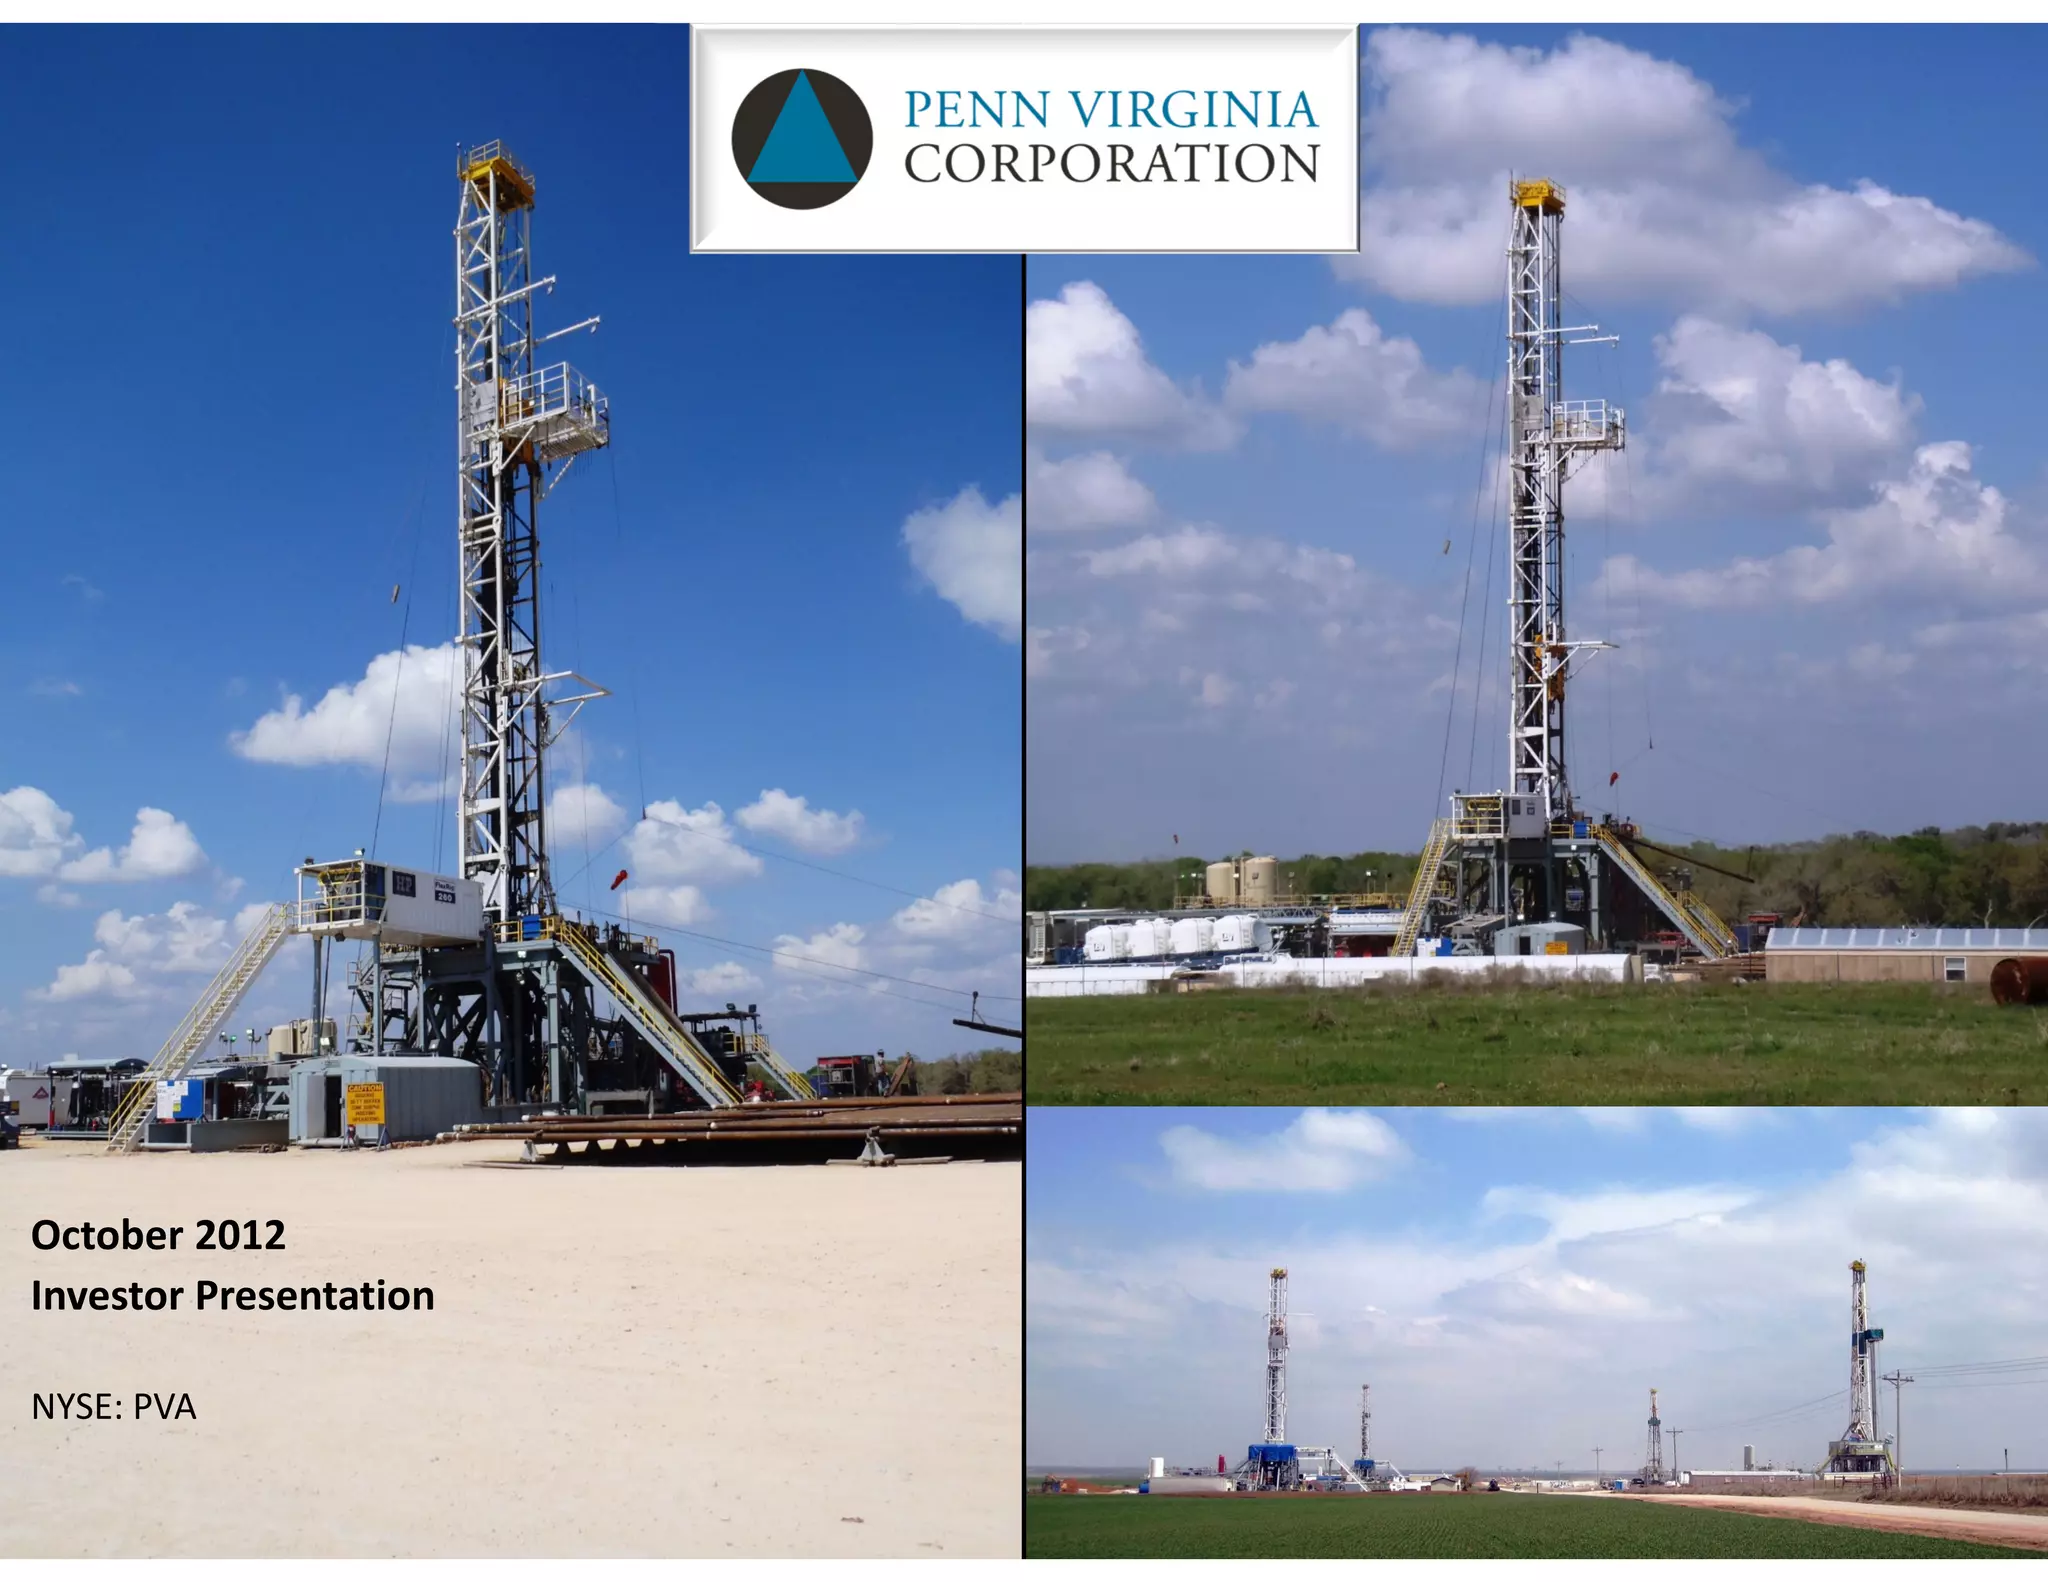
The cover slide establishes the industrial scale of the operation. Featuring three high-resolution photographs of drilling rigs in various landscapes, it immediately signals to the investor that this is a company with active, physical operations. The prominent inclusion of the NYSE ticker 'PVA' and the date 'October 2012' sets the stage for a public company update focused on current execution.
Slide 3: Business Strategy
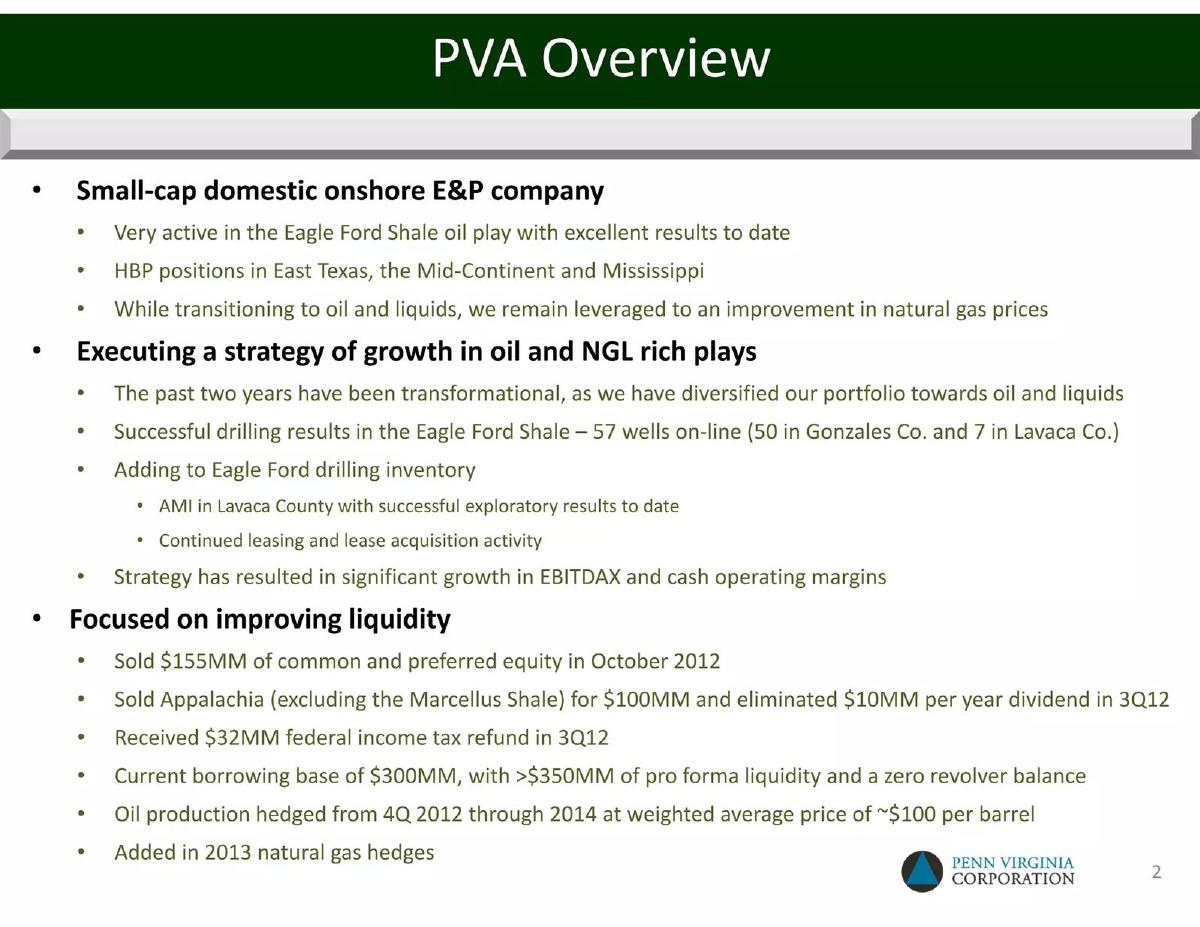
This slide is the thesis statement of the entire deck. It explicitly outlines the 'Gas-to-Oil' transition. Key metrics cited include a 257% growth in oil/NGL production from 2Q10 to 2Q12. Crucially, it notes that while oil/NGLs were 55% of production, they accounted for 86% of product revenues, providing a powerful economic justification for the pivot. The slide also mentions the expansion of the Eagle Ford position from 6,800 net acres to approximately 30,000 net acres in just eighteen months.
Slide 6: 2012 Capital Plan
PVA uses this slide to demonstrate extreme capital focus. The full-year 2012 capital expenditures are projected at $315 million to $340 million. Two pie charts illustrate the concentration: 92% of spending is directed at the Eagle Ford, and 90% of the total budget is dedicated specifically to drilling and completion. This tells investors that the company is not wasting cash on overhead or speculative seismic work, but is instead 'putting the bit in the ground' where the returns are highest.
Slide 9: Production Mix and Operating Margins
This is perhaps the most effective slide for a financial analyst. It uses two bar charts to show the correlation between the production mix and profitability. The left chart shows the green 'Oil & Condensate' portion of the bar growing from 18% in FY2010 to 55% in 2Q2012. The right chart shows the 'Cash Margin' (in $/Mcfe) following the same trajectory, rising from $2.90 to $6.04. It proves that the strategy outlined on Slide 3 is resulting in tangible margin expansion.
Slide 12: Eagle Ford Shale Asset Detail
Moving from financials to geology, Slide 12 provides a map of the company's acreage in Gonzales and Lavaca Counties. It highlights the 'Volatile Oil Window' and provides a table of 'Notable PVA Results' with Initial Production (IP) rates for 25 different wells. Rates range from 827 BOEPD to as high as 1,921 BOEPD. This level of transparency is designed to build confidence in the repeatability of their drilling success.
Slide 15: Compelling Economics & Value
Slide 15 addresses the 'what if' scenarios regarding commodity prices. It provides sensitivity analysis for both Gonzales and Lavaca Counties, showing Rate of Return (ROR) curves against NYMEX oil prices. The slide explicitly states breakeven prices ($50 to $57 per barrel), which, given 2012 oil prices, suggested a significant margin of safety. It also lists major assumptions for drilling and completion (D&C) costs, ranging from $7.0M to $9.5M per well.
Slide 18: Investment Highlights
This slide serves as the summary of the value proposition. It reiterates the strategic balance between liquids and gas, the strengthened balance sheet, and the multi-year inventory of drilling opportunities. It is a standard 'wrap-up' slide designed to leave investors with a concise list of reasons to own the stock, emphasizing 'ongoing growth' and 'optionality.'
Slide 21: Non-GAAP Reconciliation
In a transparent move, PVA includes a detailed reconciliation of Adjusted EBITDAX. This is vital because the company reported significant net losses in 2009, 2010, and 2011 (peaking at a $132.9 million loss in 2011). By adding back non-cash items like depreciation ($162.5M) and impairments ($104.7M), they show an Adjusted EBITDAX of $222.5 million for 2011, proving the business generates substantial cash despite accounting losses.
What Penn Virginia Corporation Does Well
The deck excels at economic transparency . By providing specific well names and their corresponding IP rates (Slide 12), PVA moves beyond vague promises and into verifiable data. Furthermore, the direct linkage between the production mix shift and margin expansion (Slide 9) provides a clear 'cause and effect' narrative that is easy for investors to follow.
The sensitivity analysis on Slide 15 is also a highlight. Many decks fear discussing breakeven points, but PVA leans into it, showing exactly how their returns fluctuate with oil prices. This builds trust with sophisticated institutional investors who are modeling these exact scenarios themselves.
What is Missing from the Deck
Despite the technical depth, there are notable omissions common in public company presentations of this era. First, there is no dedicated team slide in the provided selection. While the management of a NYSE-listed company is public record, a slide highlighting the technical expertise of the drilling and geological teams would have reinforced the operational claims.
Second, there is a lack of competitive benchmarking . While they mention 'Notable Industry Results' on the map (Slide 12), they do not explicitly compare their D&C costs or IP rates against peers in the Eagle Ford like EOG Resources or Marathon Oil. Investors always want to know if a company is the 'best in class' or merely 'middle of the pack' in a specific play.
Founder's Guide: What to Copy
The 'Strategy to Margin' Bridge: If you are pivoting your business model, use a slide like Slide 9. Show exactly how the change in your product mix or customer base is directly leading to higher margins. · Granular Proof Points: Don't just say your product works. If you are a B2B company, list your top 20 customers and their usage metrics. PVA's list of 25 wells with specific IP rates is the gold standard for proving operational competence. · Breakeven Analysis: Every founder should know their breakeven point. Including a sensitivity chart (like Slide 15) that shows how your unit economics change based on price or volume demonstrates a level of financial maturity that attracts serious capital. · Non-GAAP Clarity: If your 'bottom line' looks bad due to heavy R&D or one-time setup costs, use a reconciliation slide (Slide 21) to show the 'Adjusted' health of the business. Just ensure you are following standard industry definitions to maintain credibility.
Frequently asked questions
- What was the primary goal of Penn Virginia's strategy in 2012?
- The primary goal was a 'Gas-to-Oil' transition. The company sought to move away from its historical reliance on natural gas, which faced price headwinds, and toward oil and NGLs. This involved growing oil production by 160% year-over-year and focusing almost all new capital expenditures on oil-rich acreage in the Eagle Ford Shale to improve margins and cash flow.
- How did the production mix change affect the company's margins?
- The shift was dramatic. In FY2010, oil and condensate made up only 18% of production. By 2Q2012, this rose to 55%. Because oil carries a higher market value than gas, the realized price per Mcfe rose from $5.32 to $8.27. Consequently, cash margins expanded from $2.90 to $6.04 per Mcfe over the same period, nearly doubling the profitability per unit produced.
- What specific regions were the focus of the 2012 capital plan?
- The 2012 capital plan was almost entirely focused on the Eagle Ford Shale in South Texas, which received 92% of the budget. Within the Eagle Ford, the company prioritized the 'Volatile Oil Window' across Gonzales and Lavaca Counties. A smaller 7% of capital was allocated to the Mid-Continent region, while other legacy gas assets were held in maintenance mode.
- What financial metrics did PVA use to show performance despite net losses?
- PVA utilized 'Adjusted EBITDAX' (Earnings Before Interest, Taxes, Depreciation, Amortization, and Exploration expenses). This is common in the oil and gas industry to show core operational cash flow. While the company reported a net loss of $132.9 million in 2011, their Adjusted EBITDAX was a positive $222.5 million, providing a clearer picture of their ability to service debt and fund drilling.
- What were the economic assumptions for their new drilling locations?
- For Gonzales County, they assumed a $7.0M-$8.0M drilling and completion cost to achieve a breakeven oil price of $50-$57 per barrel. In Lavaca County, costs were slightly higher at $8.5M-$9.5M with a similar breakeven. They targeted a 30-day average production rate of 650-670 BOEPD (Barrels of Oil Equivalent Per Day) to justify these investments.