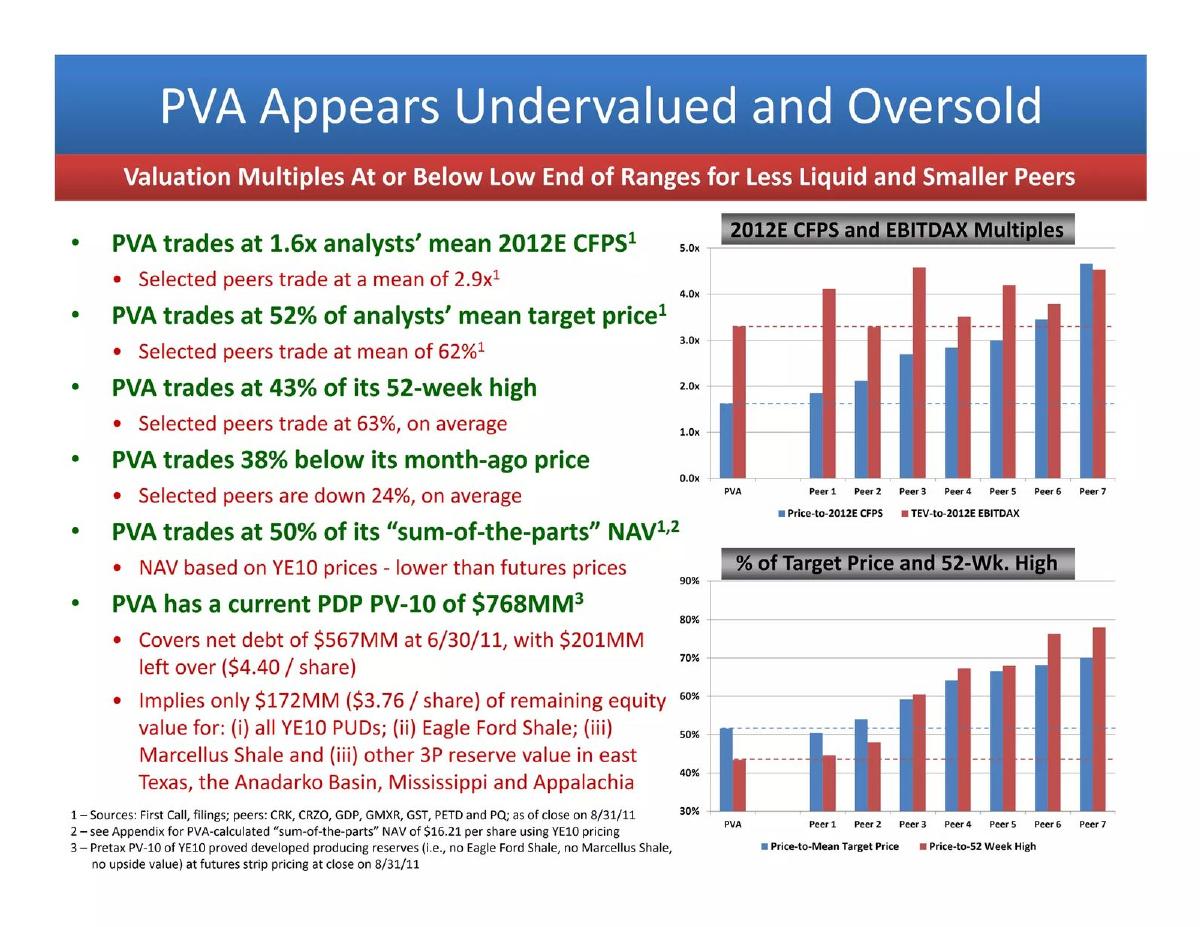
In 2011, Penn Virginia Corporation (NYSE: PVA) presented a strategic pivot at the Barclays Capital CEO Energy-Power Conference. The company aimed to transition its production mix toward oil and liquids to capture higher returns, specifically targeting the Eagle Ford Shale. The deck highlights a robust inventory of drilling locations across several major U.S. plays, including the Marcellus Shale and Granite Wash. A central theme of the presentation is the company's perceived undervaluation; management argued that PVA was trading at a 50% discount to its 'sum-of-the-parts' Net Asset Value. The…
Key takeaways
- The company is executing a 'Gas-to-Liquids' transition, aiming for 40-45% of 4Q11 production to be oil/liquids compared to 18% in 2010 (Slide 7).
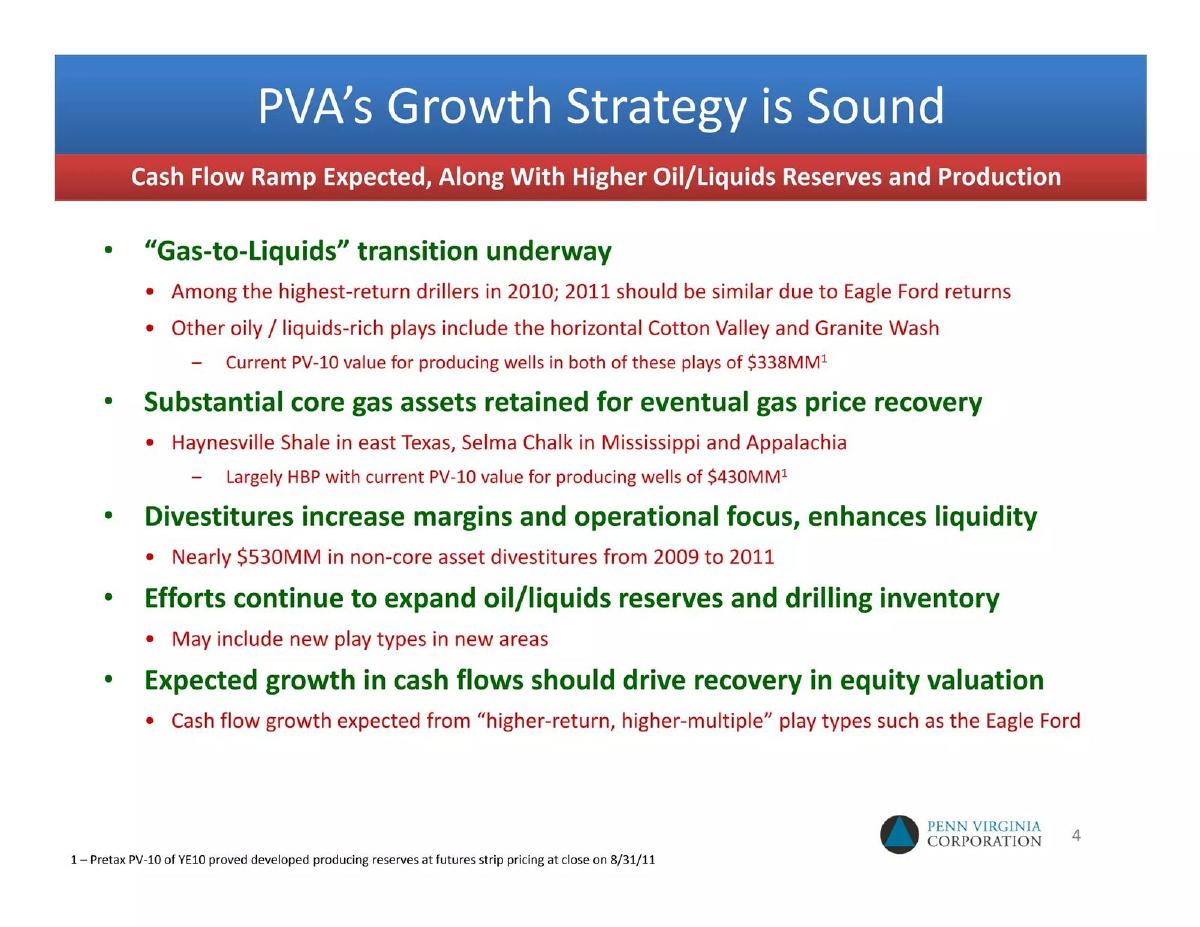
- PVA divested nearly $530 million in non-core assets between 2009 and 2011 to enhance liquidity and operational focus (Slide 4).
- The Eagle Ford Shale is the primary growth driver, with initial wells showing an average peak gross production rate of 1,040 BOEPD (Slide 16).
- Management claims the stock is significantly undervalued, trading at $8.16 against a calculated NAV per share of $16.21 to $38.91 depending on gas pricing (Slide 22).
- Capital expenditures for 2011 were projected at $360-$380 million, with 86% allocated to oil and liquids-rich plays (Slide 13).
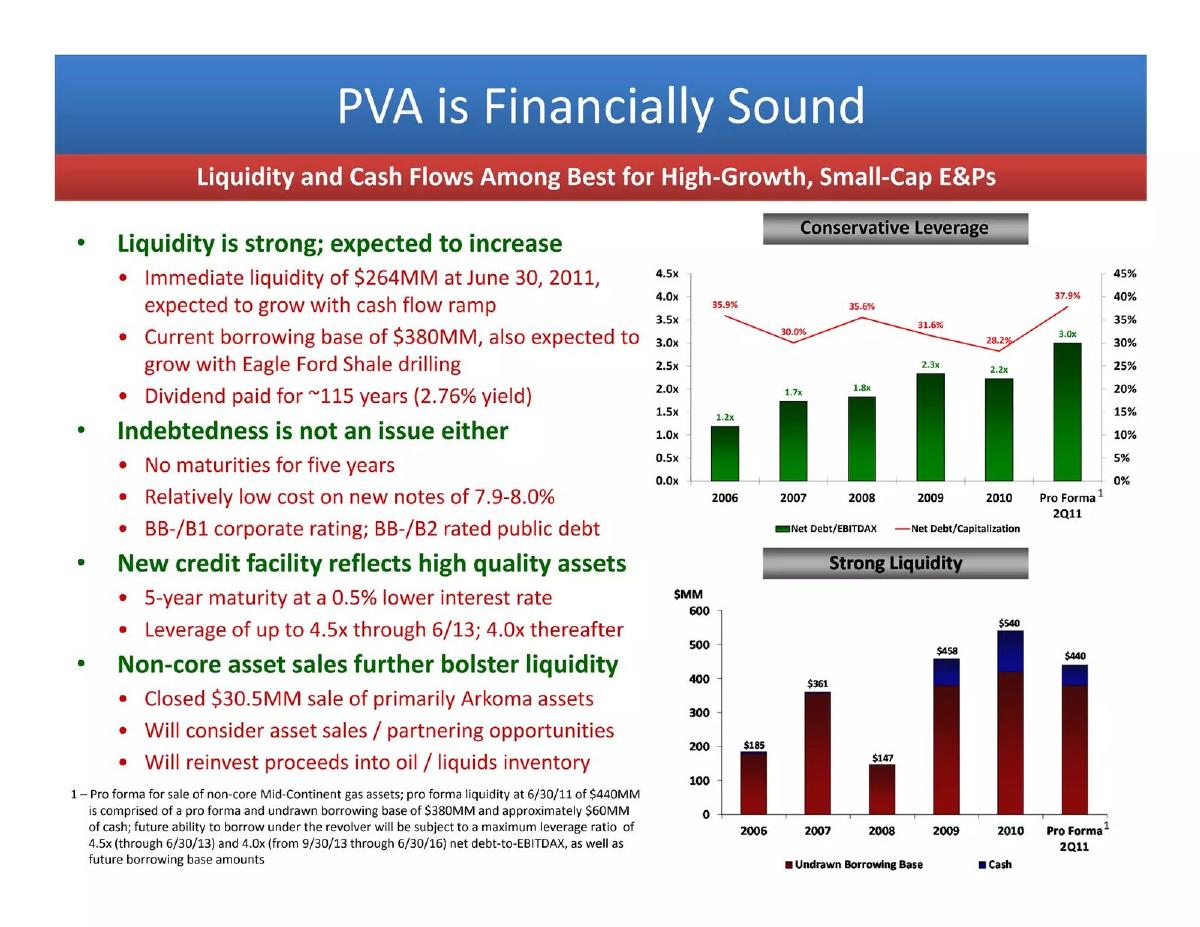
- The company maintains a solid financial position with no debt maturities for five years as of the presentation date (Slide 7).
- Drilling inventory includes over 200 gross locations in the Marcellus Shale and 130 in the Eagle Ford Shale (Slide 10).
- Adjusted EBITDAX remained relatively stable, reported at $182.9 million for the LTM 2Q11 period (Slide 25).
Executive Summary and Strategic Pivot
The Penn Virginia Corporation (PVA) investor presentation from September 2011 serves as a roadmap for a mid-cap exploration and production (E&P) company attempting to reinvent its production profile. At the time of this presentation, the energy market was experiencing a divergence between oil and natural gas prices, prompting many producers to shift their focus. PVA's deck is a classic example of a 'strategic transition' narrative, moving from a gas-heavy portfolio to one dominated by oil and liquids.
Slide 1: Title and Context
The cover slide establishes the venue: the Barclays Capital 2011 CEO Energy-Power Conference. It features a high-resolution image of an Eagle Ford Shale drilling rig in Gonzales County, Texas. This visual choice is deliberate; it immediately signals to investors that the company is active in one of the most prominent oil plays of the era. The inclusion of the NYSE ticker (PVA) and the specific date (September 6, 2011) grounds the presentation in a specific market moment.
Slide 4: The Growth Strategy
Slide 4, titled "PVA’s Growth Strategy is Sound," outlines the five pillars of the company's plan. The first point is the "Gas-to-Liquids" transition. The company highlights that it was among the highest-return drillers in 2010 and expects 2011 to be similar due to Eagle Ford returns. Notably, the slide mentions that the current PV-10 value for producing wells in oily/liquids-rich plays (Cotton Valley and Granite Wash) is $338 million. Conversely, they emphasize that they are retaining core gas assets (Haynesville, Selma Chalk, and Appalachia) for an eventual price recovery, noting a PV-10 value of $430 million for those producing wells. The slide also mentions $530 million in non-core asset divestitures between 2009 and 2011, which was a key mechanism for increasing liquidity and operational focus.
Slide 7: Strategic Response and Liquidity
This slide poses the question, "What is Our Response?" and provides a checklist of actions. The most significant metric here is the increase in oil and liquids exposure: from 18% of production in 2010 to a projected 40-45% in 4Q11. The company emphasizes its financial health, stating there are "no maturities for five years" and "ample liquidity to fund CAPEX until free cash flow positive." This is a critical message for investors concerned about the capital-intensive nature of shale drilling. The slide also notes that gas drilling has been deferred in favor of oil/NGL drilling, demonstrating disciplined capital allocation based on current market prices.
Slide 10: Drilling Inventory and Breakeven Prices
Slide 10 provides a comprehensive table of the company's drilling locations across six plays: Eagle Ford Shale, Granite Wash, Horizontal Cotton Valley, Haynesville Shale, Selma Chalk, and Marcellus Shale. The data is granular, listing gross undrilled locations, average working interest, and net risked reserve potential. Crucially, the slide includes breakeven prices for a 10% IRR. For the Eagle Ford, the WTI breakeven is cited at $40-$59 per barrel. For gas plays like the Marcellus, the Henry Hub breakeven is $3.48. This slide serves to prove the depth of the company's inventory and the economic viability of its assets at then-current strip pricing.
Slide 13: 2011 Capital Expenditures
This slide uses two pie charts to break down the $360 - $380 million capital spending plan for 2011. The first chart shows that 82% of the budget is dedicated to drilling, with 12% for leasehold and 6% for seismic. The second chart breaks down spending by play, with the Eagle Ford Shale receiving a massive 60% of the total budget. Mid-Continent assets receive 23%, while the Marcellus Shale is allocated 11%. This visual reinforces the company's stated strategy of funneling the majority of its capital into its highest-return, oil-rich assets.
Slide 16: Eagle Ford Operational Results
To validate the shift to the Eagle Ford, slide 16 provides specific well results. It lists 12 "On-Line Wells" by name, including lateral length, frac stages, and production rates. The data is impressive: the initial six wells had an average peak gross production rate of 1,040 BOEPD, and the next six wells averaged 1,169 BOEPD. The table includes specific wells like the Munson Ranch #1H, which peaked at 1,921 BOEPD. By providing this level of transparency, PVA is attempting to de-risk the play for investors and justify the 60% CAPEX allocation shown on the previous slide.
Slide 19: Marcellus Shale Positioning
While the focus is on oil, slide 19 covers the company's Marcellus Shale assets in North Central Pennsylvania. PVA reports approximately 55,000 net acres and over 200 gross drilling locations. The slide notes that they are the operator with an ~87% working interest. The activity for 2011 involved drilling and testing three wells in Potter County. This slide serves as a reminder of the company's "optionality"—while not the current focus of CAPEX, these assets represent significant future value if natural gas prices improve.
Slide 22: The Value Proposition (NAV Analysis)
This is arguably the most important slide for a potential investor. It presents a "Sum-of-the-Parts" Net Asset Value (NAV) analysis to argue that PVA is significantly undervalued. The company compares its stock price of $8.16 (as of 8/31/11) to various NAV scenarios. Under SEC pricing ($4.38 gas / $79.43 oil), the NAV per share is calculated at $16.21. Under a more optimistic $6.00 gas price scenario, the NAV jumps to $38.91. The slide explicitly points out that the stock offers an "Upside to NAV per Share" of 99% to 377%. This is a direct appeal to value investors, suggesting that the market has not yet priced in the value of the company's underlying reserves and acreage.
Slide 25: Non-GAAP Reconciliations (EBITDAX)
The final slide in the provided selection is a technical financial reconciliation. It shows how the company arrives at "Adjusted EBITDAX" from net income. This is standard for the E&P industry, as it adds back non-cash items like depreciation, depletion, and amortization (DD&A), as well as exploration expenses and impairments. The table shows Adjusted EBITDAX growing from $180.6 million in 2006 to $182.9 million for the LTM 2Q11. This slide provides the historical financial backbone to support the forward-looking growth claims made earlier in the deck.
What Works in This Deck
Granular Data: The deck does not shy away from hard numbers. Slide 16, in particular, provides well-by-well performance data that allows analysts to verify the company's claims about its Eagle Ford success. Similarly, slide 10 provides specific breakeven prices, which is essential for understanding the margin of safety in their drilling program.
Clear Strategic Narrative: The "Gas-to-Liquids" theme is consistent throughout the presentation. Every slide, from the CAPEX allocation to the operational updates, reinforces the idea that the company is moving toward higher-margin production. This clarity of purpose is vital for investor confidence during a pivot.
Valuation Transparency: Slide 22 is a masterclass in presenting a value thesis. By breaking down the NAV into proved developed, proved undeveloped, and probable reserves, and then showing how those values change with commodity prices, PVA makes a compelling case for its own undervaluation.
What is Omitted
Management Team: The provided slides do not include a team slide. While this was a public company presentation where the CEO was likely present, a teardown of the deck itself reveals a lack of focus on the individuals executing the strategy. In a high-stakes transition, the track record of the leadership team is a key component of the investment thesis.
Environmental and Regulatory Risks: There is no mention of the environmental or regulatory challenges associated with hydraulic fracturing, which were significant topics of debate in 2011, especially in the Marcellus Shale region. While common for the era, modern decks would require a dedicated ESG or risk section.
Competitor Benchmarking: While the deck mentions that PVA is among the "highest-return drillers," it does not provide direct comparisons to peer companies in the Eagle Ford or Marcellus. Investors often look for relative performance metrics to determine if a company is truly best-in-class or simply riding a rising tide.
Founder Takeaways
Use 'Sum-of-the-Parts' to Combat Market Mispricing: If your company has multiple business lines or asset classes that the market is valuing as a single, lower-multiple entity, use a slide like PVA's Slide 22. Breaking down the value of individual components can help investors see the 'hidden' value in your portfolio.
Prove the Pivot with Capital Allocation: Don't just say you are pivoting; show where the money is going. PVA's use of pie charts in Slide 13 to show that 86% of CAPEX is targeting liquids is a powerful way to prove that the strategic shift is real and funded.
Establish a 'Type Curve': For any company in a recurring production or SaaS model, establishing a 'type curve' or a standard unit economic profile is essential. PVA's Slide 16 uses real-world data to create a 558 MBOE type curve, which gives investors a predictable model for future growth. Founders should do the same with customer acquisition costs (CAC) and lifetime value (LTV) data.
Maintain a 'Wait and See' Optionality: PVA's strategy of holding gas assets HBP (Held by Production) while focusing on oil is a lesson in optionality. If you have a product or asset that isn't currently favored by the market, find a way to maintain it at low cost so you can capitalize on it when market conditions change.
Frequently asked questions
- What is the primary strategic goal outlined in the deck?
- The primary goal is a transition from natural gas to oil and liquids-rich production. Penn Virginia Corporation aimed to increase its liquids exposure from 18% of production in 2010 to between 40-45% by the fourth quarter of 2011. This shift was intended to capture higher-return opportunities in plays like the Eagle Ford Shale while retaining gas assets for a future price recovery.
- How does the company justify its valuation to investors?
- The company uses a 'sum-of-the-parts' Net Asset Value (NAV) analysis. On slide 22, they show that while the stock was trading at $8.16, the NAV per share was calculated at $16.21 even under conservative SEC pricing ($4.38 gas / $79.43 oil). They argued the stock was trading at a 50% discount to its intrinsic asset value, providing significant upside potential.
- What are the key operational metrics for their Eagle Ford assets?
- Slide 16 provides detailed well-level data. The first twelve wells showed an average peak gross production rate of 1,105 BOEPD. The company used these results to establish a 558 MBOE type curve for the play. They also noted that their Eagle Ford drilling locations were economic at WTI oil prices between $40 and $59 per barrel.
- What is the company's plan for its natural gas assets?
- PVA adopted a 'wait and see' approach for its core gas assets in the Haynesville Shale, Selma Chalk, and Appalachia. Slide 7 notes they intended to retain long-term optionality on these assets, which were largely 'Held by Production' (HBP), allowing them to defer gas drilling in favor of higher-margin oil and NGL drilling until gas prices recovered.
- How was the 2011 capital expenditure budget allocated?
- The budget was set at $360-$380 million. According to slide 13, 82% of this was dedicated to drilling and 86% was targeted at oil and liquids-rich plays. Geographically, the Eagle Ford Shale received the largest share of the capital program at 60%, followed by Mid-Continent assets at 23%.