Real Estate Traction Slides: 7 Real Proptech Pitch Deck
How real estate and property tech startups show traction: homes sold and revenue by year, deals funded since launch.
Real Estate Traction Slides: Real Proptech Pitch Deck Examples
Seven traction slides from real estate and property tech decks (home buying, real estate crowdfunding, smart building access, construction software, property loans, home co-ownership and crane monitoring), shown in full. Property deals are large and infrequent, so investors look at transaction volume (homes, deals, units), revenue or gross profit, and how those grow. The stronger slides give volume and dollars with dates; the weaker one shows a curve with no values.
TL;DR
A real estate traction slide should show transaction volume and revenue with dates, and explain its definitions. Opendoor puts markets, homeowners served and homes sold next to revenue by year. RealtyShares shows deals, capital funded and a cumulative origination chart since launch. Latch gives growth rates for bookings and revenue and labels them as preliminary. iControl shows $45K MRR and 20% monthly growth beside three named building projects. Guamby charts investors and loan applications by month. Pacaso lists cumulative gross profit and transaction value with footnotes. Versatile shows an ARR curve with no values, the weaker example here.
Real estate traction slides
Each example shows the exact stored slide above its analysis and links to the full teardown. Stronger examples first. Claims and figures are as shown on the slides; we have not verified them.
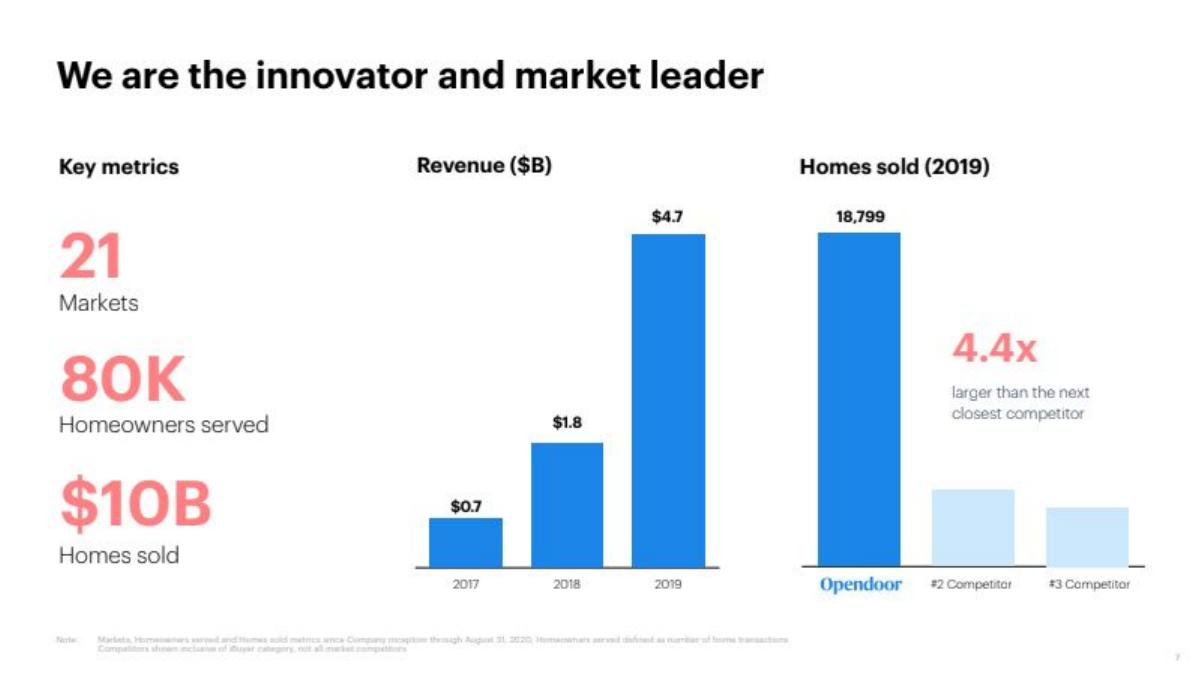
Opendoor traction slide — slide 6
Growth stage (recorded). Online home buying and selling; deck for its public listing. Three columns.
Opendoor deck, slide 6. Exact stored slide matched to this analysis.
Our analysis: The most complete slide here: volume, revenue and growth by year are all visible, and the footnote says what each number covers.
Evidence and limitation: Markets, customers, home value sold, three years of revenue and one year of homes sold, with definitions in a footnote.
What a founder can adapt: Show transactions and revenue by year, and define cumulative figures in a footnote.
Supporting analysis
What the deck claims: "We are the innovator and market leader." "Key metrics: 21 Markets. 80K Homeowners served. $10B Homes sold." "Revenue ($B)": $0.7 (2017), $1.8 (2018), $4.7 (2019). "Homes sold (2019)": 18,799, "4.4x larger than the next closest competitor." A footnote defines the metrics as since inception through August 31, 2020.
Presentation choice: Pairing homes sold with revenue by year shows both scale and how fast it is growing.
When it does not fit: Unnamed competitors in a comparison; say who they are or leave the comparison out.
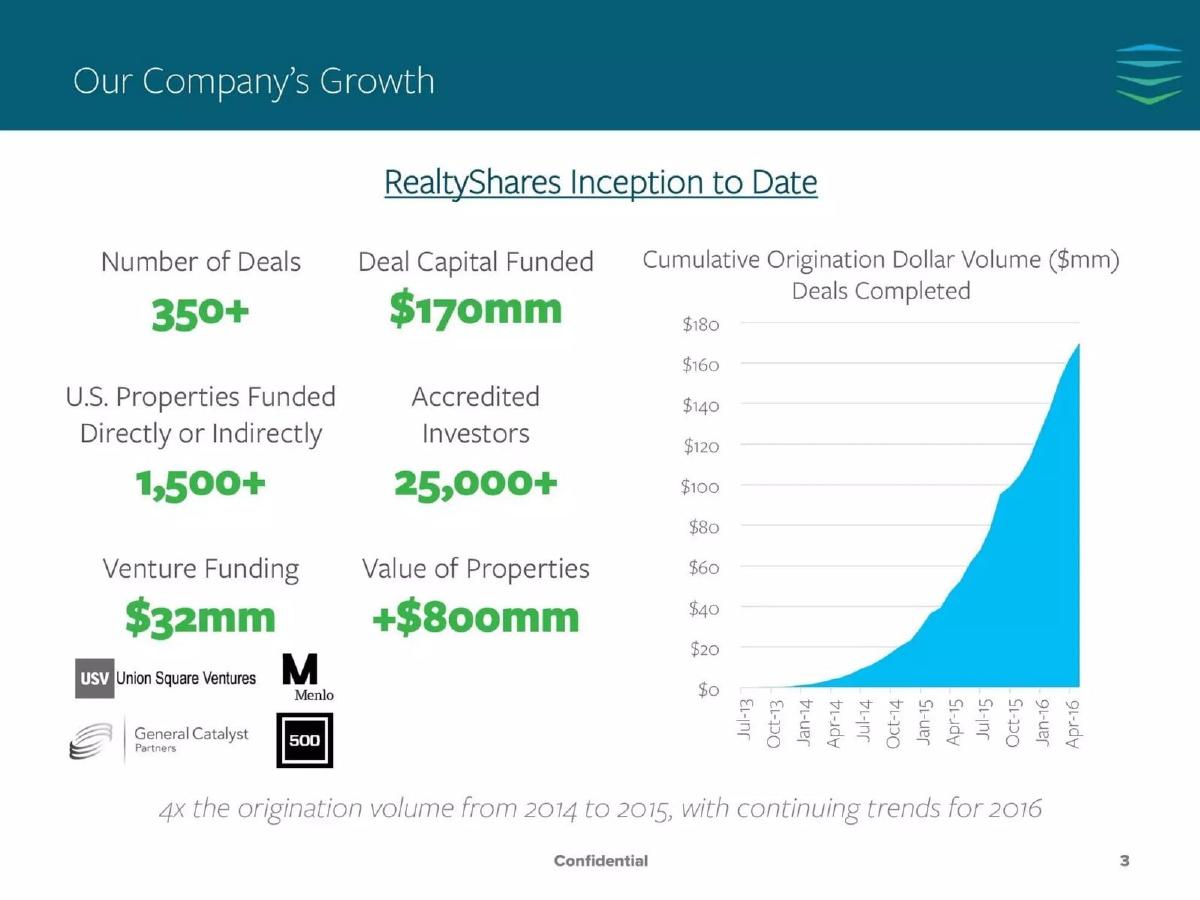
Series C (recorded). Online real estate investing. Six figures and a cumulative chart.
RealtyShares deck, slide 3. Exact stored slide matched to this analysis.
Our analysis: Clear on both sides of the platform (deals and investors), and the caption turns the cumulative curve into a growth rate.
Evidence and limitation: Deals, capital funded, properties, investors and a dated cumulative chart; a year-on-year multiple in the caption.
What a founder can adapt: If you show a cumulative chart, add the growth rate for a recent period beside it.
Supporting analysis
What the deck claims: "Our Company's Growth." "RealtyShares Inception to Date." "Number of Deals 350+." "Deal Capital Funded $170mm." "U.S. Properties Funded Directly or Indirectly 1,500+." "Accredited Investors 25,000+." "Venture Funding $32mm." "Value of Properties +$800mm." Chart: "Cumulative Origination Dollar Volume ($mm)", July 2013 to April 2016. "4x the origination volume from 2014 to 2015."
Presentation choice: A cumulative chart always rises, so adding "4x from 2014 to 2015" tells investors the actual pace.
When it does not fit: Mixing funding raised with traction figures; venture funding is not customer demand.
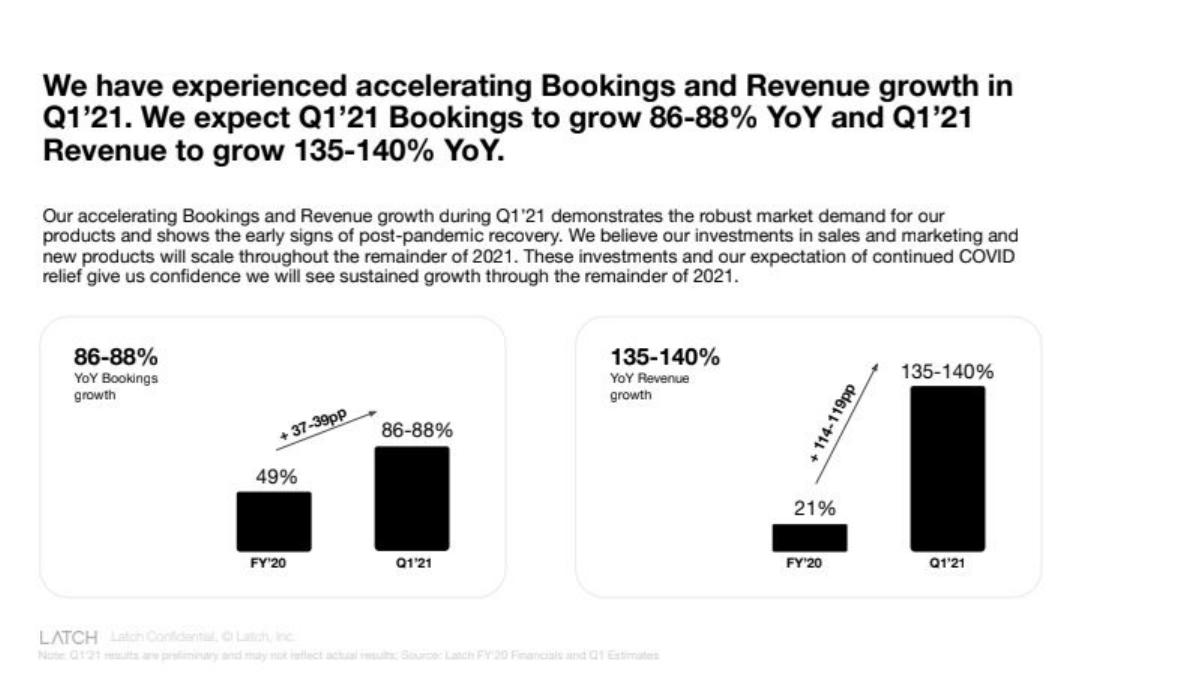
Growth stage (recorded). Smart locks and software for apartment buildings. Two bar charts and a paragraph.
Latch deck, slide 5. Exact stored slide matched to this analysis.
Our analysis: Shows acceleration clearly and is honest that the latest quarter is an estimate, but gives only percentages.
Evidence and limitation: Growth rates for bookings and revenue, with the latest quarter given as a range and marked preliminary; no dollar amounts.
What a founder can adapt: Mark estimates as estimates, and show the dollar amounts behind the growth rates.
Supporting analysis
What the deck claims: "We have experienced accelerating Bookings and Revenue growth in Q1'21. We expect Q1'21 Bookings to grow 86-88% YoY and Q1'21 Revenue to grow 135-140% YoY." Bookings growth: 49% (FY'20), 86-88% (Q1'21). Revenue growth: 21% (FY'20), 135-140% (Q1'21). Note: "Q1'21 results are preliminary and may not reflect actual results."
Presentation choice: Labelling unfinished figures as preliminary protects credibility if the final number differs.
When it does not fit: Growth rates alone; investors need the base to judge them.
Seed (recorded). Construction project software in Sweden. Three numbers above three project photos.
iControl deck, slide 5. Exact stored slide matched to this analysis.
Our analysis: Revenue and growth are clear, and named projects make the customers real; "10x with current customers" is not explained.
Evidence and limitation: Monthly recurring revenue, a monthly growth rate and three named projects with their construction value.
What a founder can adapt: Show MRR and monthly growth, then name two or three flagship projects.
Supporting analysis
What the deck claims: "$45K MRR." "+20% MoM." "10x with current customers." "iControl projects": "Soder Hospital, Size: $100 million USD." "Tele2 Headquarters, Size: $60 million USD." "Superbridge, Southern Stockholm, Size: $30 million USD."
Presentation choice: Named projects with their size tell investors the software is used on large, real builds.
When it does not fit: An unexplained multiple; say what "10x" measures (expansion potential, contract value or usage).
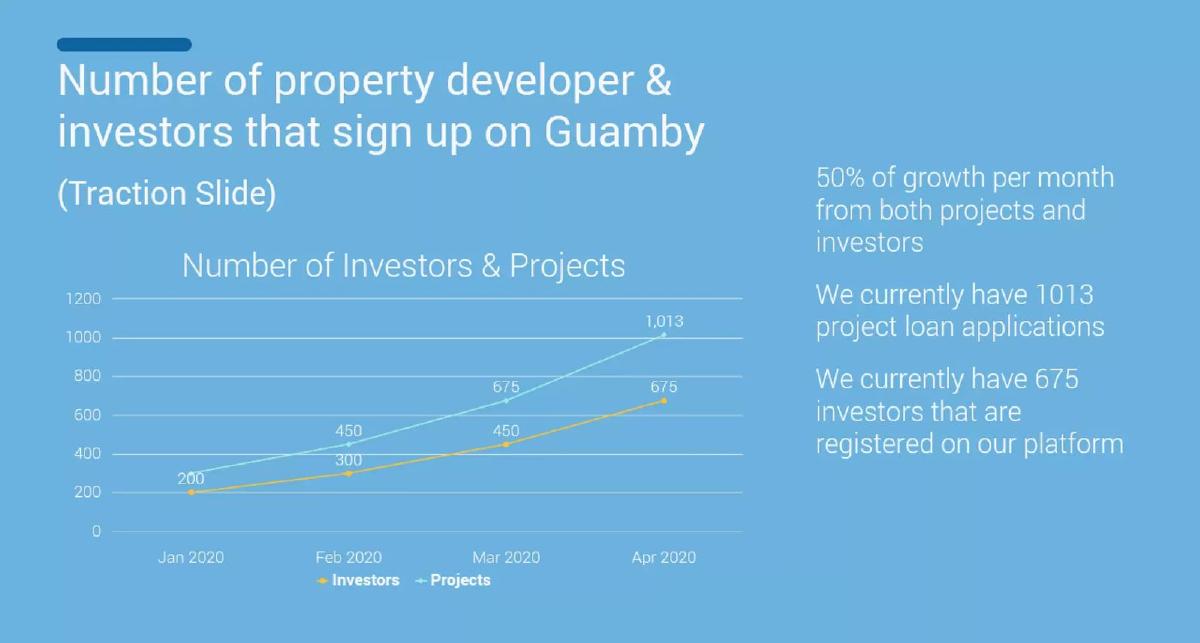
Seed (recorded). Property development loans funded by investors. A line chart and three statements.
Guamby deck, slide 6. Exact stored slide matched to this analysis.
Our analysis: Shows both sides growing together with labelled points, but applications and registrations are not yet funded loans.
Evidence and limitation: Monthly counts for both sides of the platform over four months; the investor figures do grow about 50% a month. No loans funded or revenue.
What a founder can adapt: Chart both sides by month, then add loans funded and their value.
Supporting analysis
What the deck claims: "Number of property developer & investors that sign up on Guamby (Traction Slide)." Chart: investors 200, 300, 450, 675 and projects rising to 1,013, January to April 2020. "50% of growth per month from both projects and investors." "We currently have 1013 project loan applications." "We currently have 675 investors that are registered on our platform."
Presentation choice: For a two-sided property platform, showing supply and demand growing together answers the first question.
When it does not fit: Counting applications and sign-ups as the main result; show completed deals as soon as you have them.
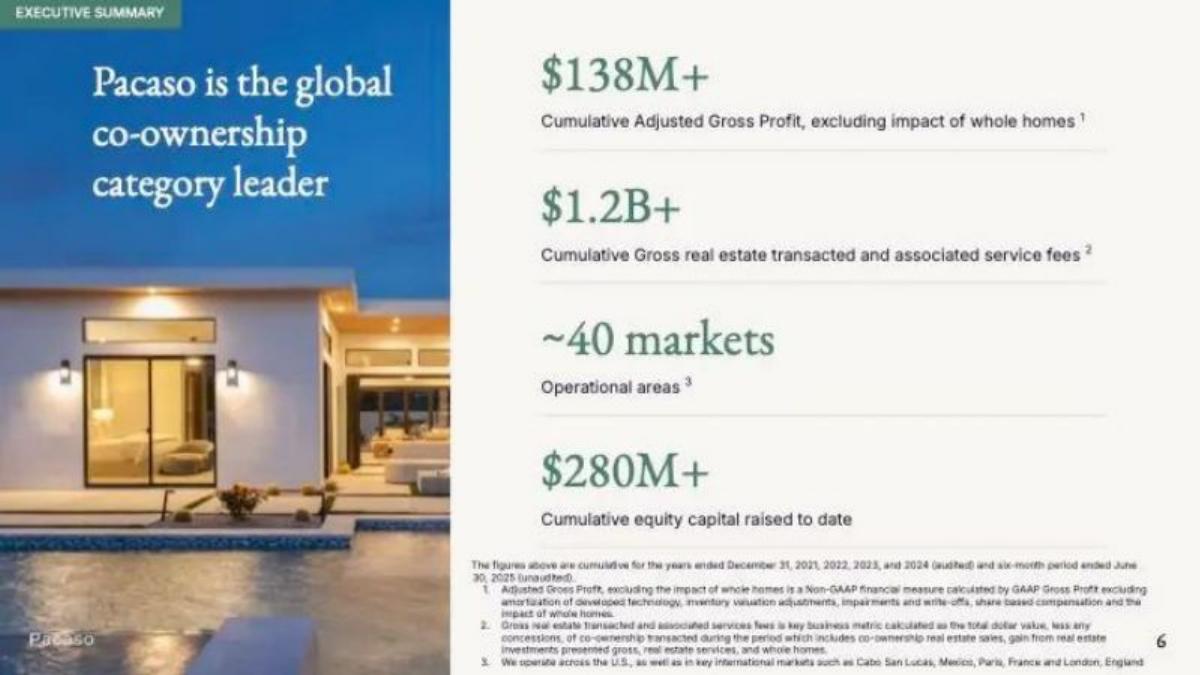
Series D+ (recorded). Co-ownership of second homes. Four cumulative figures with footnotes.
Pacaso deck, slide 6. Exact stored slide matched to this analysis.
Our analysis: Careful definitions, but all-time totals over four and a half years hide whether the business is growing now.
Evidence and limitation: Cumulative gross profit, transaction value and markets, each defined in a footnote; no yearly breakdown.
What a founder can adapt: Keep the definitions, and add the most recent year so the trend is visible.
Supporting analysis
What the deck claims: "Pacaso is the global co-ownership category leader." "$138M+ Cumulative Adjusted Gross Profit, excluding impact of whole homes." "$1.2B+ Cumulative Gross real estate transacted and associated service fees." "~40 markets Operational areas." "$280M+ Cumulative equity capital raised to date." Footnotes define each figure and state the period (2021 to June 2025, partly unaudited).
Presentation choice: Footnotes that define an adjusted figure build trust with investors who will check it.
When it does not fit: Only cumulative totals; they rise even when a business is shrinking.
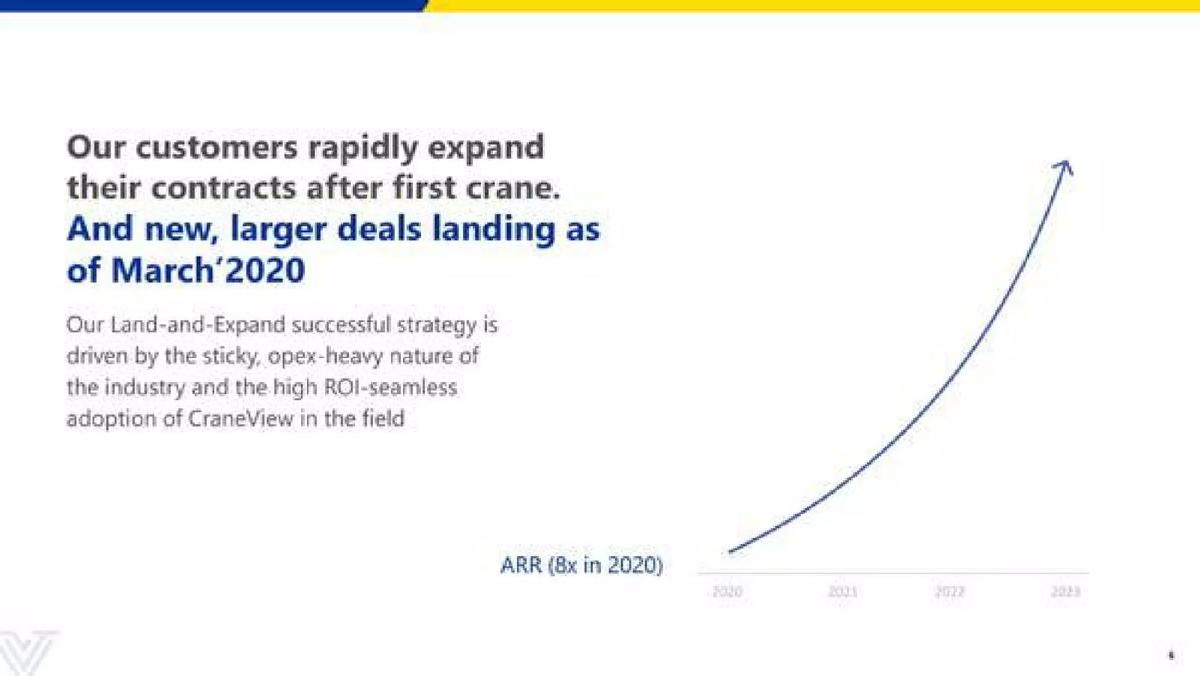
Series B (recorded). Crane monitoring for construction sites. A headline and a curve.
Versatile deck, slide 6. Exact stored slide matched to this analysis.
Our analysis: The weaker example: the claim about customers expanding is not backed by a number, and the curve reads like a forecast.
Evidence and limitation: One multiple (8x ARR growth in 2020); the curve has no values and extends into future years.
What a founder can adapt: Show ARR in dollars by quarter and the share of customers who added cranes.
Supporting analysis
What the deck claims: "Our customers rapidly expand their contracts after first crane. And new, larger deals landing as of March'2020." "Our Land-and-Expand successful strategy is driven by the sticky, opex-heavy nature of the industry and the high ROI-seamless adoption of CraneView in the field." A rising line labelled "ARR (8x in 2020)" over the years 2020 to 2023.
Presentation choice: Included for contrast; a curve with no values asks investors to take growth on trust.
When it does not fit: A line that runs into future years without saying which part is actual.
Whether each slide gives a volume measure, revenue or profit in dollars, a time period and definitions.
Example
Business
Volume
Revenue in dollars
Time period
Definitions
Opendoor
Home buying
Homes sold
By year
2017 to 2019
Footnote
RealtyShares
Real estate investing
Deals, properties
Capital funded
Since 2013
Caption
Latch
Smart building access
No
Growth rates only
FY'20, Q1'21
Preliminary note
iControl
Construction software
Named projects
MRR
Monthly
No
Guamby
Property loans
Applications, investors
No
Jan to Apr 2020
No
Pacaso
Home co-ownership
Markets
Cumulative gross profit
2021 to 2025
Footnotes
Versatile
Crane monitoring
No
No
Unclear
No
Key Takeaways
Give a volume measure: homes, deals, units or projects.
Put revenue or gross profit next to it, with the period.
Say whether figures are cumulative, annual or preliminary.
Label chart axes with values, not just a rising line.
Build your real estate traction slide
Pair transactions with revenue, dated and defined.
Volume. Homes, deals, units or projects, by year or quarter.
Revenue. Revenue, MRR or gross profit for the same periods.
Definitions. Say what is cumulative, adjusted or preliminary.
Growth. A growth rate for a recent period, with its base.
Copyable framework: [n] [homes/deals/units] in [period], up [rate] on [prior period]. [Revenue/MRR] [amount]. [Definition of any cumulative or adjusted figure].
Illustrative example 1 — written by us
Before: ARR (8x in 2020).
After: ARR [amount] at the end of 2020, up from [amount] at the start of the year (8x). [n] customers, [n]% of whom added cranes after the first.
What improved: Our illustrative rewrite; not Versatile's wording. Bracketed parts are placeholders to fill with real facts. It gives the ARR values behind the multiple and backs the land-and-expand claim with a number.
What this guide adds
The library has real estate problem, solution, product, market and business model guides and sector traction guides for SaaS, fintech, AI, marketplaces, healthcare, edtech and logistics, but no real estate traction guide. This page looks at how property companies show volume and revenue.
Sector labels come from the sector recorded for each published teardown (high confidence for six, medium for Versatile, a construction-site crane monitoring company). None of these seven slides appears in another guide. Other slides from the Latch and Pacaso decks are used elsewhere in the library for different lessons.
Four ways real estate decks show traction
Volume and revenue (Opendoor, RealtyShares): transactions and dollars, by year or since launch.
Growth rates (Latch, iControl): percentage growth, sometimes next to a revenue figure.
Two-sided sign-ups (Guamby): both sides of a property platform, month by month.
Cumulative totals (Pacaso, Versatile): all-time figures or a curve, weaker without values.
Common mistakes
A curve with no values. Label at least the start and end points.
Only cumulative totals. Add the latest year or quarter so the trend is visible.
Growth rates with no base. Show the dollar amount behind any percentage.
Sign-ups presented as deals. Separate applications and registrations from completed transactions.
Diagnostic checklist
A transaction volume measure.
Revenue or gross profit in dollars.
Dates for every figure.
Cumulative, adjusted or preliminary figures labelled.
Frequently asked questions
How we chose these examples
Corpus: published pitch deck teardowns on StartupFundraising.com. Founder-uploaded private decks are excluded.
Selection (2026-09-27): we took teardowns whose recorded sector is proptech, with a stored slide image and slide text about traction, growth, customers, revenue, deals or units. We read the candidates, left out market-size slides, funding-history slides, testimonial slides (Clockworks), slides with no stored image (Fifth Dimension), property funds and listed real estate companies reporting portfolio results, and a second slide from the Latch deck, and kept seven that show different ways of presenting real estate traction. Versatile is included as a weaker example for contrast.
Sector is the category recorded for each teardown (high confidence for six; medium for Versatile). Stages as recorded: iControl and Guamby, seed; RealtyShares, Series C; Versatile, Series B; Pacaso, Series D or later; Opendoor and Latch, growth (both slides come from decks for public listings).
Review: stored slide images were checked on 2026-09-27 and matched to company, deck and slide number, and quoted text was read from the images (editorial model review). No person has yet completed an editorial review of this page.
Claims and figures are as shown on the slides; we have not verified them. We make no claim that any slide caused a fundraising outcome.