Logistics Traction Slides: 6 Real Pitch Deck Examples
How delivery and logistics startups show traction: revenue bars with truck deliveries and estimates shaded, a monthly revenue line, packages per week.
Logistics Traction Slides: Real Pitch Deck Examples
Six traction slides from logistics and delivery decks (trucking in Latin America, campus food delivery, cross-border parcel shipping, produce delivery to retailers in India, sidewalk delivery robots, and office coffee delivery), shown in full. In logistics, investors look for volume (shipments, deliveries, kilos), revenue that grows with that volume, and whether each delivery earns more than it costs. The stronger slides pair a volume measure with revenue and a time axis; the weaker one gives percentages on a very small base.
TL;DR
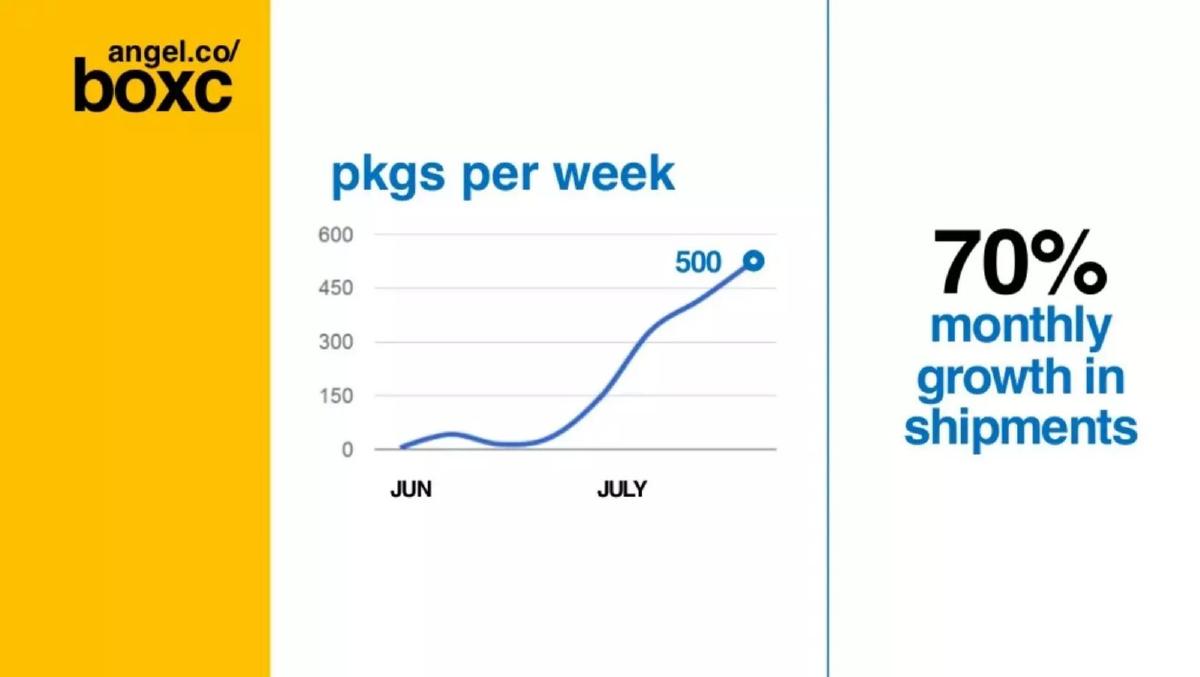
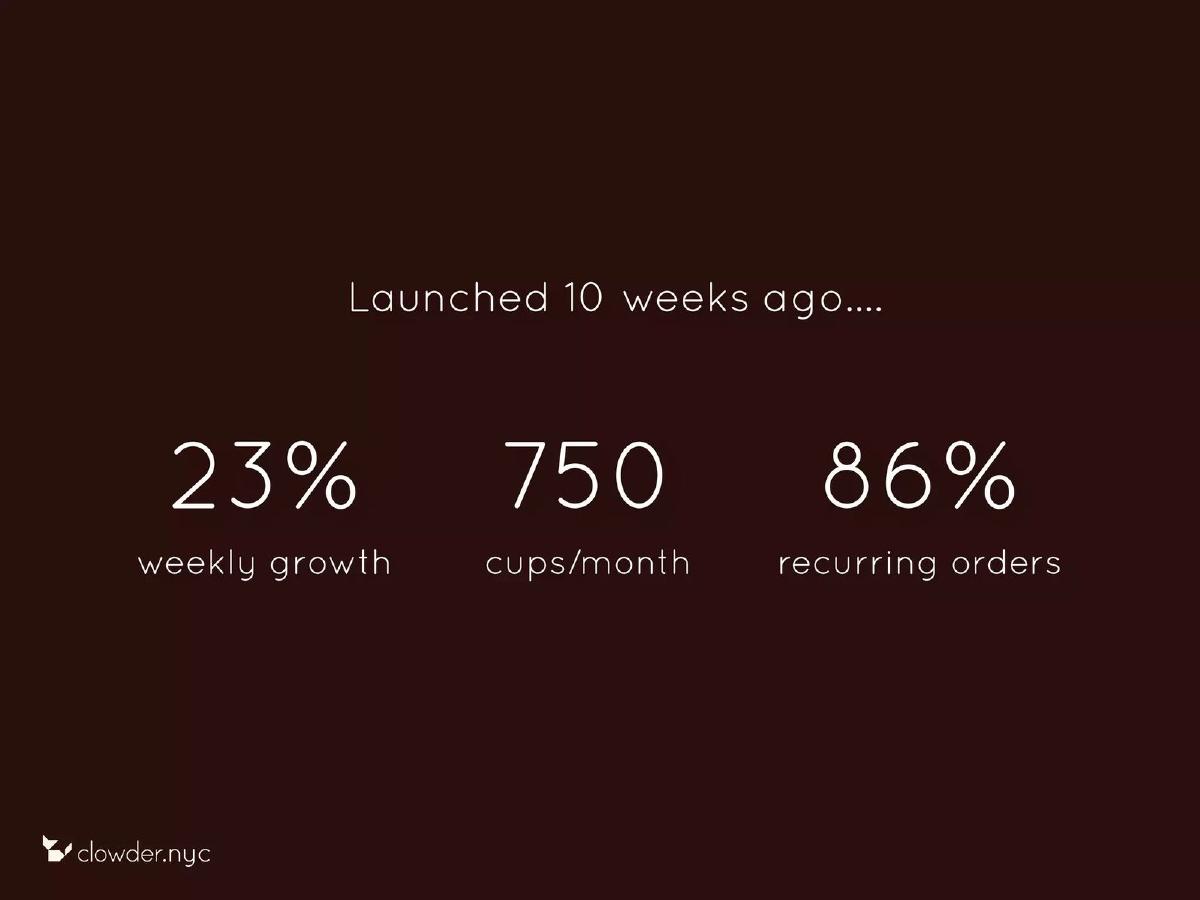
A logistics traction slide should show delivery volume and revenue over time, and mark any estimates. Liftit plots monthly revenue and truck deliveries and shades the three forecast months. EnvoyNow shows monthly revenue from January to May on a labelled dollar axis. BoxC shows packages per week reaching 500 with 70% monthly growth. Farm Bazaar puts a one-month pilot in a table: retailers, kilos per day, expenses, revenue per kilo and total revenue. Coco Robotics states 500,000 lifetime deliveries and two named delivery partners. Clowder gives weekly growth, cups per month and recurring orders ten weeks after launch, the weaker example here.
Logistics traction slides
Each example shows the exact stored slide above its analysis and links to the full teardown. Stronger examples first. Claims and figures are as shown on the slides; we have not verified them.
Liftit traction slide — slide 3
Stage not recorded. Truck freight platform in Latin America. Monthly bars with a line, November 2018 to December 2019.
Liftit deck, slide 3. Exact stored slide matched to this analysis.
Our analysis: The clearest chart here: volume and revenue rise together, and the forecast months are marked and explained rather than blended in.
Evidence and limitation: Revenue and deliveries by month, with October to December shaded as estimates and the basis for the estimate stated; the axes have no values.
What a founder can adapt: Plot revenue and a volume measure by month, shade forecasts and say what they are based on.
Supporting analysis
What the deck claims: "Traction." "We've grown 700% in the past 12 months." Legend: "Revenue", "Truck deliveries", "Estimate Revenue". A marker at December 2018: "closed series A $14M." Footnote: "Estimate is based on current agreements being negotiated for annual cargo capacity."
Presentation choice: Showing deliveries next to revenue lets an investor see growth comes from more loads, not just price.
When it does not fit: Leaving the axes blank; add at least the latest month's revenue and delivery count.
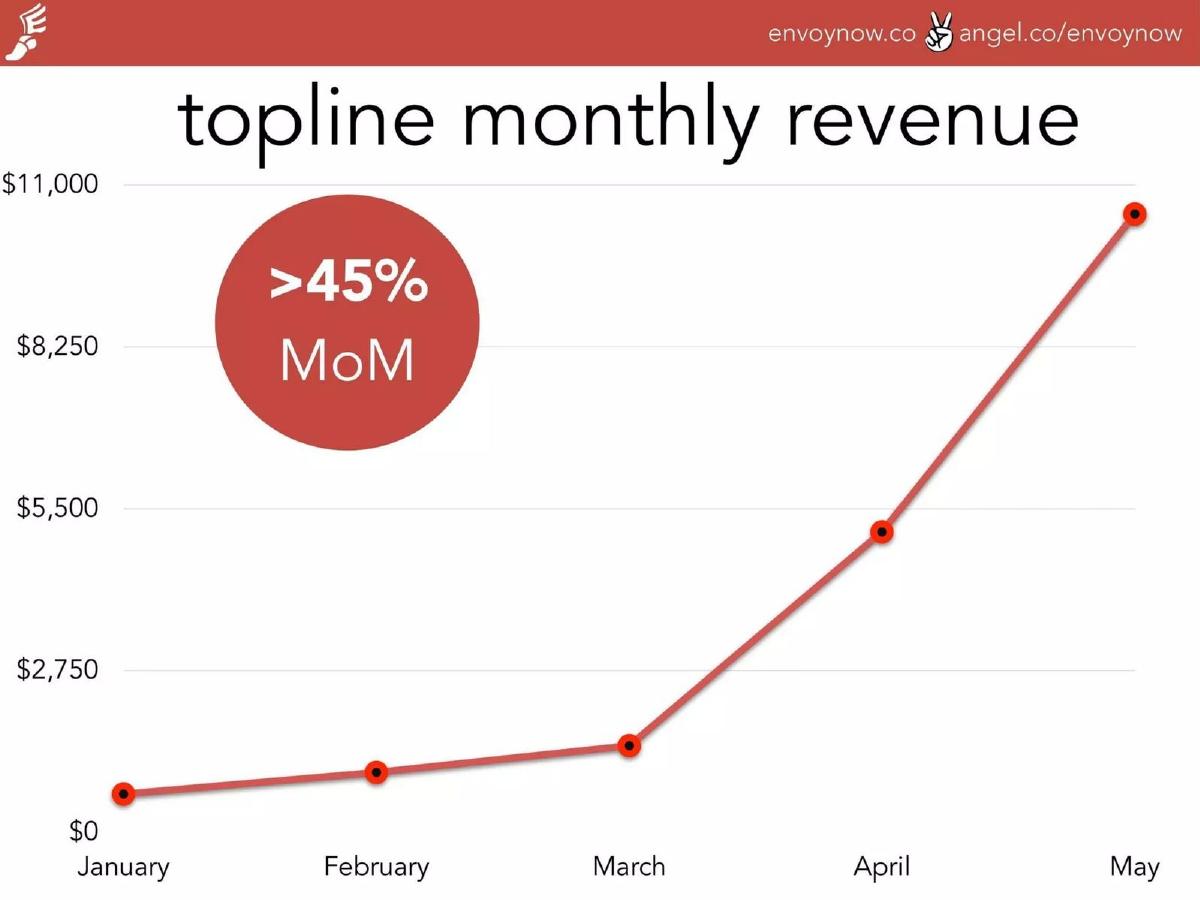
Seed (recorded). Student-run food delivery on campuses. One line chart, January to May.
EnvoyNow deck, slide 4. Exact stored slide matched to this analysis.
Our analysis: Simple and readable: an investor can see revenue went from a few hundred dollars to about $10,500 a month. The chart actually shows faster growth than the ">45%" label claims.
Evidence and limitation: Monthly revenue on a labelled axis for five months; no year and no order count.
What a founder can adapt: Label the revenue axis and add the year; put orders or deliveries on the same chart.
Supporting analysis
What the deck claims: "topline monthly revenue." ">45% MoM." A line on a dollar axis from $0 to $11,000, with points for January, February, March, April and May, the last just under $11,000.
Presentation choice: A labelled dollar axis makes the size of the business clear, not just the shape of the curve.
When it does not fit: A growth label that understates or overstates the chart; state the exact figure for the period.
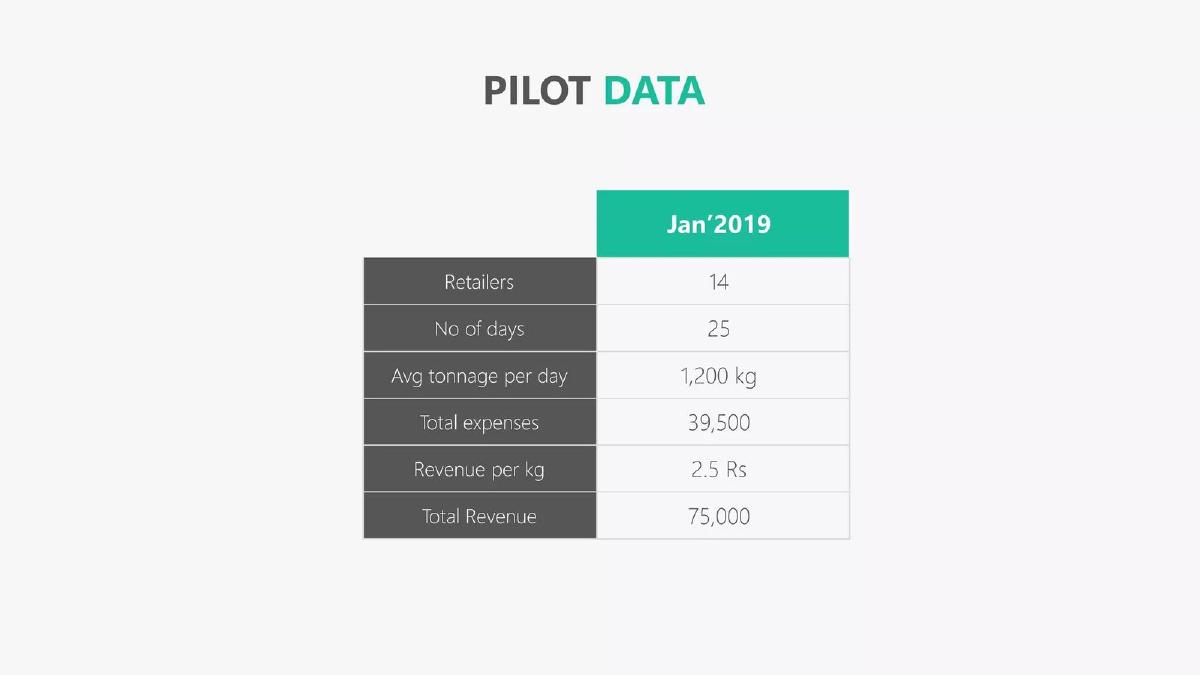
Early stage / pilot (recorded; stage not mapped). Produce delivery to retailers in India. A one-column table.
Farm Bazaar deck, slide 5. Exact stored slide matched to this analysis.
Our analysis: Small, but honest and complete: an investor can check the maths and see the pilot covered its costs.
Evidence and limitation: Customers, days, daily volume, revenue per kilo, total revenue and total expenses for one month; the figures agree (1,200 kg x 25 days x 2.5 Rs = 75,000).
What a founder can adapt: Show your pilot's volume, price per unit, revenue and costs for one clear period.
Supporting analysis
What the deck claims: "PILOT DATA." "Jan'2019." "Retailers 14." "No of days 25." "Avg tonnage per day 1,200 kg." "Total expenses 39,500." "Revenue per kg 2.5 Rs." "Total Revenue 75,000."
Presentation choice: Putting revenue and expenses for the same period on one slide answers whether each delivery makes money.
When it does not fit: Leaving the currency off totals; write "Rs 75,000" rather than "75,000".
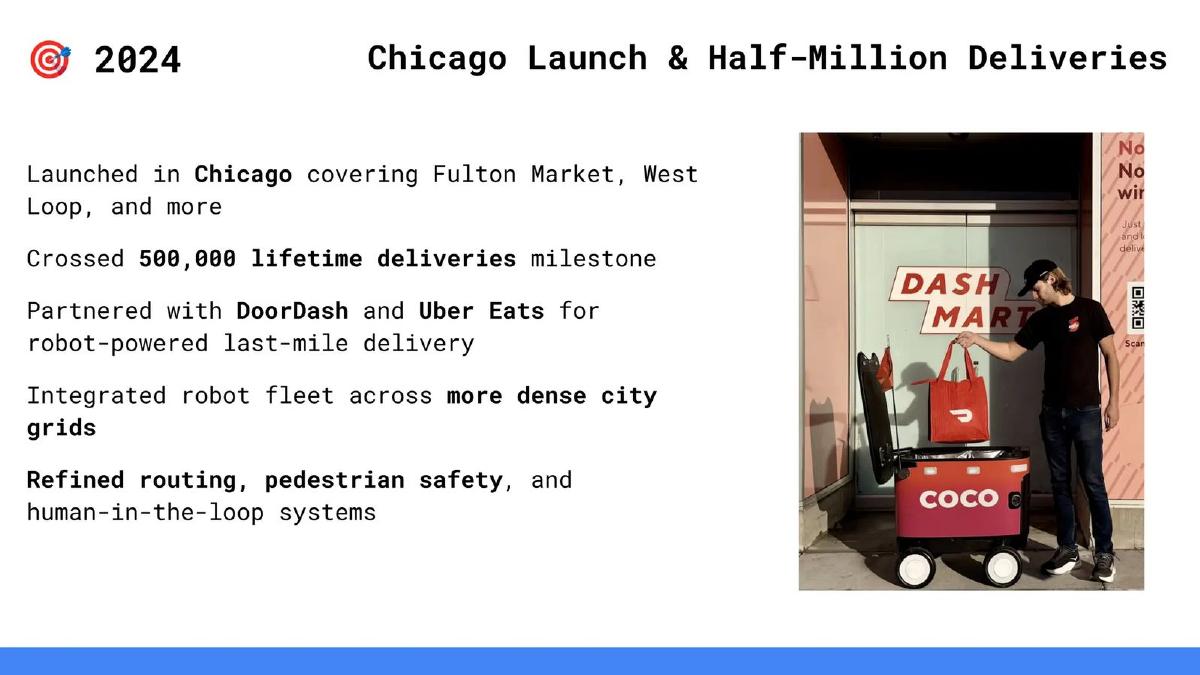
Series B (recorded). Sidewalk delivery robots. One slide in a year-by-year company timeline, with a photo.
Coco Robotics deck, slide 5. Exact stored slide matched to this analysis.
Our analysis: A milestone slide: the delivery count and partner names give scale and credibility, but not growth rate or economics.
Evidence and limitation: A cumulative delivery count, a new city and two named partners; no revenue, fleet size or deliveries per robot.
What a founder can adapt: State lifetime deliveries and name partners, then add monthly deliveries so growth is visible.
Supporting analysis
What the deck claims: "2024." "Chicago Launch & Half-Million Deliveries." "Launched in Chicago covering Fulton Market, West Loop, and more." "Crossed 500,000 lifetime deliveries milestone." "Partnered with DoorDash and Uber Eats for robot-powered last-mile delivery." "Integrated robot fleet across more dense city grids." "Refined routing, pedestrian safety, and human-in-the-loop systems."
Presentation choice: Named partners that already run large delivery networks tell investors the product is trusted in real operations.
When it does not fit: Operational bullets (routing, safety) on a traction slide; move them to the product slide.
After: [n] office customers and 750 cups delivered in [month], 10 weeks after launch. Weekly orders up 23% on average over [period]; 86% of orders are recurring. Monthly revenue: [amount].
What improved: Our illustrative rewrite; not Clowder's wording. Bracketed parts are placeholders to fill with real facts. It says what is growing, adds customers and revenue, and dates the figures.
What this guide adds
The library has logistics problem, solution and product guides and sector traction guides for SaaS, fintech, AI, marketplaces, healthcare and edtech, but no logistics traction guide. This page looks at how delivery and logistics companies show volume and revenue.
Sector labels come from the sector recorded for each published teardown (high confidence for Liftit and BoxC, medium for the other four, which were filed under logistics alongside food delivery, robotics or agriculture). None of these six slides appears in another guide.
Four ways logistics decks show traction
Revenue and volume over time (Liftit, EnvoyNow, BoxC): a chart by month or week.
Pilot results (Farm Bazaar): one period's operating numbers in a table.
Milestones (Coco Robotics): a cumulative delivery count and named partners.
Big numbers (Clowder): a few percentages and one volume figure, weaker when the base is small.
Common mistakes
Blank axes. Label at least the latest value so investors can see the size of the business.
Forecasts mixed with actuals. Shade or label estimated months and state the basis.
Growth rate with no base. Put the absolute volume next to any percentage.
Volume without revenue. Show what the deliveries earn, and what they cost if you can.
Diagnostic checklist
A volume measure by week or month.
Revenue for the same period, with values.
Forecasts clearly marked.
Revenue and cost per delivery, if available.
Frequently asked questions
How we chose these examples
Corpus: published pitch deck teardowns on StartupFundraising.com. Founder-uploaded private decks are excluded.
Selection (2026-09-27): we took teardowns whose recorded sector is logistics, with a stored slide image and slide text about traction, growth, deliveries, shipments, revenue or pilots. We read the candidates, left out market-size slides, slides already used in other guides (Shiplyst, Smatbeba, HomeCooks, Wolt), slides with no stored image (Postmates, Smartlane), and oilfield, trucking-acquisition and fuel-distribution decks whose slides report financial results rather than startup traction, and kept six that show different ways of presenting logistics traction. Clowder is included as a weaker example for contrast. We found six suitable slides rather than forcing a seventh.
Sector is the category recorded for each teardown (high confidence for Liftit and BoxC, medium for EnvoyNow, Farm Bazaar, Coco Robotics and Clowder). Stages as recorded: EnvoyNow, Clowder and BoxC, seed (BoxC low confidence); Coco Robotics, Series B; Farm Bazaar, early stage/pilot; Liftit, not recorded. The Coco Robotics slide comes from a company timeline deck rather than a single fundraising round.
Review: stored slide images were checked on 2026-09-27 and matched to company, deck and slide number, and quoted text was read from the images (editorial model review). No person has yet completed an editorial review of this page.
Claims and figures are as shown on the slides; we have not verified them. We make no claim that any slide caused a fundraising outcome.