Soundwave’s 2012 deck is a study in narrative economy. Eschewing the text-heavy slides common in the era, the founders used a high-contrast, visual-first approach to explain a complex real-time tracking technology. The deck successfully bridges the gap between a consumer 'music discovery' tool and a professional 'music analytics' platform. By framing their data as the 'Bloomberg Terminal' for the music industry, they moved the conversation from fickle consumer social trends to indispensable enterprise utility. This teardown examines how the 22 available slides (out of 43) build a case for rea…
Key takeaways
- The deck uses a 'Music Discovery' hook but immediately pivots to 'Music Analytics' on the cover slide to signal business value.
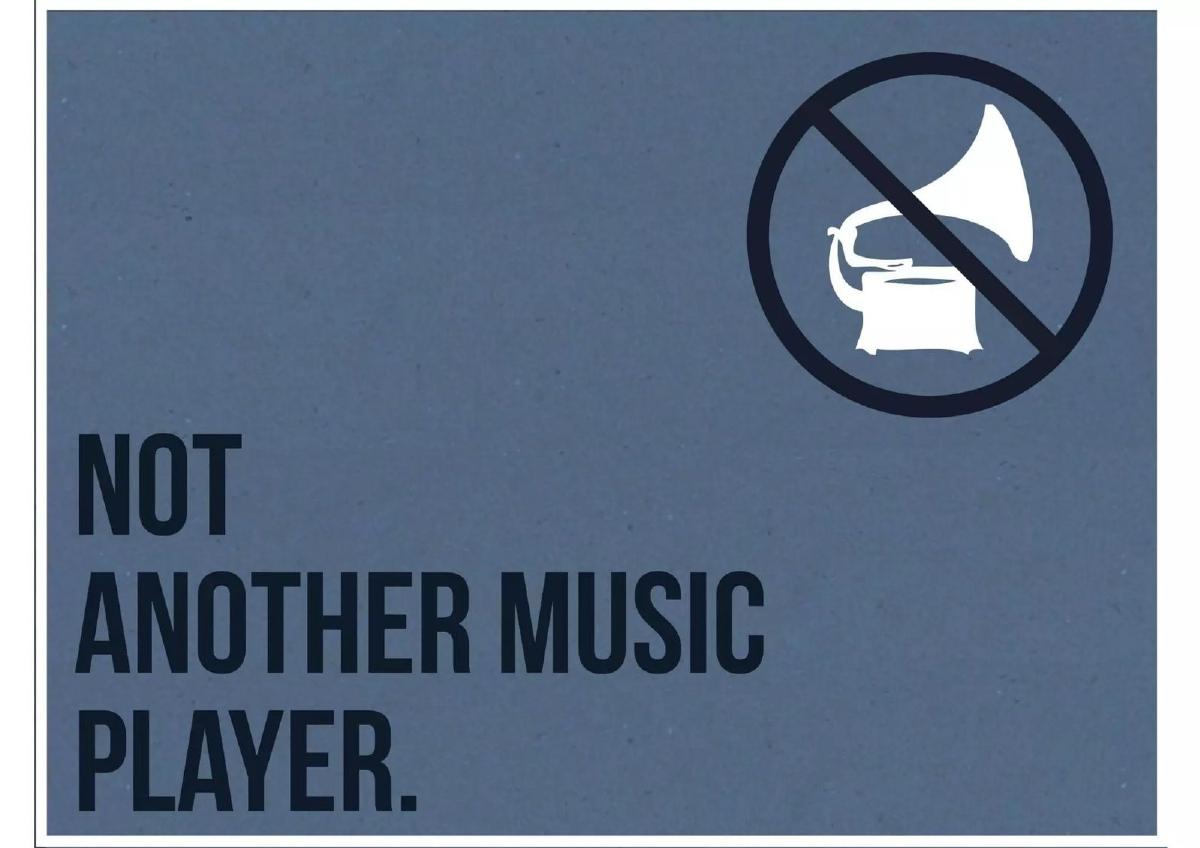
- Slide 3 explicitly differentiates the product by stating it is 'Not another music player,' avoiding the licensing pitfalls of streaming.
- The core value proposition is built on three pillars: Song, Location, and Time, as visualized on slides 4 and 5.
- Hyper-local discovery is demonstrated through 'Sound Circles,' showing real-time listening data in specific buildings (Slide 8).
- The deck uses a powerful analogy on Slide 16, calling the product 'The equivalent of a Bloomberg Terminal' for music.
- Revenue is diversified across three streams: Subscription Analytics, Enterprise Sales, and Affiliation/Advertising (Slides 18-19).
- The team slide focuses on 'Team Additions' rather than just founders, highlighting specific technical and strategic hires (Slide 21).
- The narrative concludes by comparing the service to Twitter, framing it as a status update for what a user is listening to (Slides 20-22).
The Visual Narrative of Soundwave
The Soundwave pitch deck from 2012 is a masterclass in minimalist design. In an era where many decks were still cluttered with bullet points and low-resolution charts, Soundwave opted for a high-contrast, icon-driven aesthetic. This teardown covers 22 of the 43 slides, which focus heavily on the product's unique data proposition and its transition from a consumer app to a B2B analytics powerhouse. The company eventually raised $2.9 million from investors including Mark Cuban and was acquired by Spotify in 2016.
Slides 1-5: Defining the Category
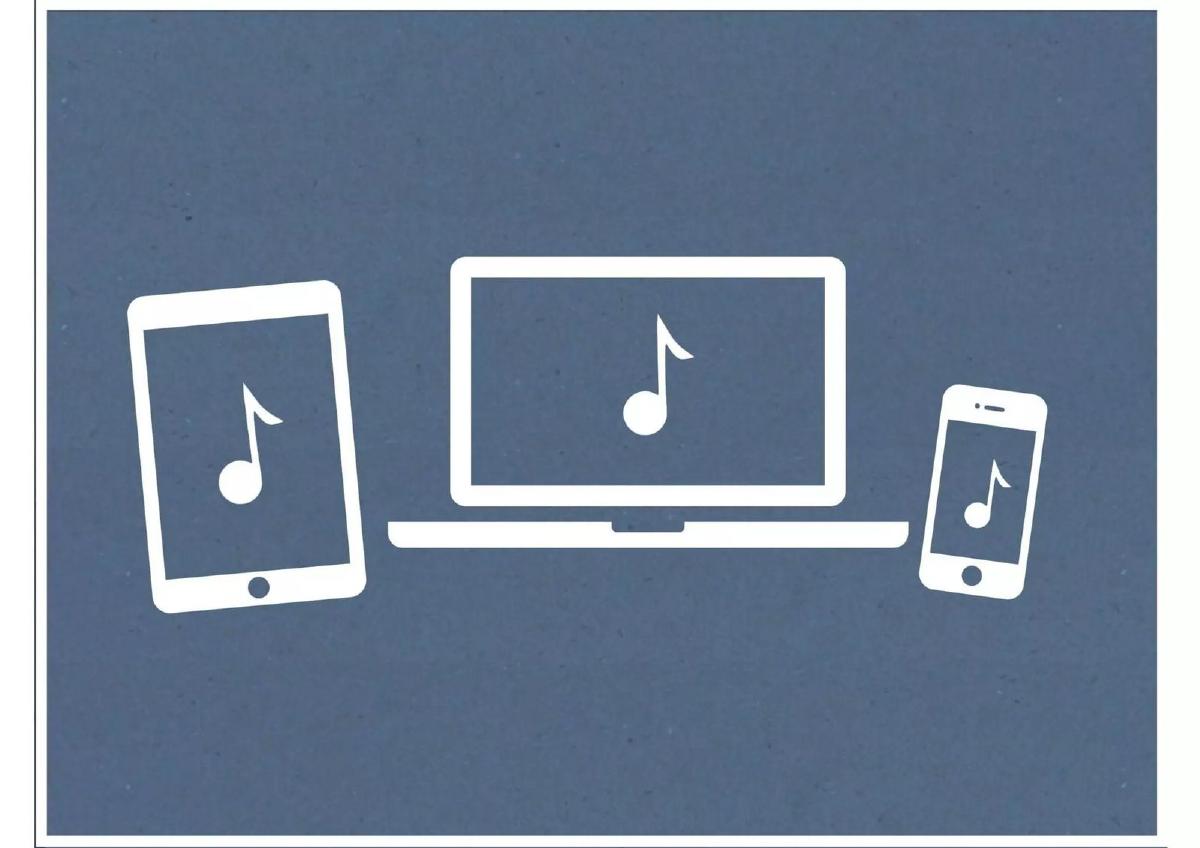
Slide 1 sets the tone immediately. While the logo says 'Soundwave,' the sub-header is 'music analytics.' This is a critical distinction. They aren't selling a song; they are selling the data about the song. Slide 2 introduces the consumer hook: 'It's music discovery. On a whole new level.' This creates a bridge between what the user sees and what the business collects.
Slide 3 is perhaps the most important strategic slide in the deck. It features a crossed-out gramophone and the text 'NOT ANOTHER MUSIC PLAYER.' In 2012, the music streaming wars were heating up. By explicitly stating they are not a player, Soundwave signals to investors that they don't have the massive overhead of music licensing fees or the direct competition of Spotify or Rdio. Instead, they sit on top of those services.
Slides 4 and 5 break down the data components. They identify three pillars: Song, Location, and Time . By highlighting 'Song' on Slide 4 and 'Time' on Slide 5, they emphasize that their data isn't just about what people like, but exactly when and where they are listening to it. This is the foundation of their 'real-time' value proposition.
Slides 6-10: The 'Sound Circles' Product Demo
Rather than showing a standard app screenshot, Soundwave uses Slides 6 through 9 to explain their 'Sound Circles' feature. This is a clever way to demonstrate technical capability through storytelling. Slide 7 shows a map of Dublin (City) with multiple pins. A callout shows a user listening to 'Midnight City' by M83 just 12 seconds ago. Slide 8 zooms in further to the 'NDRC Building,' showing a user listening to U2's 'Beautiful Day' 8 seconds ago. Slide 9 introduces 'Filters,' showing how a user can sort this real-time data by 'Time' (Today) and 'Genre' (Pop).
This sequence proves three things: the technology works in real-time, it is hyper-local, and it is searchable. It transforms a vague concept into a tangible utility. Slide 10 introduces 'Sound Circle: D.J. Friends,' suggesting a social layer where users can follow specific influencers to see their real-time listening habits, adding a 'follow' mechanic similar to Twitter.
Slides 11-17: The Pivot to Business Value
Slide 11 is a transition slide: 'THIS CREATES INSTANT VALUE FOR ME.' It speaks from the perspective of the user, but Slide 12 immediately asks the investor's question: 'SO HOW IS THIS A BUSINESS?'
Slides 13 and 14 use simple iconography to show a 'dark' room of listeners being 'lit up' by a spotlight. This is a metaphor for the music industry's lack of visibility into actual consumer behavior. Before Soundwave, labels relied on sales data or radio play; Soundwave offers a look at the actual moment of consumption. Slide 15 reinforces this with the quote 'WHAT GETS MEASURED, GETS MANAGED.'
Slide 16 contains the deck's 'North Star' analogy: 'THE EQUIVALENT OF A BLOOMBERG TERMINAL.' This is a high-status comparison. A Bloomberg Terminal is an expensive, essential tool for finance professionals. By positioning their analytics platform this way, Soundwave justifies a high B2B price point and moves away from the 'free app' stigma. Slide 17 shows a monitor with a growth chart, reinforcing the professional nature of the data.
Slides 18-22: Revenue and Team
Slides 18 and 19 detail the three-pronged revenue model. The first pillar is a 'Subscription Analytics Service' targeting artists, band managers, agents, radio stations, and journalists. The second is 'Enterprise Sales' aimed at telcos, major labels, brands, and ad agencies. The third is 'Affiliation Programmes & Advertising,' which includes selling digital music, concert tickets, and merchandise through the app. This is a comprehensive list that covers almost every stakeholder in the music ecosystem.
Slide 20 draws a final comparison to Twitter. It shows a phone with a tweet: 'Soundwave lift off presentation today.' Slide 22 completes the analogy: 'Twitter. I'm here. This is what I'm saying. Soundwave. I'm here. This is what I'm listening to.' This framing helps investors understand the potential for viral growth and daily active usage.
Slide 21 introduces 'Team Additions.' Interestingly, this specific slide doesn't focus on the founders (Brendan O’Driscoll, Aidan Sliney, and Craig Watson), but rather on the technical and advisory talent they've brought on, including developers like Sylvester Eigbogba and Noel Lynch, and advisors like Matt Bonner. This suggests a 'Later' stage deck where the focus is on scaling the organization rather than just the initial vision.
What Works in This Deck
Visual Consistency: The deck uses a limited color palette (slate blue, white, and black) and consistent typography. This gives it a professional, 'premium' feel that matches the 'Bloomberg Terminal' ambition.
The 'Not a Player' Positioning: By explicitly distancing themselves from music players, they avoided the primary concern of investors in the music space: licensing costs and the dominance of Apple/Spotify.
The Sound Circle Walkthrough: The step-by-step zoom from city to building to specific song is a highly effective way to demonstrate 'Real-Time' and 'Location' without using a single line of technical jargon.
Multi-Channel Revenue: Showing that the data is valuable to both a local band manager (subscription) and a global telco (enterprise) demonstrates a massive Total Addressable Market (TAM).
What is Missing from This Deck
Unit Economics: While the revenue streams are listed, there is no mention of Customer Acquisition Cost (CAC) or Lifetime Value (LTV). For a mobile app, these are usually critical metrics.
User Growth Data: Although the catalogue listing mentions 1.5 million users, these specific slides do not show a growth curve or retention data. This might have been in the 21 slides not included in this set.
The Competitive Landscape: There is no slide comparing Soundwave to other analytics tools like Next Big Sound (acquired by Pandora) or Echo Nest (acquired by Spotify). Investors would want to know how Soundwave's location data beats the existing web-based analytics.
The Ask: There is no slide detailing how much money is being raised or how the funds will be allocated. This is a common omission in public versions of decks but is a vital component of a real pitch.
What a Founder Should Copy
The 'Bloomberg' Analogy: If you are building a data company, find the 'gold standard' tool in a different industry (Bloomberg for finance, Salesforce for sales, Nielsen for TV) and explain why you are that tool for your specific niche.
Minimalist Demo: Don't just show a screenshot. Show a process . The way Soundwave walked through the 'Sound Circle' is much more memorable than a static image of a map.
Category Rejection: If your industry has a 'bad' category (like 'music player' in 2012), explicitly state that you are not in that category. It saves time and prevents the investor from applying the wrong mental model to your business.
Focus on 'Team Additions': If you are raising a follow-on round, showing who you have been able to recruit is often more impressive than just listing the founders. It proves the company is a magnet for talent.
Conclusion Soundwave's deck is a masterclass in how to sell 'invisible' value. Data is hard to visualize, but by using maps, spotlights, and strong analogies, they made their real-time tracking feel like a revolutionary new utility. The acquisition by Spotify four years later validates the core thesis of the deck: that the data about music is just as valuable as the music itself.
Frequently asked questions
- What was Soundwave's primary business model according to the deck?
- Soundwave proposed a three-pillar revenue strategy. First, a subscription analytics service for artists, managers, and journalists. Second, enterprise data sales to telcos, major labels, and ad agencies. Third, an affiliation model generating revenue from digital music sales, concert tickets, and targeted advertising based on real-time listening habits.
- How did Soundwave differentiate itself from Spotify or Pandora?
- Slide 3 explicitly states the company is 'Not another music player.' Instead of streaming music, Soundwave focused on tracking what people were already listening to across various platforms, adding layers of time and location data to create a 'music analytics' layer that players lacked at the time.
- What is the significance of the 'Bloomberg Terminal' analogy?
- By calling itself the 'Bloomberg Terminal' for music on Slide 16, Soundwave shifted its perceived value from a 'nice-to-have' social app to a 'must-have' professional tool. This suggested that their data was high-frequency, accurate, and essential for professionals making financial decisions in the music industry.
- Who were the target customers for Soundwave's enterprise data?
- According to Slide 19, the enterprise sales targets included telecommunications companies (telcos), major record labels, consumer brands, and advertising agencies. These entities would use the real-time geographic listening data to better target their marketing spend and talent scouting.
- How did the deck demonstrate the product's technical capability?
- The deck used 'Sound Circles' (Slides 6-9) to show real-time data visualization. By showing a map of the 'NDRC Building' and identifying a specific user listening to U2's 'Beautiful Day' just 8 seconds prior, they proved the platform's low-latency tracking and granular location accuracy.